
Empfohlen
Empfohlen
Weitere ähnliche Inhalte
Kürzlich hochgeladen
Kürzlich hochgeladen (20)
Empfohlen
Empfohlen (20)
Marcus Millichap 2009 Medical Office Report
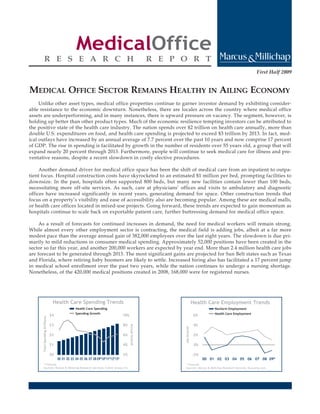
- 1. First Half 2009 MEDICAL OFFICE SECTOR REMAINS HEALTHY IN AILING ECONOMY Unlike other asset types, medical office properties continue to garner investor demand by exhibiting consider- able resistance to the economic downturn. Nonetheless, there are locales across the country where medical office assets are underperforming, and in many instances, there is upward pressure on vacancy. The segment, however, is holding up better than other product types. Much of the economic resilience tempting investors can be attributed to the positive state of the health care industry. The nation spends over $2 trillion on health care annually, more than double U.S. expenditures on food, and health care spending is projected to exceed $3 trillion by 2013. In fact, med- ical outlays have increased by an annual average of 7.7 percent over the past 10 years and now comprise 17 percent of GDP. The rise in spending is facilitated by growth in the number of residents over 55 years old, a group that will expand nearly 20 percent through 2013. Furthermore, people will continue to seek medical care for illness and pre- ventative reasons, despite a recent slowdown in costly elective procedures. Another demand driver for medical office space has been the shift of medical care from an inpatient to outpa- tient focus. Hospital construction costs have skyrocketed to an estimated $1 million per bed, prompting facilities to downsize. In the past, hospitals often supported 800 beds, but many new facilities contain fewer than 100 beds, necessitating more off-site services. As such, care at physicians’ offices and visits to ambulatory and diagnostic offices have increased significantly in recent years, generating demand for space. Other construction trends that focus on a property’s visibility and ease of accessibility also are becoming popular. Among these are medical malls, or health care offices located in mixed-use projects. Going forward, these trends are expected to gain momentum as hospitals continue to scale back on exportable patient care, further buttressing demand for medical office space. As a result of forecasts for continued increases in demand, the need for medical workers will remain strong. While almost every other employment sector is contracting, the medical field is adding jobs, albeit at a far more modest pace than the average annual gain of 382,000 employees over the last eight years. The slowdown is due pri- marily to mild reductions in consumer medical spending. Approximately 52,000 positions have been created in the sector so far this year, and another 200,000 workers are expected by year end. More than 2.4 million health care jobs are forecast to be generated through 2013. The most significant gains are projected for Sun Belt states such as Texas and Florida, where retiring baby boomers are likely to settle. Increased hiring also has facilitated a 17 percent jump in medical school enrollment over the past two years, while the nation continues to undergo a nursing shortage. Nonetheless, of the 420,000 medical positions created in 2008, 168,000 were for registered nurses. Health Care Spending Trends Health Care Employment Trends Health Care Spending Nonfarm Employment Spending Growth Health Care Employment $4 10% 6% Total Spending (trillions) $3 8% 4% Annual Growth Job Growth $2 6% 2% $1 4% 0% $0 2% -2% 00 01 02 03 04 05 06 07 08 09*10*11*12*13* 00 01 02 03 04 05 06 07 08 09* * Forecast * Forecast Sources: Marcus & Millichap Research Services, CoStar Group, Inc. Sources: Marcus & Millichap Research Services, Economy.com
- 2. NATIONAL TRENDS ◆ Demographic Trends: The aging population continues to support expan- Population Growth by Age Group sion in the medical office market, although the struggling economy has put 2000-2008 6% a damper on recent exuberance. Mounting requirements for expanded 2009-2013* Avg. Annual Percent Change health care remain centered on the maturing population, particularly in 4% the nation’s retiree havens. Over the next five years, the population of those between the ages of 65 and 74 will increase 24 percent nationwide 2% and nearly 30 percent in the Southeast and Southwest combined. 0% ◆ Construction Trends: In response to increased demand for medical space, -2% developers have ramped up deliveries since 2003. Completions peaked last Age Age Age Age Age Age Age 0-4 5-19 20-24 25-44 45-54 55-64 65+ year at more than 17 million square feet of space. Almost one-third of the * Forecast new inventory came online in the Southwest, where a once-booming hous- Sources: Marcus & Millichap Research Services, U.S. Census Bureau ing market and robust population growth supported demand. Despite the strength of medical office properties, the current economy has prompted developers to cut deliveries for the foreseeable future. Completions are forecast to drop to 14.1 million square feet this year, or an inventory expan- sion of 2.6 percent. ◆ Rent/Vacancy Trends: Uncertainties in the economy, including layoffs and corporate benefit cuts, have prompted many consumers to forgo routine Fastest-Growing Metros: 2009-2013* health care and some elective procedures. The resulting decrease in demand Age 55 and Older will contribute to pushing vacancy up 100 basis points this year to 12.4 per- 26% cent. Consequently, after finishing 2008 up 1 percent at $24.60 per square Percent Growth 24% foot, asking rents are expected to dip roughly 2.7 percent by year end. 22% ◆ Investment Trends: Demand for medical office assets remains strong, 20% although transaction levels in 2008 were down 15 percent from those recorded a year earlier. Cap rates have climbed over the past year to the 18% high-7 percent to low-8 percent range, fueled by tightening underwriting h SB a o tte on as x in ac nt ni nd t P ust eg e- cs lo Be la oe la standards and adjusting buyer expectations. At the close of 2008, the medi- sV id ar Tu At A Or Ph m rs Ch La al ve an price was up 1 percent from the previous year at $210 per square foot. Ri es * Forecast W Sources: Marcus & Millichap Research Services, U.S. Census Bureau NORTHEAST ◆ Construction Trends: Dense populations within the Northeast region’s large cities help to drive demand for health care; increasingly, however, more hos- pitals are choosing to expand and office space is springing up in suburban areas where young families are locating. Developers are expected to com- plete of 1.3 million square feet of medical office space in 2009, the majority of which will be in these growing areas. This year’s deliveries will be down 25 Construction by Region percent from 2008. 2008 2009* 8 ◆ Rent/Vacancy Trends: Vacancy is forecast to increase again this year as Square Feet (millions) 6 development continues to precede demand. After climbing 40 basis points in 2008 on the heels of a ramp-up in construction, vacancy is projected to rise 50 4 basis points to 9.8 percent. As such, owners are expected to cut rents, fol- lowing a 2.7 percent bump last year. Robust development in Northern New 2 Jersey will effect a 50 basis point jump in vacancy, although moderate demand will enable local owners to hold rents relatively firm at slightly less 0 than $25.00 per square foot. NE SE Midwest SW/ W/Pacific Mountain NW * Forecast Sources: Marcus & Millichap Research Services, CoStar Group, Inc., TWR ◆ Investment Trends: Investors’ interest in the Northeast region remains strong as comparatively healthy fundamentals lure buyers. Investment activ- ity surged last year, with transaction velocity jumping 21 percent. The medi- an price dropped 3 percent to $195 per square foot, while cap rates averaged in the low-7 percent range. Regional definitions are available on page 4. page 2 Marcus & Millichap ◆ Medical Office Research Report
- 3. SOUTHEAST ◆ Construction Trends: After completing 2.3 million square feet in 2008, devel- opers are forecast to deliver 4 million square feet of space this year. Nearly 40 Vacancy by Region: 4Q08 percent of the projects are located in Florida, slightly above the state’s five- 20% year annual average. 15% Vacancy Rate ◆ Rent/Vacancy Trends: Robust development resulted in a 150 basis point jump in vacancy last year to 11.6 percent. Vacancy is forecast to rise approxi- 10% mately 100 basis points in 2009 as new product comes online. The long-term 5% outlook for the region’s popular retiree locales remains favorable, however, as healthy population gains in older age cohorts will support increased 0% demand for space. Nonetheless, asking rents are expected to fall until vacan- W/Pacific NE Midwest SE SW/ U.S. NW Mountain Avg. cy moderates, with the largest corrections projected in central Florida. Sources: Marcus & Millichap Research Services, CoStar Group, Inc. ◆ Investment Trends: Expectations for solid long-term fundamentals will con- tinue to support investors’ interest in the region. Sales activity rose again in 2008, with both transaction volume and dollar volume growing from the pre- vious year. The median price, however, dropped by about 1 percent to $202 per square foot, while cap rates increased 40 basis points to 7.9 percent. MIDWEST ◆ Construction Trends: Medical office developers remain active in the Asking Rents by Region: 4Q08 Midwest, fueled by robust demand from growing health care and bio- Avg. Asking Rent per Square Foot research facilities in Ohio. Completions in the region continue to average $40 approximately 3 percent of inventory, with roughly 4.4 million square feet of $30 space forecast for delivery this year. ◆ Rent/Vacancy Trends: New additions to stock will be met with solid $20 demand, keeping vacancy from spiking considerably. After ticking up 20 $10 basis points last year to 11 percent, vacancy is expected to register a similar bump in 2009. As a result, owners in the Midwest are forecast to cut rents this $0 year to keep vacancy in check. Midwest SE SW/ NE W/Pacific U.S. Mountain NW Avg. ◆ Investment Trends: Investor demand remains strong in the Midwest, with Sources: Marcus & Millichap Research Services, CoStar Group, Inc., REIS transaction activity up slightly in 2008. Increased demand put modest upward pressure on prices last year, as the median price inched up 5 percent to $146 per square foot. Cap rates, meanwhile, compressed 30 basis points to an average of 8.1 percent. SOUTHWEST/MOUNTAIN ◆ Construction Trends: After several years of robust completions in excess of 4 percent of inventory annually, medical office construction is beginning to Medical Office Sales Trends slow in the Southwest as increasing vacancy and the sour economy dampen Median Price per Square Foot builder sentiment. This year, developers are forecast to deliver 3 million Median Price per Square Foot Average Cap Rate $250 10% square feet of space, adding 2.3 percent to inventory. Average Cap Rate $200 9% ◆ Rent/Vacancy Trends: In 2008, heightened construction activity generated a 180 basis point jump in vacancy to 13.2 percent. Vacancy is forecast to con- $150 8% tinue rising in 2009 as economic conditions are magnified by the lingering effects of last year’s deliveries. After advancing through mid-2008 and then $100 7% mitigating through the second half, rents are expected to fall this year as own- $50 6% ers seek to keep increasing vacancy rates restrained. Phoenix will be especial- 03 04 05 06 07 08 ly hard-hit, with vacancy in the metro forecast to approach 20 percent. * Estimate Sources: Marcus & Millichap Research Services, CoStar Group, Inc. ◆ Investment Trends: In 2008, investment activity for medical office product slowed in the region, with dollar volume falling almost 20 percent and the number of sales dropping approximately 30 percent. The median price rose slightly and currently is in the $200 per square foot range, while cap rates con- tinue to average at the mid-7 percent level. Regional definitions are available on page 4. Marcus & Millichap ◆ Medical Office Research Report page 3
- 4. WEST/PACIFIC NORTHWEST ◆ Construction Trends: In the West/Pacific Northwest region, developers are pulling back on deliveries, particularly in Riverside-San Bernardino and Las HEALTHCARE REAL ESTATE GROUP Vegas. Completions in the region will drop by more than 60 percent this year as inventory expands just 1 percent, compared with an average annual stock Marcus & Millichap’s Healthcare Real Estate increase of nearly 4 percent over the past several years. Group is comprised of real estate investment professionals who specialize in healthcare prop- ◆ Rent/Vacancy Trends: Despite a substantial contingent of retirees and grow- erties nationwide. In addition to offering spe- ing populations, the region will continue to record increased vacancy, cialized market knowledge, members of the Healthcare Real Estate Group are able to the spurred by recessionary conditions and high development levels in 2008. leverage the firm’s network of more than 1,300 Nonetheless, vacancy in the region remains the lowest in the nation at 9.2 investment professionals to help clients meet percent. Rents are not expected to rise this year, hampered by elevated their investment objectives. vacancy levels. Las Vegas will be hardest-hit, with vacancy forecast to climb For information on Marcus & Millichap’s again in 2009 after jumping more than 400 basis points over the past 12 Healthcare Real Estate Group, contact: months to approximately 21 percent. Alan Pontius Managing Director ◆ Investment Trends: Transaction volume fell roughly 20 percent in 2008, fol- Tel: (415) 963-3000 lowing record activity in the preceding year. The median price rose more apontius@marcusmillichap.com than 10 percent last year to $300 per square foot, while cap rates remained in the low-7 percent range, as investors continued on their flight to quality assets. Increasing vacancy and falling revenue streams are expected to damp- en activity in 2009, however, with cap rates climbing regionwide. SALES HIGHLIGHTS Property Name City, State Sales Price Square Feet Price/SF Palisade Physical Therapy Palisades Park, NJ $3,000,000 4,812 $623 Valley Medical Day Surgery Renton, WA $3,300,000 7,578 $435 Valley West Medical Los Gatos, CA $4,300,000 11,005 $418 University Medical Center Las Vegas, NV $7,000,000 17,874 $392 Magruder Eye Institute Orlando, FL $12,737,300 34,422 $370 Medical Office Buildings Menomonee Falls, WI $34,000,000 92,264 $369 Mills Breast Cancer Institute Urbana, IL $11,246,000 32,290 $348 Cancer Care Center of Thornton Thornton, CO $6,500,000 18,825 $345 Southwest Kidney Institute Phoenix, AZ $6,058,000 17,979 $337 University Medical Washington, D.C. $23,577,952 82,452 $286 Valley Family Practice Clinic Renton, WA $3,200,000 11,430 $280 Medical Office Buildings Las Vegas, NV $1,920,000 8,000 $240 North Hills Professional Plaza Brea, CA $2,615,000 11,800 $222 Desert Cove Medical Building Scottsdale, AZ $1,575,000 7,269 $217 Fuller-Ashland Medical Building Chicago, IL $1,540,000 7,855 $196 Marietta Park Marietta, GA $15,300,000 81,102 $189 California Cancer & Research Institute Pleasant Hill, CA $11,700,000 62,946 $186 Taylor Station Medical Columbus, OH $2,350,000 12,792 $184 Prepared and edited by Health One Thornton, CO $1,080,000 6,032 $179 Thomas Hershey Senior Analyst Bacon East & West Medical Center Concord, CA $4,700,000 27,613 $170 Research Services Taft Building Pembroke Pines, FL $3,500,000 20,639 $170 For information on national South Beaches Medical Center Jacksonville Beach, FL $1,200,000 7,169 $167 office trends, contact Academy Medical Plaza Philadelphia, PA $1,950,000 14,267 $137 John Chang National Research Manager Regional Definitions: Tel: (602) 952-9669 Midwest: Chicago, Cincinnati, Cleveland, Columbus, Detroit, Indianapolis, Milwaukee, Minneapolis john.chang@marcusmillichap.com Northeast: Boston, New York City, Northern New Jersey, Philadelphia, Washington, D.C. Southeast: Atlanta, Charlotte, Orlando, South Florida, Tampa Mountain/Southwest: Austin, Dallas/Fort Worth, Denver, Houston, Phoenix, Tucson © Marcus & Millichap 2009 West/Pacific Northwest: Las Vegas, Los Angeles, Oakland, Orange County, Portland, Riverside-San www.MarcusMillichap.com Bernardino, Sacramento, San Diego, San Francisco, San Jose, Seattle The information contained in this report was obtained from sources deemed to be reliable. Every effort was made to obtain accurate and complete information; however, no representation, warranty or guarantee, express or implied, may be made as to the accuracy or reliability of the informa- tion contained herein. Sources: Marcus & Millichap Research Services, Bureau of Labor Statistics, CoStar Group, Inc., Economy.com, TWR/Dodge Pipeline, U.S. Census Bureau.