1. Page 1
UNIVERSITY OF MUMBAI
PROJECT ON
TRENDS IN MIGRATION IN INDIA
MASTER OF COMMERCE (BANKING & FINANCE)
SUBJECT: ECONOMICS OF GLOBAL TRADE AND FINANCE
SEMESTER II 2012-2013
In Partial Fulfillment of the Requirement under Semester Based Credit
and Grading System for Post Graduate (PG)
Programme under Faculty of Commerce
SUBMITTED BY
MR. MANOJ THADANI
ROLL NO: 47
PROJECT GUIDE
MS. MRUNALINI RAVALEKAR.
K.P.B. Hinduja College of Commerce, 315 New Charni Road, Mumbai
400004.
2. Page 2
M.COM (BANKING & FINANCE)
SEMESTER II
ECONOMICS OF GLOBAL TRADE AND FINANCE
SUBMITTED BY
MANOJ THADANI
ROLL NO. 47
3. Page 3
CERTIFICATE
This is to certify that Mr. Manoj Thadani of M.com Banking & Finance Semester II [2012-2013]
has successfully completed the Project on “Trends in Migration in India ” under the guidance of
Ms. Mrunalini Ravalekar.
Project Guide ___________________
Course Coordinator ___________________
Internal Examiner ___________________
Principal ____________________
External Examiner ___________________
Date
Place: Mumbai
4. Page 4
DECLARATION
I Manoj Thadani the student of M.com (Banking & Finance) Semester II (2012-2013), hereby
declare that I have completed the project on „Trends in Migration in India‟. The information
submitted is true and original to the best of my knowledge.
Manoj Thadani
(Signature)
5. Page 5
ACKNOWLEDGEMENT
I wish to express my sincere appreciation to Ms. Mrunalini Ravalekar for the encouragement,
patience and special care shown so that I could successfully complete the project. I profusely
thank my computer faculty for allowing me to find the valuable information and their assistance
in the preparation of the project. I also wish to express my sincere appreciation to KPB Hinduja
college which gave me a wonderful opportunity to do such a wonderful project. I am also very
grateful to my parents without which this publication would not have been possible.
6. Page 6
Index
S.NO TOPIC PAGE
NO.
1 Introduction 7
2 Meaning and Characteristic of Migration 7
3 Types of Migration 9
4 Causes of Migration 11
5 Reasons for migration 13
6 Indian NSSO Survey 16
7 Conclusion 33
8 Bibliography 34
7. Page 7
Introduction
Human migration is movement by humans from one area to another, sometimes over long
distances or in large groups. Historically this movement was nomadic, often causing significant
conflict with the indigenous population and their displacement or cultural assimilation. Only a
few nomadic people have retained this form of lifestyle in modern times. Migration has
continued under the form of both voluntary migration within one's region, country, or beyond
and involuntary migration (which includes the slave trade, trafficking in human
beings and ethnic cleansing). People who migrate into a territory are called immigrants, while at
the departure point they are called emigrants. Small populations migrating to develop a territory
considered void of settlement depending on historical setting, circumstances and perspective are
referred to as settlers or colonists, while populations displaced by immigration and colonization
are called refugees.
Meaning and Characteristic of Migration
The United Nation (UN) defined migration as a form of geographical or spatial mobility between
one geographical unit and another. It involves a change in residence from the place of origin or
departure to the place of destination or arrival‟. Further, National Sample Survey Organization
(NSSO) (2008) defined migration as ”A household member whose last Usual Place of Residence
(UPR) any time in the past was different from the present place of enumeration was considered
as a migrant member in a household.” While, population studies defines: “migration implies a
permanent or at least a semi-permanent change in the place of residence of an individual from
one location to another.” Moreover, Census of India (2001) considered “A person is considered
8. Page 8
as a migrant by place of last residence, if the place in which he is enumerated during the census
is other than his place of immediate last residence.” On the basis of above said definitions we can
say that migration is related to long term phenomenon and is different from the mobility of
populations. Thus, the term population mobility is broader than migration, because, in
measurement of mobility, both (i.e., short and long) time period is considered, while migration is
related to only long term mobility of the population/individual. In nutshell, permanent or semi-
permanent change in the place of residence of an individual is a basic characteristic of the
migration.
Introduction to the study of migration
Migration is a universal phenomenon and it is the third component of population change, while
two other important components of population change are fertility and mortality rate. Further,
migration is the most observable and impressive fact in the growth of cities and it is also
considered as an essence of urbanization in the globe. In India, major cities have noticed an
increase of around 75 per cent population due to migration. Moreover, the number of temporary
stay is also larger in India as compared to the World‟s average. Therefore, the study of migration
is important not only for making of the population policy, but also for making and implementing
the urbanization policy of India.
9. Page 9
Types of Migration
Generally, there are two types of migration. First is International Migration and second is
„Internal Migration‟.
International migration implies that when the national boundary of a country is involved in
migration, while, when migration takes place within the national boundary of a country it is
called internal migration. Further, the internal migration is also classified into two types (i.e.,
Migration Streams and Distance Categories). Moreover, in regard to international migration, the
departure of an individual or group from a country is termed as emigration (Out-Migration),
while arrival or entry into a country is known as immigration (or In-Migration). In addition,
migration, can be either Voluntary or Forced. Voluntary migration includes the choice of a
person, while forced migration involves a perception of compulsion against the will or choice of
a concerned individual. Individuals forced to move are usually compelled by political factors
whereas, voluntary migration is usually for economic reasons. For Example: In 1947, a large
number of Muslim were migrated from India to Pakistan, while Hindu came into India in large
numbers from Pakistan is an example of forced migration, while the most important example of
voluntary international migration in the history of mankind is the large-scale exodus of
Europeans during the last one-and-half century. A total of at least 50 to 60 million people are
estimated to have emigrated from Europe
10. Page 10
Types of Internal Migration
Migration Streams Distance Categories
1 Rural to Rural Intra-State
2 Rural to Rural Intra-District
3 Urban to Urban Inter-District
4 Urban to Rural Inter-State
Measurement of Migration
There are two measurements of migration. First is, Gross Migration and second is Net Migration.
Gross Migration:
Gross migration refers to the total number of migrants moving into and moving out of a place,
region or country.
Net Migration:
Net migration is the difference between the number of migrants coming and moving out of a
place, region or country. In other words, net migration is the gain or loss in the total population
of an area as a result of migration.
11. Page 11
Causes of Migration
Causes of migrations have modified over hundreds of years. Some cases are constant, some of
them do not carry the same importance as years ago (for example: in 18th and 19th centuries
labor migration did not have the same character like today).
In general we can divide factors causing migrations into two groups of factors: Push and pull
factors. In general:
Push Factors are economic, political, cultural, and environmentally based.
Pull Factors are economic, political, cultural, and environmentally based.
Barriers/Obstacles which is an example of Nigeria in the 1970s and 1980s.
Push and pull factors are those factors which either forcefully push people into migration or
attract them. A push factor is forceful, and a factor which relates to the country from which a
person migrates. It is generally some problem which results in people wanting to migrate.
Different types of push factors can be seen further below. A push factor is a flaw or distress that
drives a person away from a certain place. A pull factor is something concerning the country to
which a person migrates. It is generally a benefit that attracts people to a certain place. Push and
pull factors are usually considered as north and south poles on a magnet.
Push Factors
Not enough jobs
Few opportunities
“Primitive” conditions
12. Page 12
Desertification
Famine/drought
Political fear/persecution
Poor medical care
Loss of wealth
Natural Disasters
Death threats
Slavery
Pollution
Poor housing
Landlords
Bullying
Poor chances of finding courtship
Pull Factors
Job opportunities
Better living conditions
Political and/or religious freedom
Enjoyment
13. Page 13
Education
Better medical care
Security
Family links
Industry
Better chances of finding courtship
Reasons for migration
Never before have there been so many people living far away from their native countries. Poor
living conditions, violence and armed conflicts, environmental problems, a lack of economic
perspectives and the growing gap between rich and poor countries: all these factors play their
part. Global mobility and the new media likewise have a great influence on current migration
trends.
Since man has been on earth, ethnic groups have again and again travelled to other regions in the
world hoping to find a better basis for existence there. In recent centuries wars have repeatedly
triggered mass displacements of refugees.
In recent decades global migration has reached a hitherto unknown level. Surveys conducted by
international organizations have concluded that currently over 175 million people are living far
away from their native countries. 19,2 million people are considered to be "refugees" or
"displaced persons".
14. Page 14
Poor living conditions
Poor living conditions generate the urge to migrate. The term „migrant‟ denotes a person living
outside his or her native country. Many leave their homes because there are not enough fertile
pastures and arable land, food, water, work or other fundamental requirements. The
consequences of environmental catastrophes, such as drought or floods, can also force thousands
to leave their native countries. Today roughly two thirds of the world‟s population live in
economically poor countries. The growing gap between rich and poor is the most significant
driving force for global migration. In 1960 the income of the richest fifth of the world‟s
population was on average 30 times higher than the poorest fifth. By the year 1990 it was already
60 times higher.
The population grows while economic development stagnates
The enormous rate of population growth and the poor perspectives for economic development in
some regions give rise to a tremendous migratory pressure. Third World and former Soviet
Union countries lack capital and know-how. In some countries, debts absorb a major part of the
economic power. Falling raw material prices as well as the customs barriers and import
restrictions imposed by the industrialized countries prevent the development of viable export
industries. Unstable economic policy, a lack of legal stability and widespread corruption
discourage investors and concerns from locating their long-term industrial projects in such
countries.
15. Page 15
Voilence and the abuse of power force people to flee
The term „refugee‟ is used to describe people who are persecuted on account of their race,
religion, ethnic group or political conviction. Persons whose freedom or lives are threatened in
this sense have a right to protection by foreign countries on the basis of international
conventions.
„Displaced persons‟ are not fleeing from individual persecution but from escalating violence
threatening large parts of the population in a certain region or country. Those affected by such
conflicts mostly flee in large numbers to safe regions in their native land or in a neighbouring
country. In order to prevent unrest, hunger, disease and other problems, they are frequently
accommodated in refugee camps. The reception and care of large influxes of refugees severely
undermine the resources of the states concerned. Refugee camps with tens of thousands of
strangers often arouse feelings of insecurity in the host country‟s population. This can lead to
political instability in the country concerned, provoking new conflicts.
In such situations, nations living at peace and in stable economic conditions are called upon to
show their solidarity and share the burden (e.g. with measures such as the temporary admission
of displaced persons, peace missions, material and reconstruction aid).
The rich industrialized states are becoming more accessible
Tourism, television and the Internet all enhance the attractiveness of migration. They make the
poorest aware of the wealth of the rich. The growth of air travel facilitates journeys to far-away
industrialized countries. So far only a fraction of those willing to consider migration have
actually been able to travel to their preferred destination on other continents. But this could soon
change since successful emigrants transfer a considerable share of their income to their relatives
16. Page 16
at home. As a result, more and more people can afford to travel to distant countries.
Asylum seekers prefer countries where many of their fellow-countrymen already live. In simple
terms this means: Migration begets further migration.
Effects of migration:
Migration has had a significant effect on world geography.
It has contributed to the evolution and development of separate cultures.
It has contributed to the diffusion of cultures by interchange and communication.
It has contributed to the complex mix of people and cultures found in different regions of
the world today
Indian NSSO Survey
The Indian NSSO (National Sample Survey Office) had conducted the 64th
round survey
on ‘Employment & Unemployment and Migration Particulars’during July ‟07 to June ‟08
covering 1,25,578 households and 5,72,254 persons.
Of this sample, ~30% were found to be migrants, i.e. those whose last usual place of residence
(UPR) was different from the present place of enumeration. In this survey, the usual place of
residence of a person was defined as a village/town where the person had stayed continuously for
six months or more. Amongst the migrants, a majority were found to be moving within the state
17. Page 17
(85%) as opposed to those moving across states (15%). Women formed a sizeable majority of
this migrant population.
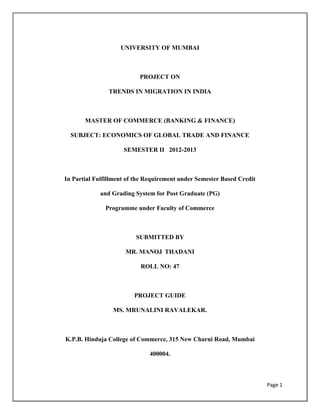
Intra-state migration patterns
The map on the left has the intra-state migration pattern (excluding inter-state numbers) showing
the absolute number of migrants moving within each state/UT. Green indicates higher migration
and red is the opposite. Based on this map, the 5 most populous states in India account for the
top 5 intra-state movements, except for Bihar which comes a close 6th
. If we rescale the numbers
by taking migrants as a percent of the state/UT‟s survey size, as shown in the right map, the
results change completely. The top 5 states with highest percent churn are Andhra Pradesh,
Himachal Pradesh, Kerala, Gujarat and Andaman & Nicobar Islands.
18. Page 18
Inter-state migration patterns
If we now look at the Inter-state migration pattern (excluding within-state movements) by
plotting the Net Inflow of migrants into each state/UT (left-hand-side map), the states with
highest net outflow of migrants are Uttar Pradesh and Bihar, while those with highest net inflow
are Maharashtra and Delhi. If we rescale the numbers, as a percent of the state/UT‟s survey
sample, the story changes, yet again. All the Union Territories in India have the highest Net
percent Inflow, with Chandigarh showing the highest value at 41%.
Inter-state migration Heat-map
19. Page 19
In order to get a sense of exchange of migrants happening between the states, we plotted the
numbers on a heat-map. The y-axis of the heatmap has „From-State‟ while „To-State‟ is on the x-
axis. The height of each heat-map box is proportional to the net outflow from the contributor-
state, while the width of each box is proportional to the net inflow into the recipient-state. The
colour is representative of the number of people moving between the states – darker the box,
more the number of people.
As can be seen, the top destinations for people leaving UP are Delhi, Maharashtra and
Uttaranchal respectively. For Bihar and Rajasthan, the top destinations are highlighted
accordingly. What is more interesting is the pattern of top destinations for each of the states. A
clear trend is the consistent preference of people across regions to migrate into states with
20. Page 20
geographical proximity. The survey had also covered a set of international in-migrants, wherein
Bangladesh the top contributing country has a sizeable proportion of its migrants moving to West
Bengal.
Migration across Rural-Urban areas
21. Page 21
When migration was viewed from the perspective of movement across Rural – Urban areas, a
surprising trend found was the extent movement within Rural Areas – more than half of
migration in India happens amongst the Rural regions. About 40% of migration is towards Urban
areas. A contra-trend noticed here was for the Union Territories and North-Eastern States – over
70% of migration in these areas is towards the Urban regions, unlike the rest of India.
Reasons for migration
When an analysis of Reasons for Migration was done at the Country level, some key trends were
observed. Women, who form a sizeable majority of the migrants primarily migrate on account of
„Marriage‟ and their typical age at marriage is between 15 and 24. For men, the key reason for
migration is „Employment-related‟ and this primarily happens in the age band of 18 to 40.
22. Page 22
Consequently, migration due to „Movement of Parent/Earning member‟ forms another key
reason. „Education‟ is also found to be a driver of migration and this typically happens for men
and women until the age of around 23 years.
When we looked at the Reasons for Migration vis-à-vis States, a few interesting patterns showed
up. People in Tripura migrate mostly due to Forced Reasons/Disasters, whereas UP witnesses
Marriage-related movement. Kerala and West Bengal witness migration because of Housing
related reasons, whereas a lot of people in the scenic state of Himachal Pradesh migrate for post-
retirement life.
It is evident from the above heatmap that a majority of the women who migrate for marriage, end
up doing Domestic duties, while men who move for employment end up as Wage
employees/labourers.
23. Page 23
The survey sample had a good mix of people who had migrated over the years, dating as far back
as the 1930s. When we analysed the pattern of evolution of migration reasons, interesting trends
emerged. Until Independence, migration was subdued and was restricted only to the women
getting married. Post-independence, migration numbers have steadily increased over the next 60
years. After 1970s, increasingly more people started moving for Employment-related reasons.
This was also accompanied with migration of the dependent families. It has been only after the
1990s that people move in significantly larger numbers and for reasons such as Business,
Education, Housing, Post-retirement, Healthcare – more inline with the Indian Economic
Development story over the past 60 years
24. Page 24
Trends of Women Migrations in India
In Table 2, we presented the trends of women‟s migration (women migration per 1000 people) in
India from 1983 to 2008 along with rural and urban areas. It is clear from the data, in 1983 only
351 women (per 1000 persons) were migrated from the rural areas, and, further the ratio has
increased from 398 in 1988, 401 in 1993, 426 in 2000 and finally stood at 477 in 2008, while in
case of urban areas, the ratio of women migration per 1000 population has also increased over
the years, with the exception of 1993. The table also reveals that an average of 410 and 403
women per 1000 persons have migrated from rural and urban areas respectively in India during
the period of 25 years. In case of male migration, only 54, 69, 65, 74 and 72 male per 1000
persons have migrated from rural areas during the same period. In addition, the gap between
male and female migration per 1000 peoples from 1983 to 2008 are illustrated in figure 1. The
total number of migrated persons per 1000 persons has increased from 423 in 1983 to 531
in 2008 from rural areas. Moreover, the Average Compound Growth Rate (ACGR) of migrated
persons per 1000 peoples from rural area has been 0.85 per cent, whiles the ACGR of female and
male has been 1.23 and -1.14 per cent respectively in rural area from 1983 to 2008. In the case of
urban areas, the ACGR of female, male and entire migrated people has been 0.88, -0.17 and 0.47
per cent respectively during the same period.
Migration Streams (Direction of Flow) of Women Internal Migration in India
In the study of migration, migration streams have gained significant attention among researchers,
scholars, policy makers, etc. over the years. So, without a discussion on migration streams,
the study of migration will not be complete. Therefore, first, we have discussed the general
25. Page 25
profile of migration streams in India. The Census of India data shows that 42.49 million people
were migrated from Rural to Rural areas between the periods of 1961 to 1971 and it reached up
to 53.30 million in 2001. Further, 10.98, 5.33 and 9.01 million people were migrated internally
from Rural to Urban, Urban to Rural and Urban to Urban areas respectively between the period
of 1961 to 1971 and it increased to 21.74, 6.58 and 15.16 million people respectively in 2001.
Moreover, the ACGR of internal total migrated people of India has been 0.57, 1.57, 0.38, and
1.16 per cent in Rural to Rural, Rural to Urban, Urban to Rural and Urban to Urban areas
respectively during the similar periods. In addition, we also found that the rate of net
migration was positive in Gujarat (1.70), Haryana (4.10), Karnataka (0.30), Maharashtra (3.00),
Punjab (1.70), and West Bengal (0.40), while it was negative in Andhra Pradesh (-0.30), Assam
(-0.70), Bihar (-2.70), Kerala (-0.60), Madhya Pradesh (-0.04), Orissa (-0.70), Rajasthan (-0.60),
Tamil Nadu (-0.70), and Utter Pradesh (-2.00) between the period of 1991 to 2001. Besides that,
we also noticed the migration rate was positive in developed States, while it was negative in
under developed States.
Major Observations of the Study
1. The Average Compound Growth Rate (ACGR) of migrated persons per 1000 people from
rural area was 0.85 percent; whiles the ACGR of female and male was 1.23 and -1.14 per cent
respectively in rural area from 1983 to 2008. In the case of urban areas, the ACGR of female,
male and entire migrated people was 0.88, -0.17 and 0.47 per cent respectively during the same
period. Thus, we can say that the rate of women migration is much more than the male in India.
26. Page 26
2. The ACGR of total internally migrated people of India was 0.57, 1.57, 0.38, and 1.16 per cent
in Rural to Rural, Rural to Urban, Urban to Rural and Urban to Urban areas respectively from
the period between 1961 to 2001. Thus, we conclude that Urban to Rural stream is major
contributor in migration of people in India.
3. The study clearly indicates that a large number of women has been out from the rural area
through the stream of Rural to Urban (positive trend), Urban to Rural (negative trend), and Rural
to Rural (negative trend).
4. The ACGR of rural women migrations in STs was found very high (2.65 per cent), while
minimum was 1.12 per cent in OBCs from 1999/2000 to 2007/08 in India.
5. The contribution of marriage in women migration is very high in both areas (i.e., rural and
urban areas) and increased continually over the period under study. While, the contribution of
studies, movement of parents or earning members and others, decreased in rural as well as urban
areas over the period under consideration.
Suggestions for the Healthy Migration
1. Both, Central and State governments, should create the basic facilities in rural areas through
infrastructure development in general and sanitation facilities in particular, as for women the
situation becomes complex in its absence and that is why a newly married woman in Utter
Pradesh recently committed suicide due to non-availability of latrine at home, another woman
broke the marriage due to the same reason in Haryana.
27. Page 27
2. The Central and States governments should create more livelihood opportunities for the rural
people within rural areas, through honest implementation of the existing schemes for the purpose
and remaining through adding more such schemes.
3. Both governments should immediately take measures to bring the sex-ratio to a rational level
by promoting the required programs and crush the forces supporting the feticide in their petty
interest, thereby causing heavy loss and imbalance in the demography of the nation in general
and in rural areas in particular.
4. It is suggested that the eligibility conditions for availing benefits of various schemes meant for
women upliftment should be eased wherever necessary, to ensure the maximum involvement of
the half population and ensuring their development.
Abstract
On the basis of the foregoing discussion we conclude that the stream of women migration is not
favorable for the social structure in general and rural area in particular. Because, in long term, a
vacuum of female population in rural will emerge due to the following basic reasons.
(1) Mortality rate of girl is higher in rural area as compared to urban areas.
(2) No. of involuntary unmarried person in rural areas has been increasing continuously in rural
area due to unavailability of girls.
(3) The rate of women migration from rural to rural and urban to rural areas has decreased,
while rural to urban has been increasing significantly over the period under study and
28. Page 28
(4) The poor girls are migrated through „marriage on sales basis‟ from poor States to rich States,
who are not even well acquainted with the language and culture of the migrated areas/States and
hence, they are punished for the crime not committed by them or paying the price for being
poor; where there‟s no talk about the women empowerment since they are used as goods in the
areas where the sex-ratio is adverse. Therefore, both levels of government, should concentrate on
rural development through poverty alleviation and women empowerment schemes to surge the
sex ratio to save the social structure, rural culture and an optimum development of urban areas of
the country.
Description of Migration Trends
The migration statistics up to the early 1990s (from Census) shows a near stagnancy. Estimates
from NSS also show a marginal decline in population mobility between 1987-88 & 1993 for
overall population. This decline is attributed to the process of economic liberalization which
implies the greater movement of capital and natural resources and growing immobility of
population as stated by some authors Nonetheless, a steady increase in internal migration has
been witnessed in the post reform era from 24.8 percent in 1993 to 28.5 percent in 2007/08
Migration Rate
Migration Rate by Sex (NSS,1983-08)
Male Female Total
29. Page 29
Like wise, one can also expect an increase in migration on the basis of population figures from
2011 census. As compared to the projected population, the provisional population totals of
Census 2011 shows an increase in population by 1.48 percent and it is expected this could be due
to increasing migration.
Although overall migration trend is increasing, a significant discripenancy in migration pattern is
noticed across gender. There occurs a continuous increase in female migration since 1983 where
as a decline in male migration trend except between 1993 & 1999/00 is noticed and it is more
pronounced in rural area. From Table-1 it is seen that male migration is declining in rural area
from 7.2 percent in 1983 to 5.42 percent with marginal increase in the period 1987 and 1999/00.
Like rural the decline in urban male migration is noticed up to early 1990‟s, however it has
marginally gone up between 1999/00 & 2007/08. Hence, there is a need for further investigation
as to why the male migration rate remains stagnant while female migration rate has substantially
shut up over the period. It has been also noticed that compared to urban, male migration is quite
low in rural area where as there is no such significant discrepancy noticed among females. The
vast difference in the trend of male migration between rural and urban areas has led to several
conflicting arguments.
One possibility for decline in male migration could be due to employment generated through
National Rural Employment Guarantee Act (NREGA) in village level itself reduce rural to rural
flow which in turn influence overall rural male migration. On the other hand studies shows that
there occurs fall in rural employment in spite of implementation of NREGA. Therefore, another
reason for deceleration in male migration can be explained in terms of the jobless growth of
Indian economy. Further, a question arises why migration scenario is different in two periods of
jobless growth that is 1993-00 (growth rate of employment is less than 1percent) and 2000-08
30. Page 30
(growth rate of employment is 0.17percent). It is not plausible that jobless growth could be the
exclusive reason rather it may partly explain the phenomenon. The other possible explanation
could be under estimation of seasonal migration that may influence the overall growth of male
migration. Studies shows that there is under reporting of internal migration data due to seasonal
and circulatory migrants who are concentrated at the lower ends of the labour market spectrum
and such type of mobility steadily increases over years.
Given these possibilities, it is difficult to answer the exact possible reason for declining male
mobility in present scenario. Unlike male migration a continuous increase infemale migration
observed irrespective of place of residence. Although preponderance of female in migration
process is largely attributed to marriage, the emerging studies by show that the pattern of female
migration changing from marriage to other reasons especially economic ones.
Therefore, to explore the reasons for current trends in migration, it is crucial to have a look at the
other dimensions of migration followed by distance wise migration.
Migration by Distance (Type)
Overwhelming evidence shows that there is dominance of short distance migration. However, it
appears this trend is also slowly changing in the country at least among urban migrants. Table-2
shows that for 2007/08 in urban area male migration is higher in inter-district (39.31 percent)
followed by inter-state (31.9 percent). Likewise, for female inter-district (42.51 percent)
followed by intra-district migration (38.32 percent) dominate the migration flow. The table
brings a number of changes in the patterns of migration over period. A decrease in intra-state
mobility accompanied by an increase in inter-district and inter-state move irrespective of sex is
31. Page 31
observed. And the increase is found to be high in inter-state male migration in urban areas from
23.57 percent in 1999/00 to 31.9 percent in 2007/08.
The relative increase in inter-state migration is an indication that migration trend is moving
towards economic reasons. Motivated by better employment opportunities as well as to pursue
higher education people migrate to urban centres of developed states. At the same time a
growing volume of micro studies shows abide by poverty, inequality and environmental
vulnerabilities people from lower socio-economic strata of under developed states migrated to
developed states in pursuit of getting employment. It is preliminary, however to say about the
causes (push/pull) of increasing volume of interstate mobility rather a more detailed analysis is
required to understand the type of people involved in interstate migration.
The other way of examining the trends in migration is stream wise as it throws some light on the
changing aspects of these types of migration.
The data presented in Fig-3 shows that around half of the migration flow is rural to rural in
2007/08.
Around 1/4th of migrants constitute rural to urban followed by urban-urban and urban to rural.
However, there occurs a wide gender difference in migration flow. For female rural to rural flow
constitute the dominating category where as for male it is rural to urban. It is seen that for female
rural to rural constitute 60 percent of migration flow which is less than 30 percent for male. On
the contrary 34 percent of male migrated from rural to urban which is less than 20 percent for
female.
32. Page 32
A comparison of data over the period shows that though rural to rural flow overwhelming the
other streams of migration, the proportion has decline for both sexes. Perhaps creation of
employment in villages through NREGA reduces rural to rural flow by mitigating
distress/seasonal migration. The emerging migration patterns indicate that rural to urban flow
shows an upward trend for both sexes, though the increase is insignificant for female. Urban to
urban flow also shows a marginal increase between two periods.
It is expected that with generation of employment opportunities in urban areas, migration from
rural areas continuously increases. The latest NSS estimates shows that more than half
(56percent) migration in the rural to urban flow is due to employment and there occurs an
increase in salaried/wage earning class over the period from 28 percent in 1999/00 to 32 percent
in 2007/08 which is declining in other types of employment. In this regard studies by shows that
the increasing rural to urban migration in recent years is largely endorsed to economic reasons
as they mostly motivated by availability of urban employment in the expanding informal sector.
Some development analysts hold that the structural reform adopted in the country since the early
1990s – the basic factor in India‟s rapid acceleration of economic growth to over 8 per cent per
annum in real terms for over half a decade – has opened up job opportunities in several globally
linked sectors located in and around the cities, boosting rural–urban migration.
33. Page 33
Conclusion
The study suggests that the stream of women migration is not favorable for the social structure in
general and rural area in particular for India. So, the Indian policy makers should concentrate on
rural development to surge the sex ratio in general and rural areas in particular to save the social
structure, rural culture and as well as an optimum development of urban areas of the country.