Economic Presentation
•Als PPTX, PDF herunterladen•
1 gefällt mir•509 views

The document contains several tables summarizing economic data from 2000-2009 including: 1) Details on the duration of past recessions and unemployment rates one year later 2) Per capita income figures for the overall US population and for white individuals only in current and inflation-adjusted dollars 3) Median income by sex with figures declining for males from 2008-2009 but increasing slightly for females 4) Median income and educational attainment showing higher earnings corresponding to higher levels of education

Empfohlen
Weitere ähnliche Inhalte
Ähnlich wie Economic Presentation
Mehr von Metropolitan Community College-Kansas City
Mehr von Metropolitan Community College-Kansas City (20)
Kürzlich hochgeladen
Kürzlich hochgeladen (20)
Economic Presentation
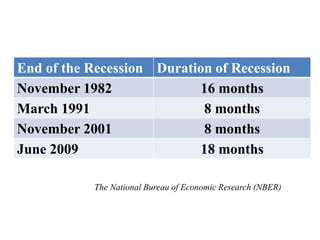
- 1. End of the Recession Duration of Recession November 1982 16 months March 1991 8 months November 2001 8 months June 2009 18 months The National Bureau of Economic Research (NBER)
- 2. End of the Recession Unemployment Rate One Year Later November 1982 10.8% 8.5% March 1991 6.8% 7.4% November 2001 5.5% 5.9% June 2009 9.5% 9.5% Bureau of Labor Statistics (BLS)
- 3. Per Capita Money Income, 2000-2009 Per capita income Year Current dollars 2009 dollars 2009 26,530 26,530 2008 26,964 26,862 2007 26,804 27,728 2006 26,352 28,034 2005 25,036 27,507 2004 23,857 27,091 2003 23,276 27,145 2002 22,794 27,177 2001 22,851 27,685 2000 22,346 27,833 Census Bureau
- 4. Per Capita Money Income, White: 2000-2009 Year Per capita income Current dollars 2009 dollars White Alone 2009 28,034 28,034 2008 28,502 28,394 2007 28,325 29,302 2006 27,821 29,597 2005 26,496 29,111 2004 25,223 28,642 2003 24,626 28,720 2002 24,142 28,784 2001 24,127 29,231 2000 23,582 29,373 Census Bureau
- 5. Median Income by Sex: 2000-2009 Male Female Year 2009 dollars 2009 dollars 2009 32,184 -2.58% 20,957 0.81% 2008 33,035 -3.80% 20,788 -3.95% 2007 34,341 0.05% 21,643 1.65% 2006 34,324 -0.11% 21,291 4.32% 2005 34,362 -0.84% 20,410 1.73% 2004 34,652 -0.73% 20,062 -0.33% 2003 34,907 0.13% 20,128 0.42% 2002 34,860 -1.13% 20,045 -0.42% 2001 35,257 -0.13% 20,129 0.61% 2000 35,303 0.48% 20,007 1.56% Census Bureau
- 6. Educational Attainment--People 25 Years Old and Over by Median Income and Sex Male Female Educational attainment 2009 dollars 2009 dollars All 36,801 23,159 Less than 9th grade 16,473 10,516 9th to 12th grade 19,720 12,278 High School Graduate 30,303 18,340 Some College, No Degree 36,693 23,107 Associate Degree 42,163 27,027 Bachelor's Degree 54,091 35,972 Master's Degree 69,825 50,576 Professional Degree 102,398 60,259 Doctorate Degree 89,845 65,587 Census Bureau