SlideShare ist ein Scribd-Unternehmen logo
1 von 2
Downloaden Sie, um offline zu lesen
Decade 2000's Comparison GIC to Growth Investing
The following is an analysis comparing GIC returns over the last decade to stock market returns:
Date 5Yr Value Cumul TSX Value Cum Blend Value Cumul
GIC Rtn Return Rtn 50%TSX-50%DJIA Rtn
Jan 1/00 5% 1,000,000.00$ 10% 1,000,000.00$ 4% 1,000,000.00$
Jan 1/01 5% 1,050,000.00$ 5% -18% 1,100,000.00$ 10% -9% 1,037,259.06$ 4%
Jan 1/02 5% 1,102,500.00$ 10% -14% 902,000.00$ -10% -16% 940,351.97$ -6%
Jan 1/03 5% 1,157,625.00$ 16% 30% 775,720.00$ -22% 16% 788,931.41$ -21%
Jan 1/04 5% 1,215,506.25$ 22% 8% 1,008,436.00$ 1% 2% 916,740.10$ -8%
Jan 1/05 4% 1,276,281.56$ 28% 30% 1,089,110.88$ 9% 13% 935,539.67$ -6%
Jan 1/06 4% 1,327,332.83$ 33% 9% 1,415,844.14$ 42% 13% 1,053,301.78$ 5%
Jan 1/07 4% 1,380,426.14$ 38% 1% 1,543,270.12$ 54% -4% 1,189,082.67$ 19%
Jan 1/08 4% 1,435,643.18$ 44% -34% 1,558,702.82$ 56% -27% 1,137,539.93$ 14%
Jan 1/09 4% 1,493,068.91$ 49% 35% 1,028,743.86$ 3% 19% 833,212.77$ -17%
Jan 1/10 1,552,791.67$ 55% 1,388,804.21$ 39% After Fees: 987,380.53$ -1%
Variance Over 10 Yrs. To GIC: 163,987.46-$ 363,987.46-$ 565,411.14-$
-11% -23% -36%
DJIA Value FX Adj Cumul Rtn/Yr Gold Value Cumul
US$ CD/US FX (CDN$) Rtn w/Foreign Exch CDN Rtn
-6% 692,856.65$ 1.4433 1,000,000.00$ -6% 1,000,000.00$
-7% 651,285.25$ 1.4963 974,518.12$ -3% -3% 13% 940,000.00$ -6%
-17% 605,695.28$ 1.5979 967,840.49$ -3% -1% 20% 1,062,200.00$ 6%
25% 502,727.09$ 1.5747 791,644.34$ -21% -18% 2% 1,274,640.00$ 27%
3% 628,408.86$ 1.2900 810,647.42$ -19% 2% -2% 1,300,132.80$ 30%
-1% 647,261.12$ 1.2036 779,043.49$ -22% -4% 7% 1,274,130.14$ 27%
16% 640,788.51$ 1.1571 741,456.39$ -26% -5% 24% 1,363,319.25$ 36%
6% 743,314.67$ 1.1649 865,887.26$ -13% 17% 24% 1,690,515.88$ 69%
-34% 787,913.55$ 0.9927 782,161.78$ -22% -10% 18% 2,096,239.69$ 110%
19% 520,022.95$ 1.2107 629,591.78$ -37% -20% 10% 2,473,562.83$ 147%
618,827.30$ 1.0378 642,218.98$ -36% 2% 2,720,919.11$ 172%
Variance Over 10 Yrs. To GIC: 910,572.69-$ 1,110,572.69-$ After 1,168,127.44$
-59% -72% Fees 75%
Notes: Fees on $1 million/yr. is about 2% or $20,000 per year (exluded in analysis) - TOTAL FEES are $200,000.00; taxes not accounted for
Summary: 1/1/00 to 1/ 1/10; Start $1 mill GIC TSX DJIA Blended Gold
Note: Value: 1,552,791.67$ 1,388,804.21$ 642,218.98$ 987,380.53$ 2,720,919.11$
Excl. Fees Amount < or > GIC: 163,987.46-$ 910,572.69-$ 565,411.14-$ 1,168,127.44$
% Differnce GIC: -11% -59% -36% 75%
Summary Points: 1. Gold outperformed all securities by a wide margin
2. Worst persorming asset class was the US stock market, especially after considering foreign exchange and fees
3. Canadian stock market still underperformed GIC's by over 10% or potentially over 20% with fees

Weitere ähnliche Inhalte

Was ist angesagt?

agilent Operating_Results_Q107_to_Q408
agilent Operating_Results_Q107_to_Q408agilent Operating_Results_Q107_to_Q408
agilent Operating_Results_Q107_to_Q408finance38
 
Operating_Results_Q106_to_Q208
Operating_Results_Q106_to_Q208Operating_Results_Q106_to_Q208
Operating_Results_Q106_to_Q208finance38
 
Boston 3rdQ 2019 Real Estate Sales Summary: Boston Proper neighborhoods
Boston 3rdQ 2019 Real Estate Sales Summary: Boston Proper neighborhoodsBoston 3rdQ 2019 Real Estate Sales Summary: Boston Proper neighborhoods
Boston 3rdQ 2019 Real Estate Sales Summary: Boston Proper neighborhoodsFRANKLIN KNOTTS
 
agilent Operating_Results_Q106_to_Q108
agilent Operating_Results_Q106_to_Q108agilent Operating_Results_Q106_to_Q108
agilent Operating_Results_Q106_to_Q108finance38
 
agilent Operating_Results_Q106_to_Q207
agilent Operating_Results_Q106_to_Q207agilent Operating_Results_Q106_to_Q207
agilent Operating_Results_Q106_to_Q207finance38
 
December 2015 The Woodlands Texas market report
December 2015 The Woodlands Texas market reportDecember 2015 The Woodlands Texas market report
December 2015 The Woodlands Texas market reportDebra Wymore
 
Life hack: How to buy a used car for those who serve!
Life hack: How to buy a used car for those who serve!Life hack: How to buy a used car for those who serve!
Life hack: How to buy a used car for those who serve!Michael Ray
 
Investment Anemalou Bali
Investment Anemalou BaliInvestment Anemalou Bali
Investment Anemalou Balianemalou
 
agilent OperatingResultsQ107toQ308
agilent OperatingResultsQ107toQ308agilent OperatingResultsQ107toQ308
agilent OperatingResultsQ107toQ308finance38
 
Fraser Valley Real Estate Board Statistics Package October 2021
Fraser Valley Real Estate Board Statistics Package October 2021Fraser Valley Real Estate Board Statistics Package October 2021
Fraser Valley Real Estate Board Statistics Package October 2021VickyAulakh1
 
Life hack: How to buy a used car - by hour
Life hack: How to buy a used car - by hourLife hack: How to buy a used car - by hour
Life hack: How to buy a used car - by hourMichael Ray
 
FVREB September 2021 Statistics Package
FVREB September 2021 Statistics PackageFVREB September 2021 Statistics Package
FVREB September 2021 Statistics PackageVickyAulakh1
 
Fraser Valley Real Estate Board July 2021 Statistics
Fraser Valley Real Estate Board July 2021 Statistics Fraser Valley Real Estate Board July 2021 Statistics
Fraser Valley Real Estate Board July 2021 Statistics Vicky Aulakh
 
agilent Operating_Results_Q106_to_Q307
agilent Operating_Results_Q106_to_Q307agilent Operating_Results_Q106_to_Q307
agilent Operating_Results_Q106_to_Q307finance38
 
Fraser Valley Real Estate Board August 2021 Statistics
Fraser Valley Real Estate Board August 2021 Statistics Fraser Valley Real Estate Board August 2021 Statistics
Fraser Valley Real Estate Board August 2021 Statistics Vicky Aulakh
 
Okanagan Real Estate Statistics Package - September 2021
Okanagan Real Estate Statistics Package - September 2021Okanagan Real Estate Statistics Package - September 2021
Okanagan Real Estate Statistics Package - September 2021VickyAulakh1
 
Fraser Valley Stats Package 2019
Fraser Valley Stats Package 2019 Fraser Valley Stats Package 2019
Fraser Valley Stats Package 2019 Vicky Aulakh
 
Fraser Valley Real Estate Board November 2020 statistics package
Fraser Valley Real Estate Board November 2020 statistics packageFraser Valley Real Estate Board November 2020 statistics package
Fraser Valley Real Estate Board November 2020 statistics packageVicky Aulakh
 

Was ist angesagt? (20)

agilent Operating_Results_Q107_to_Q408
agilent Operating_Results_Q107_to_Q408agilent Operating_Results_Q107_to_Q408
agilent Operating_Results_Q107_to_Q408
 
Operating_Results_Q106_to_Q208
Operating_Results_Q106_to_Q208Operating_Results_Q106_to_Q208
Operating_Results_Q106_to_Q208
 
Boston 3rdQ 2019 Real Estate Sales Summary: Boston Proper neighborhoods
Boston 3rdQ 2019 Real Estate Sales Summary: Boston Proper neighborhoodsBoston 3rdQ 2019 Real Estate Sales Summary: Boston Proper neighborhoods
Boston 3rdQ 2019 Real Estate Sales Summary: Boston Proper neighborhoods
 
agilent Operating_Results_Q106_to_Q108
agilent Operating_Results_Q106_to_Q108agilent Operating_Results_Q106_to_Q108
agilent Operating_Results_Q106_to_Q108
 
agilent Operating_Results_Q106_to_Q207
agilent Operating_Results_Q106_to_Q207agilent Operating_Results_Q106_to_Q207
agilent Operating_Results_Q106_to_Q207
 
December 2015 The Woodlands Texas market report
December 2015 The Woodlands Texas market reportDecember 2015 The Woodlands Texas market report
December 2015 The Woodlands Texas market report
 
Life hack: How to buy a used car for those who serve!
Life hack: How to buy a used car for those who serve!Life hack: How to buy a used car for those who serve!
Life hack: How to buy a used car for those who serve!
 
Investment Anemalou Bali
Investment Anemalou BaliInvestment Anemalou Bali
Investment Anemalou Bali
 
agilent OperatingResultsQ107toQ308
agilent OperatingResultsQ107toQ308agilent OperatingResultsQ107toQ308
agilent OperatingResultsQ107toQ308
 
Fraser Valley Real Estate Board Statistics Package October 2021
Fraser Valley Real Estate Board Statistics Package October 2021Fraser Valley Real Estate Board Statistics Package October 2021
Fraser Valley Real Estate Board Statistics Package October 2021
 
Life hack: How to buy a used car - by hour
Life hack: How to buy a used car - by hourLife hack: How to buy a used car - by hour
Life hack: How to buy a used car - by hour
 
FVREB September 2021 Statistics Package
FVREB September 2021 Statistics PackageFVREB September 2021 Statistics Package
FVREB September 2021 Statistics Package
 
Fraser Valley Real Estate Board July 2021 Statistics
Fraser Valley Real Estate Board July 2021 Statistics Fraser Valley Real Estate Board July 2021 Statistics
Fraser Valley Real Estate Board July 2021 Statistics
 
agilent Operating_Results_Q106_to_Q307
agilent Operating_Results_Q106_to_Q307agilent Operating_Results_Q106_to_Q307
agilent Operating_Results_Q106_to_Q307
 
Fraser Valley Real Estate Board August 2021 Statistics
Fraser Valley Real Estate Board August 2021 Statistics Fraser Valley Real Estate Board August 2021 Statistics
Fraser Valley Real Estate Board August 2021 Statistics
 
Okanagan Real Estate Statistics Package - September 2021
Okanagan Real Estate Statistics Package - September 2021Okanagan Real Estate Statistics Package - September 2021
Okanagan Real Estate Statistics Package - September 2021
 
Fraser Valley Stats Package 2019
Fraser Valley Stats Package 2019 Fraser Valley Stats Package 2019
Fraser Valley Stats Package 2019
 
55 years of palm oil shows us...
55 years of palm oil shows us...55 years of palm oil shows us...
55 years of palm oil shows us...
 
Fraser Valley Real Estate Board November 2020 statistics package
Fraser Valley Real Estate Board November 2020 statistics packageFraser Valley Real Estate Board November 2020 statistics package
Fraser Valley Real Estate Board November 2020 statistics package
 
Anexo 2
Anexo 2Anexo 2
Anexo 2
 

Ähnlich wie Decade 2000 Return Comparison

The 3 Basics - What a Company Needs
The 3 Basics - What a Company NeedsThe 3 Basics - What a Company Needs
The 3 Basics - What a Company NeedsBill Sims
 
Financial Forecasting
Financial ForecastingFinancial Forecasting
Financial ForecastingJamariHodges1
 
Market Watch TORONTO 2015 OCTOBER
Market Watch TORONTO 2015 OCTOBERMarket Watch TORONTO 2015 OCTOBER
Market Watch TORONTO 2015 OCTOBERChaba Tamasi
 
TREB Market Watch for May 2016
TREB Market Watch for May 2016TREB Market Watch for May 2016
TREB Market Watch for May 2016Michelle Makos
 
Market Watch May 2016
Market Watch May 2016Market Watch May 2016
Market Watch May 2016Chaba Tamasi
 
Digital everywhere 2% growth with debt
Digital everywhere 2% growth with debtDigital everywhere 2% growth with debt
Digital everywhere 2% growth with debtBea Morales
 
10.3 2016 investor presentation pea
10.3 2016 investor presentation   pea10.3 2016 investor presentation   pea
10.3 2016 investor presentation peaFalcoCorporate
 
Market watch jul 2019 frank yu oakville
Market watch jul 2019 frank yu oakvilleMarket watch jul 2019 frank yu oakville
Market watch jul 2019 frank yu oakvilleFrank Yu
 
Market watch jul 2019 frank yu oakville
Market watch jul 2019 frank yu oakvilleMarket watch jul 2019 frank yu oakville
Market watch jul 2019 frank yu oakvilleFrank Yu
 
TORONTO REAL ESTATE BOARD'S -- MARKET WATCH - JULY 2019
TORONTO REAL ESTATE BOARD'S -- MARKET WATCH - JULY 2019TORONTO REAL ESTATE BOARD'S -- MARKET WATCH - JULY 2019
TORONTO REAL ESTATE BOARD'S -- MARKET WATCH - JULY 2019Shawn Venasse
 
Market Report for August 2017 - Residential Resale
Market Report for August 2017 - Residential ResaleMarket Report for August 2017 - Residential Resale
Market Report for August 2017 - Residential ResaleMichelle Makos
 
Amazon Fresh - Mock Financials
Amazon Fresh - Mock FinancialsAmazon Fresh - Mock Financials
Amazon Fresh - Mock FinancialsHelena Lavieri
 
TREB January 2017 Market Watch
TREB January 2017 Market WatchTREB January 2017 Market Watch
TREB January 2017 Market WatchMichelle Makos
 
Toronto Real Estate Board's MARKET WATCH - JANUARY 2017
Toronto Real Estate Board's MARKET WATCH - JANUARY 2017Toronto Real Estate Board's MARKET WATCH - JANUARY 2017
Toronto Real Estate Board's MARKET WATCH - JANUARY 2017Shawn Venasse
 
Toronto Real Estate Board's MARKET WATCH - JANUARY 2017
Toronto Real Estate Board's MARKET WATCH - JANUARY 2017Toronto Real Estate Board's MARKET WATCH - JANUARY 2017
Toronto Real Estate Board's MARKET WATCH - JANUARY 2017Shawn Venasse
 
Boston Real Estate Report
Boston Real Estate ReportBoston Real Estate Report
Boston Real Estate ReportJoshua Stiles
 
Big Buns Ballston (est. 2007)
Big Buns Ballston (est. 2007)Big Buns Ballston (est. 2007)
Big Buns Ballston (est. 2007)CraigCarey9
 

Ähnlich wie Decade 2000 Return Comparison (20)

The 3 Basics - What a Company Needs
The 3 Basics - What a Company NeedsThe 3 Basics - What a Company Needs
The 3 Basics - What a Company Needs
 
Financial Forecasting
Financial ForecastingFinancial Forecasting
Financial Forecasting
 
CNR_DCF(USD)
CNR_DCF(USD)CNR_DCF(USD)
CNR_DCF(USD)
 
Market Watch TORONTO 2015 OCTOBER
Market Watch TORONTO 2015 OCTOBERMarket Watch TORONTO 2015 OCTOBER
Market Watch TORONTO 2015 OCTOBER
 
TREB Market Watch for May 2016
TREB Market Watch for May 2016TREB Market Watch for May 2016
TREB Market Watch for May 2016
 
Market Watch May 2016
Market Watch May 2016Market Watch May 2016
Market Watch May 2016
 
Teacher Concessions
Teacher ConcessionsTeacher Concessions
Teacher Concessions
 
Digital everywhere 2% growth with debt
Digital everywhere 2% growth with debtDigital everywhere 2% growth with debt
Digital everywhere 2% growth with debt
 
10.3 2016 investor presentation pea
10.3 2016 investor presentation   pea10.3 2016 investor presentation   pea
10.3 2016 investor presentation pea
 
Market watch jul 2019 frank yu oakville
Market watch jul 2019 frank yu oakvilleMarket watch jul 2019 frank yu oakville
Market watch jul 2019 frank yu oakville
 
Market watch jul 2019 frank yu oakville
Market watch jul 2019 frank yu oakvilleMarket watch jul 2019 frank yu oakville
Market watch jul 2019 frank yu oakville
 
TORONTO REAL ESTATE BOARD'S -- MARKET WATCH - JULY 2019
TORONTO REAL ESTATE BOARD'S -- MARKET WATCH - JULY 2019TORONTO REAL ESTATE BOARD'S -- MARKET WATCH - JULY 2019
TORONTO REAL ESTATE BOARD'S -- MARKET WATCH - JULY 2019
 
Market Report for August 2017 - Residential Resale
Market Report for August 2017 - Residential ResaleMarket Report for August 2017 - Residential Resale
Market Report for August 2017 - Residential Resale
 
Amazon Fresh - Mock Financials
Amazon Fresh - Mock FinancialsAmazon Fresh - Mock Financials
Amazon Fresh - Mock Financials
 
AZN/ALXN
AZN/ALXNAZN/ALXN
AZN/ALXN
 
TREB January 2017 Market Watch
TREB January 2017 Market WatchTREB January 2017 Market Watch
TREB January 2017 Market Watch
 
Toronto Real Estate Board's MARKET WATCH - JANUARY 2017
Toronto Real Estate Board's MARKET WATCH - JANUARY 2017Toronto Real Estate Board's MARKET WATCH - JANUARY 2017
Toronto Real Estate Board's MARKET WATCH - JANUARY 2017
 
Toronto Real Estate Board's MARKET WATCH - JANUARY 2017
Toronto Real Estate Board's MARKET WATCH - JANUARY 2017Toronto Real Estate Board's MARKET WATCH - JANUARY 2017
Toronto Real Estate Board's MARKET WATCH - JANUARY 2017
 
Boston Real Estate Report
Boston Real Estate ReportBoston Real Estate Report
Boston Real Estate Report
 
Big Buns Ballston (est. 2007)
Big Buns Ballston (est. 2007)Big Buns Ballston (est. 2007)
Big Buns Ballston (est. 2007)
 

Decade 2000 Return Comparison

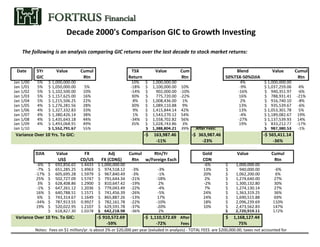
  • 1. Decade 2000's Comparison GIC to Growth Investing The following is an analysis comparing GIC returns over the last decade to stock market returns: Date 5Yr Value Cumul TSX Value Cum Blend Value Cumul GIC Rtn Return Rtn 50%TSX-50%DJIA Rtn Jan 1/00 5% 1,000,000.00$ 10% 1,000,000.00$ 4% 1,000,000.00$ Jan 1/01 5% 1,050,000.00$ 5% -18% 1,100,000.00$ 10% -9% 1,037,259.06$ 4% Jan 1/02 5% 1,102,500.00$ 10% -14% 902,000.00$ -10% -16% 940,351.97$ -6% Jan 1/03 5% 1,157,625.00$ 16% 30% 775,720.00$ -22% 16% 788,931.41$ -21% Jan 1/04 5% 1,215,506.25$ 22% 8% 1,008,436.00$ 1% 2% 916,740.10$ -8% Jan 1/05 4% 1,276,281.56$ 28% 30% 1,089,110.88$ 9% 13% 935,539.67$ -6% Jan 1/06 4% 1,327,332.83$ 33% 9% 1,415,844.14$ 42% 13% 1,053,301.78$ 5% Jan 1/07 4% 1,380,426.14$ 38% 1% 1,543,270.12$ 54% -4% 1,189,082.67$ 19% Jan 1/08 4% 1,435,643.18$ 44% -34% 1,558,702.82$ 56% -27% 1,137,539.93$ 14% Jan 1/09 4% 1,493,068.91$ 49% 35% 1,028,743.86$ 3% 19% 833,212.77$ -17% Jan 1/10 1,552,791.67$ 55% 1,388,804.21$ 39% After Fees: 987,380.53$ -1% Variance Over 10 Yrs. To GIC: 163,987.46-$ 363,987.46-$ 565,411.14-$ -11% -23% -36% DJIA Value FX Adj Cumul Rtn/Yr Gold Value Cumul US$ CD/US FX (CDN$) Rtn w/Foreign Exch CDN Rtn -6% 692,856.65$ 1.4433 1,000,000.00$ -6% 1,000,000.00$ -7% 651,285.25$ 1.4963 974,518.12$ -3% -3% 13% 940,000.00$ -6% -17% 605,695.28$ 1.5979 967,840.49$ -3% -1% 20% 1,062,200.00$ 6% 25% 502,727.09$ 1.5747 791,644.34$ -21% -18% 2% 1,274,640.00$ 27% 3% 628,408.86$ 1.2900 810,647.42$ -19% 2% -2% 1,300,132.80$ 30% -1% 647,261.12$ 1.2036 779,043.49$ -22% -4% 7% 1,274,130.14$ 27% 16% 640,788.51$ 1.1571 741,456.39$ -26% -5% 24% 1,363,319.25$ 36% 6% 743,314.67$ 1.1649 865,887.26$ -13% 17% 24% 1,690,515.88$ 69% -34% 787,913.55$ 0.9927 782,161.78$ -22% -10% 18% 2,096,239.69$ 110% 19% 520,022.95$ 1.2107 629,591.78$ -37% -20% 10% 2,473,562.83$ 147% 618,827.30$ 1.0378 642,218.98$ -36% 2% 2,720,919.11$ 172% Variance Over 10 Yrs. To GIC: 910,572.69-$ 1,110,572.69-$ After 1,168,127.44$ -59% -72% Fees 75% Notes: Fees on $1 million/yr. is about 2% or $20,000 per year (exluded in analysis) - TOTAL FEES are $200,000.00; taxes not accounted for
  • 2. Summary: 1/1/00 to 1/ 1/10; Start $1 mill GIC TSX DJIA Blended Gold Note: Value: 1,552,791.67$ 1,388,804.21$ 642,218.98$ 987,380.53$ 2,720,919.11$ Excl. Fees Amount < or > GIC: 163,987.46-$ 910,572.69-$ 565,411.14-$ 1,168,127.44$ % Differnce GIC: -11% -59% -36% 75% Summary Points: 1. Gold outperformed all securities by a wide margin 2. Worst persorming asset class was the US stock market, especially after considering foreign exchange and fees 3. Canadian stock market still underperformed GIC's by over 10% or potentially over 20% with fees