Weitere ähnliche Inhalte
Ähnlich wie sol pg 89 (20)
Mehr von Garden City (20)
Kürzlich hochgeladen (20)
sol pg 89
- 1. 02_ch02_pre-calculas12_wncp_solution.qxd 5/16/12 11:07 PM Page 1
Home Quit
Lesson 2.1 Exercises, pages 90–96
A
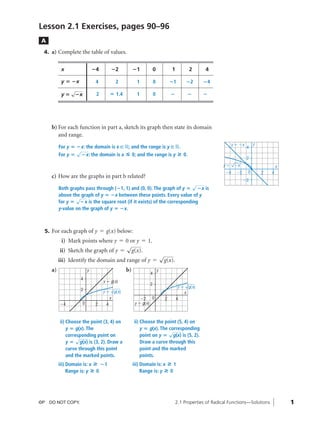
4. a) Complete the table of values.
x ؊4 ؊2 ؊1 0 1 2 4
y ؊ ؍x 4 2 1 0 ؊1 ؊2 ؊4
√
y ؊ ؍x 2 Џ 1.4 1 0 ؊ ؊ ؊
b) For each function in part a, sketch its graph then state its domain
and range.
For y ؊ ؍x: the domain is x ç ;ޒand the range is y ç .ޒ y ϭ Ϫx y
4
√
For y ؊ ؍x: the domain is x ◊ 0; and the range is y » 0.
2
√
y ϭ Ϫx x
Ϫ4 Ϫ2 0 2 4
c) How are the graphs in part b related?
Ϫ2
√
Both graphs pass through (؊1, 1) and (0, 0). The graph of y ؊ ؍x is
above the graph of y ؊ ؍x between these points. Every value of y
√
for y ؊ ؍x is the square root (if it exists) of the corresponding
y-value on the graph of y ؊ ؍x.
5. For each graph of y = g(x) below:
i) Mark points where y = 0 or y = 1.
√
ii) Sketch the graph of y = g(x).
√
iii) Identify the domain and range of y = g(x).
a) y b) y
4
4
y ϭ g(x) √
2
√ y ϭ g(x)
2 y ϭ g(x) x
x Ϫ2 0 2 4
Ϫ4 0 2 4 y ϭ g(x)
ii) Choose the point (3, 4) on ii) Choose the point (5, 4) on
y ؍g(x). The y ؍g(x). The corresponding
√
corresponding point on point on y ؍g(x) is (5, 2).
√
y ؍g(x) is (3, 2). Draw a Draw a curve through this
curve through this point point and the marked
and the marked points. points.
iii) Domain is: x » ؊1 iii) Domain is: x » 1
Range is: y » 0 Range is: y » 0
©P DO NOT COPY. 2.1 Properties of Radical Functions—Solutions 1
- 2. 02_ch02_pre-calculas12_wncp_solution.qxd 5/16/12 11:07 PM Page 2
Home Quit
c) y d) y
4
y ϭ g(x)
2 4
√
y ϭ g(x) x
√ 2
Ϫ4 Ϫ2 2 y ϭ g(x)
y ϭ g(x) x
Ϫ2
Ϫ4 Ϫ2 0
ii) Choose the point (؊5, 4) ii) Choose the point (؊3, 4) on
on y ؍g(x). The y ؍g(x). The corresponding
√
corresponding point on point on y ؍g(x) is
√
y ؍g(x) is (؊5, 2). Draw (؊3, 2). Draw a curve
a curve through this point through this point and the
and the marked points. marked points.
iii) Domain is: x ◊ ؊1 iii) Domain is: x ◊ 1
Range is: y » 0 Range is: y » 0
B
6. a) Use technology to graph each function. Sketch each graph.
√ √
i) y = 2x + 3 ii) y = -2x + 3
√ √
iii) y = -2x - 3 iv) y = 0.5x + 4
√ √
v) y = -0.5x - 4 vi) y = 0.5x - 4
b) Given a linear function of the form f(x) ϭ ax ϩ b, a, b Z 0
√
i) For which values of a does the graph of y = f(x) open to
the right? Use examples to support your answer.
The graph opens to the right when a>0, as in part a, i, iv, and vi.
2 2.1 Properties of Radical Functions—Solutions DO NOT COPY. ©P
- 3. 02_ch02_pre-calculas12_wncp_solution.qxd 5/16/12 11:08 PM Page 3
Home Quit
√
ii) For which values of a does the graph of y = f(x) open to
the left? Use examples to support your answer.
The graph opens to the left when a<0, as in part a, ii, iii, and v.
√
7. a) Complete this table of values for y ϭ x2 and y = x2, then graph
the functions on the same grid.
y
8
x ؊3 ؊2 ؊1 0 1 2 3
6 y ϭ x2
y ؍x2 9 4 1 0 1 4 9
√ 4 √
y؍ x2 3 2 1 0 1 2 3 y ϭ x2
2
x
√ Ϫ4 Ϫ2 0 2 4
b) What other function describes the graph of y = x2?
Explain why.
√
The graph of y ؍x 2 is the same as√ graph of y ͦ ؍xͦ . For any
√ 2 the
number x, x ؊( ؍x) ; both
2 2 2
x and (؊x) are equal to a positive
root, which is ͦxͦ .
8. a) For the graph of each quadratic function y ϭ f(x) below:
√
• Sketch the graph of y = f(x).
√
• State the domain and range of y = f(x).
i) y ii) y
4 16
y ϭ f(x)
2 12
√
y ϭ f (x) x
8
Ϫ8 Ϫ6 Ϫ4 Ϫ2 0
4 √
Ϫ2 y ϭ f (x)
y ϭ f(x) x
Ϫ4 0
Ϫ2 2
Mark points where y 0 ؍ There are no points where
or y .1 ؍Choose, then mark y 0 ؍or y .1 ؍Choose, then
another point on the graph mark other points on the graph
√ √
of y ؍f(x). of y ؍f(x).
√ √
x y ؍f(x) y؍ f(x) x y ؍f(x) y؍ f(x)
؊5 4 2 ؊2 12 Џ 3.5
0 4 2
Join all points with a smooth
curve. 2 12 Џ 3.5
Domain is: ؊7 ◊ x ◊ ؊3
Range is: 0 ◊ y ◊ 2 Join all points with a smooth
curve.
Domain is: x ç ޒ
Range is: y » 2
©P DO NOT COPY. 2.1 Properties of Radical Functions—Solutions 3
- 4. 02_ch02_pre-calculas12_wncp_solution.qxd 5/16/12 11:08 PM Page 4
Home Quit
√
b) Choose one pair of functions y = f(x) and y = f(x) from
part a. If the domains are different and the ranges are different,
explain why.
Sample response: For part a, i, the domains are different because the
radical function only exists for those values of x where y » 0; while the
quadratic function exists for all real values of x. The ranges are different
because the value of y for the radical function can only be 0 or a
positive number; while the range of the quadratic function is all real
numbers less than or equal to 4, which includes all negative real
numbers.
9. Solve each radical equation by graphing. Give the solution to the
nearest tenth where necessary.
√ √
a) x - 5 = 2 x + 3 b) x = 4 - x + 2
Write the equation as: Write the equation as:
√ √
x؊5؊2 x؉30؍ x؊ 4؊x؊20؍
Graph the related function: Graph the related function:
√ √
f(x) ؍x ؊ 5 ؊ 2 x ؉ 3 f(x) ؍x ؊ 4 ؊ x ؊ 2
The zero is: 13 The zero is: 3
So, the root is: x 31 ؍ So, the root is: x 3 ؍
√ √ √
c) 3 2x + 1 = x + 4 d) 1 + x - 3 = 2x - 6
Write the equation as: Write the equation as:
√ √ √
3 2x ؉ 1 ؊ x ؊ 4 0 ؍ 1 ؉ x ؊ 3 ؊ 2x ؊ 6 0 ؍
Graph the related function: Graph the related function:
√ √ √
f(x) 2 3 ؍x ؉ 1 ؊ x ؊ 4 f(x) ؉ 1 ؍x ؊ 3 ؊ 2x ؊ 6
The approximate zeros are: The approximate zero is:
0.75735931 and 9.2426407 8.8284271
So, the roots are: x Џ 0.8 and So, the root is: x Џ 8.8
x Џ 9.2
4 2.1 Properties of Radical Functions—Solutions DO NOT COPY. ©P
- 5. 02_ch02_pre-calculas12_wncp_solution.qxd 5/16/12 11:08 PM Page 5
Home Quit
10. For the graph of each cubic function y = g(x) below:
√
• Sketch the graph of y = g(x). √
• State the domain and range of y = g(x).
a) y b) y
y ϭ g(x) y ϭ g(x)
12 12
8 8
√
√ 4 4
y ϭ g(x)
y ϭ g(x)
x x
Ϫ2 0 2 0 2
Mark points where Mark points where y 0 ؍
y 0 ؍or y .1 ؍ or y .1 ؍Identify and mark
Identify and mark the the coordinates of other
coordinates of other points points on the graph of
√ √
on the graph of y ؍g(x). y ؍g(x).
√ √
x y ؍g(x) y؍ g(x) x y ؍g(x) y؍ g(x)
؊2 15 Џ 3.9 ؊1 3 Џ 1.7
2 3 Џ 1.7 3 15 Џ 3.9
Join the points with 2 smooth Join the points with 2 smooth
curves. curves.
Domain is: x ◊ ؊1 or Domain is: ؊2 ◊ x ◊ 0 or
1 ◊ x ◊ 3 x » 2
Range is: y » 0 Range is: y » 0
11. a) Sketch the graph of a linear function y = g(x) for which y
√ 4
y = √g(x) is not defined. Explain how you know that
y = g(x) is not defined. 2
√ x
Sample response: For y ؍g(x) to be undefined, the value of Ϫ4 Ϫ2 O 2 4
g(x) must always be negative; for example, a function is y .3؊ ؍ Ϫ2 y ϭ Ϫ3
Ϫ4
b) Sketch the graph of a quadratic function y = f(x) for which
√ y ϭ Ϫ(x Ϫ 2)2 Ϫ 2
y = √f(x) is not defined. Explain how you know that y
y = f(x) is not defined. x
Ϫ4 Ϫ2 0 2 4
√
Sample response: For y ؍f(x) to be undefined, the value of f(x) must Ϫ2
always be negative; so the graph of y ؍f(x) must always lie beneath
the x-axis; for example, a function is y (؊ ؍x ؊ 2)2 ؊ 2. Ϫ4
Ϫ6
©P DO NOT COPY. 2.1 Properties of Radical Functions—Solutions 5
- 6. 02_ch02_pre-calculas12_wncp_solution.qxd 5/16/12 11:08 PM Page 6
Home Quit
√
c) For every cubic function y = g(x), the function y = g(x) exists.
Explain why.
Since the graph of every cubic function either begins in Quadrant 2 and
ends in Quadrant 4, or begins in Quadrant 3 and ends in Quadrant 1,
there is always part of the graph above the x-axis; that is, the function
has positive values, so its square root exists.
√
12. For each graph of y = g(x), sketch the graph of y = g(x).
a) y b) y
4
6
y ϭ g(x) √2
4 y ϭ g(x)
√ x
y ϭ g(x) Ϫ4 Ϫ2 0
2 2 4 6
x Ϫ2
Ϫ4 Ϫ2 0 2 4 y ϭ g(x)
Mark points where y 0 ؍or Mark points where y 0 ؍
y .1 ؍Identify and mark and y .1 ؍Identify and mark
the coordinates of other the coordinates of other
points on the graph of points on the graph of
√ √
y ؍g(x). y ؍g(x).
√ √
x y ؍g(x) y؍ g(x) x y ؍g(x) y؍ g(x)
؊5 4 2 ؊4 4 2
؊3 2 Џ 1.4 4 2 Џ 1.4
1 2 Џ 1.4
Join the points with 2 smooth
3 4 2 curves.
Join the points with 2 smooth
curves, and a line segment.
6 2.1 Properties of Radical Functions—Solutions DO NOT COPY. ©P
- 7. 02_ch02_pre-calculas12_wncp_solution.qxd 5/16/12 11:08 PM Page 7
Home Quit
13. When a satellite is h kilometres above Earth, the time for one
complete orbit, t√
minutes, can be calculated using this formula:
t = 1.66 * 10 (h + 6370)3
-4
A communications satellite is to be positioned so that it is always
above the same point on Earth’s surface. It takes 24 h for this satellite
to complete one orbit. What should the height of the satellite be?
Substitute t ,)06()42( ؍or 1440.
√
1440 ( 4؊01 ؋ 66.1 ؍h ؉ 6370)3
Write the equation with all the terms on one side.
√
1440 ؊ 1.66 ؋ 10؊4 (h ؉ 6370)3 0 ؍
Write a related function.
√
f(h) ( 4؊01 ؋ 66.1 ؊ 0441 ؍h ؉ 6370)3
Graph the function, then determine the approximate zero, which is
35 848.513.
So, to the nearest kilometre, the satellite should be 35 849 km high.
C
√3
14. Given the graph of y = f(x), sketch the graph of y = f(x) without
using graphing technology. What are the invariant points on the
√
graph of y = 3 f(x)?
√ √ √
Since 3 ؊1 ,0 ؍ 0 3 ,1؊ ؍and 3 1 ,1 ؍ y
the invariant points occur where: y ,0 ؍ y ϭ f(x)
4
label these points A and B; y ,1 ؍label
these points C and D; and y ,1؊ ؍ 2 √
C D y ϭ 3 f(x)
label these points E and F. Since the x
cube root of a number between Ϫ3 A 0 B 3
0 and 1 is greater √ the number,
than E F
Ϫ2
the graph of y ؍f(x) lies above
3
the graph of y ؍f(x) between A and C, Ϫ4
and between B and D. Since the
cube root of a√number between 0 and ؊1 is less than the number, the
graph of y 3 ؍f(x) lies below the graph of y ؍f(x) between A and E,
and between B and F.
Identify and mark the coordinates of other points.
√
x y ؍f(x) y؍ 3
f(x)
؊3 5 Џ 1.7
0 ؊4 Џ ؊1.6
3 5 Џ 1.7
Join the points with a smooth curve.
©P DO NOT COPY. 2.1 Properties of Radical Functions—Solutions 7