SlideShare ist ein Scribd-Unternehmen logo
1 von 1
20th Canadian Conference on Global Health

Indigenous Mortality and Inequalities in Latin
27–29 October 2013
America: the cases of Brazil and Ecuador
Ottawa, Canada
Fatima Marinho de Souza1, Patricia Soliz1, Ramón
Martinez1, Airlane Alencar2, Fabiana Del Popolo3
1

Poster Number
91

Pan American Health Organization, 2University of Sao Paulo, Brazil, 3CELADE

Objective
Latin America (LA) has experienced
rapid improvements in life expectancy,
reduced poverty, and infant mortality.
Although social-economic, and health
disparities between indigenous and
non-indigenous remain.
Mortality information by ethnicity isn’t
available from most of LA countries.

Outcomes
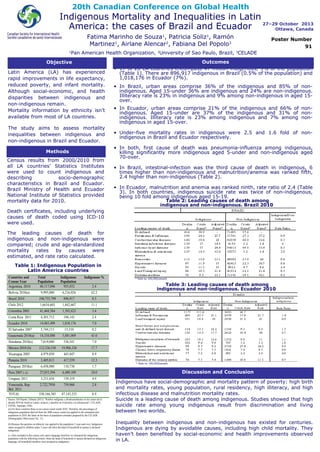
• 17 of 20 LA countries encompass 47 million indigenous, 9% of the population
(Table 1). There are 896,917 indigenous in Brazil (0.5% of the population) and
1,018,176 in Ecuador (7%).
• In Brazil, urban areas comprise 36% of the indigenous and 85% of nonTitle
indigenous. Aged 15-under 36% are indigenous and 24% are non-indigenous.
Illiteracy rate is 23% in indigenous and 9% among non-indigenous in aged 15over.
• In Ecuador, urban areas comprise 21% of the indigenous and 66% of nonindigenous. Aged 15-under are 37% of the indigenous and 31% of nonindigenous. Illiteracy rate is 23% among indigenous and 7% among nonindigenous in aged 15-over.

The study aims to assess mortality
inequalities between indigenous and
non-indigenous in Brazil and Ecuador.

• Under-five mortality rates in indigenous were 2.5 and 1.6 fold of nonindigenous in Brazil and Ecuador respectively.

Methods

• In both, first cause of death was pneumonia-influenza among indigenous,
killing significantly more indigenous aged 5-under and non-indigenous aged
70-over.

Census results from 2000/2010 from
all LA countries’ Statistics Institutes
were used to count indigenous and
describing
socio-demographic
characteristics in Brazil and Ecuador.
Brazil Ministry of Health and Ecuador
National Institute of Statistics provided
mortality data for 2010.

• In Brazil, intestinal-infection was the third cause of death in indigenous, 6
times higher than non-indigenous and malnutrition/anemia was ranked fifth,
2.4 higher than non-indigenous (Table 2).
• In Ecuador, malnutrition and anemia was ranked ninth, rate ratio of 2.4 (Table
3). In both countries, indigenous suicide rate was twice of non-indigenous,
being 10 fold among indigenous aged 15-19.
Table 2: Leading causes of death among
indigenous and non-indigenous. Brazil 2010

Death certificates, including underlying
causes of death coded using ICD-10
were used.
The leading causes of death for
indigenous and non-indigenous were
compared; crude and age-standardized
mortality rates by causes were
estimated, and rate ratio calculated.
Title
Table 1: Indigenous Population in
Latin America countries

Countries and
Census Year
Argentina, 2010

Total
Population
40,117,096

Indigenous
Population
955,032

Indigenous %

Bolivia 2010(a)

9,995,000

6,216,026

62.2

Brazil 2010

190,755,799

896,917

0.5

Chile 2012

1,6634,603

1,842,607

11.1

Colombia 2005

41,468,384

1,392,623

3.4

Costa Rica 2011

4,301,712

104,143

2.4

Ecuador 2010

14,483,499

1,018,176

7.0

El Salvador 2007

5,744,113

13,310

0.2

Guatemala 2010(a)

14,334,000

5,881,009

41.0

Honduras 2010(a)

7,619,000

536,541

7.0

Mexico 2010 (b)

112,336,538

19,906,326

17.7

Nicaragua 2005

4,979,850

443,847

8.9

* Rate by 100,000/people

Table 3: Leading causes of death among
indigenous and non-indigenous. Ecuador 2010

2.4

Panama 2010

Outcomes
3,405,813
417,559

12.3

Paraguay 2010(a)

6,458,000

110,730

1.7

Peru 2007 ( c)

27,053,394

6,489,109

24.0

Uruguay 2011

3,251,654

159,319

4.9

Venezuela, Rep.
Bol. 2011
TOTAL

2,722,7930

759,960

2.8

530,166,385

47,143,233

8.9

Source: Del Popolo, Fabiana (2013); "Pueblos indígenas y afrodescendientes en los censos de la
década 2010 de América Latina: avances y desafíos en el derecho a la información", CELADECEPAL, Santiago, Chile.
(a) For these countries there is not census round results 2010. Therefore, the percentages of
indigenous population derived from the 2000 census round was applied to the estimated total
population in 2010, the latter on the basis of population estimates prepared by the CELADE
(Demographic Observatory No. 11)
(b) Because the question on ethnicity was applied to the population 3 years and over, Indigenous
status assigned to children under 3 years old when the head of household or spouse is declared
indigenous
(c ) Peru included in this census only native language therefore we estimated the indigenous
population with the following criteria: when the head of household or spouse declared an indigenous
language, all household members were assigned as indigenous

Conclusion
s
Title

* Rate by 100,000/people

Discussion and Conclusion
Indigenous have social-demographic and mortality pattern of poverty: high birth
and mortality rates, young population, rural residency, high illiteracy, and high
infectious disease and malnutrition mortality rates.
Suicide is a leading cause of death among indigenous. Studies showed that high
suicide rate among young indigenous result from discrimination and living
between two worlds.
Inequality between indigenous and non-indigenous has existed for centuries.
Indigenous are dying by avoidable causes, including high child mortality. They
haven’t been benefited by social-economic and health improvements observed
in LA.

Weitere ähnliche Inhalte

Was ist angesagt?

Final project presentation
Final project presentationFinal project presentation
Final project presentationanhill
 
Determinants of mortality
Determinants of mortalityDeterminants of mortality
Determinants of mortalityBasanta Chalise
 
Data brief No. 14 Racial/Ethnic Disparities in Disability
Data brief No. 14 Racial/Ethnic Disparities in DisabilityData brief No. 14 Racial/Ethnic Disparities in Disability
Data brief No. 14 Racial/Ethnic Disparities in DisabilityThe Scan Foundation
 
How to approach Patient Diversity in the Medical Environment
How to approach Patient Diversity in the Medical EnvironmentHow to approach Patient Diversity in the Medical Environment
How to approach Patient Diversity in the Medical Environmentflasco_org
 
Factors Influencing Gender Disparities in the Prevalence of HIV AIDS in Fako ...
Factors Influencing Gender Disparities in the Prevalence of HIV AIDS in Fako ...Factors Influencing Gender Disparities in the Prevalence of HIV AIDS in Fako ...
Factors Influencing Gender Disparities in the Prevalence of HIV AIDS in Fako ...ijtsrd
 
Social Challenges Facing Low Income Earning Women Living With HIV/AIDS: A Cas...
Social Challenges Facing Low Income Earning Women Living With HIV/AIDS: A Cas...Social Challenges Facing Low Income Earning Women Living With HIV/AIDS: A Cas...
Social Challenges Facing Low Income Earning Women Living With HIV/AIDS: A Cas...paperpublications3
 
Ugandan Global Health Profile_MackenzieWright_2015
Ugandan Global Health Profile_MackenzieWright_2015Ugandan Global Health Profile_MackenzieWright_2015
Ugandan Global Health Profile_MackenzieWright_2015Mackenzie Wright
 
HaleySlone--Hunger--ECA-2
HaleySlone--Hunger--ECA-2HaleySlone--Hunger--ECA-2
HaleySlone--Hunger--ECA-2Haley Slone
 
2013 Council of State and Territorial Epidemiologists Annual Conference
2013 Council of State and Territorial Epidemiologists Annual Conference2013 Council of State and Territorial Epidemiologists Annual Conference
2013 Council of State and Territorial Epidemiologists Annual ConferenceKellieWatkins1
 

Was ist angesagt? (15)

EAJPHR, VOL. 20, No. 2 (December 2014)
EAJPHR, VOL. 20, No. 2 (December 2014)EAJPHR, VOL. 20, No. 2 (December 2014)
EAJPHR, VOL. 20, No. 2 (December 2014)
 
Final project presentation
Final project presentationFinal project presentation
Final project presentation
 
Binal thakkar
Binal thakkarBinal thakkar
Binal thakkar
 
Philippine Population
Philippine PopulationPhilippine Population
Philippine Population
 
Determinants of mortality
Determinants of mortalityDeterminants of mortality
Determinants of mortality
 
Data brief No. 14 Racial/Ethnic Disparities in Disability
Data brief No. 14 Racial/Ethnic Disparities in DisabilityData brief No. 14 Racial/Ethnic Disparities in Disability
Data brief No. 14 Racial/Ethnic Disparities in Disability
 
How to approach Patient Diversity in the Medical Environment
How to approach Patient Diversity in the Medical EnvironmentHow to approach Patient Diversity in the Medical Environment
How to approach Patient Diversity in the Medical Environment
 
Factors Influencing Gender Disparities in the Prevalence of HIV AIDS in Fako ...
Factors Influencing Gender Disparities in the Prevalence of HIV AIDS in Fako ...Factors Influencing Gender Disparities in the Prevalence of HIV AIDS in Fako ...
Factors Influencing Gender Disparities in the Prevalence of HIV AIDS in Fako ...
 
Mortality and causes of death 2015
Mortality and causes of death 2015Mortality and causes of death 2015
Mortality and causes of death 2015
 
Social Challenges Facing Low Income Earning Women Living With HIV/AIDS: A Cas...
Social Challenges Facing Low Income Earning Women Living With HIV/AIDS: A Cas...Social Challenges Facing Low Income Earning Women Living With HIV/AIDS: A Cas...
Social Challenges Facing Low Income Earning Women Living With HIV/AIDS: A Cas...
 
Poverty
PovertyPoverty
Poverty
 
Ugandan Global Health Profile_MackenzieWright_2015
Ugandan Global Health Profile_MackenzieWright_2015Ugandan Global Health Profile_MackenzieWright_2015
Ugandan Global Health Profile_MackenzieWright_2015
 
WK11ProjBenjaminE
WK11ProjBenjaminEWK11ProjBenjaminE
WK11ProjBenjaminE
 
HaleySlone--Hunger--ECA-2
HaleySlone--Hunger--ECA-2HaleySlone--Hunger--ECA-2
HaleySlone--Hunger--ECA-2
 
2013 Council of State and Territorial Epidemiologists Annual Conference
2013 Council of State and Territorial Epidemiologists Annual Conference2013 Council of State and Territorial Epidemiologists Annual Conference
2013 Council of State and Territorial Epidemiologists Annual Conference
 

Andere mochten auch

Data Visualization: New Health Data Value
Data Visualization: New Health Data ValueData Visualization: New Health Data Value
Data Visualization: New Health Data ValueRamon Martinez
 
Applications of analytics and visualizations in PAHO
Applications of analytics and visualizations in PAHOApplications of analytics and visualizations in PAHO
Applications of analytics and visualizations in PAHORamon Martinez
 
C603 regional health observatory-its role in the generation and dissemination...
C603 regional health observatory-its role in the generation and dissemination...C603 regional health observatory-its role in the generation and dissemination...
C603 regional health observatory-its role in the generation and dissemination...Ramon Martinez
 
PAHO Regional Health Observatory
PAHO Regional Health ObservatoryPAHO Regional Health Observatory
PAHO Regional Health ObservatoryPAHO_RHO
 
C606 the pan american health organizations health information and intelligenc...
C606 the pan american health organizations health information and intelligenc...C606 the pan american health organizations health information and intelligenc...
C606 the pan american health organizations health information and intelligenc...Ramon Martinez
 
Data Visualization in Public Health DC TUG March 17 2015
Data Visualization in Public Health DC TUG March 17 2015Data Visualization in Public Health DC TUG March 17 2015
Data Visualization in Public Health DC TUG March 17 2015Ramon Martinez
 
Data Preparation and Visualization for Monitoring NCDs Mortality
Data Preparation and Visualization for Monitoring NCDs MortalityData Preparation and Visualization for Monitoring NCDs Mortality
Data Preparation and Visualization for Monitoring NCDs MortalityRamon Martinez
 
Data Visualization in Health
Data Visualization in HealthData Visualization in Health
Data Visualization in HealthRamon Martinez
 

Andere mochten auch (8)

Data Visualization: New Health Data Value
Data Visualization: New Health Data ValueData Visualization: New Health Data Value
Data Visualization: New Health Data Value
 
Applications of analytics and visualizations in PAHO
Applications of analytics and visualizations in PAHOApplications of analytics and visualizations in PAHO
Applications of analytics and visualizations in PAHO
 
C603 regional health observatory-its role in the generation and dissemination...
C603 regional health observatory-its role in the generation and dissemination...C603 regional health observatory-its role in the generation and dissemination...
C603 regional health observatory-its role in the generation and dissemination...
 
PAHO Regional Health Observatory
PAHO Regional Health ObservatoryPAHO Regional Health Observatory
PAHO Regional Health Observatory
 
C606 the pan american health organizations health information and intelligenc...
C606 the pan american health organizations health information and intelligenc...C606 the pan american health organizations health information and intelligenc...
C606 the pan american health organizations health information and intelligenc...
 
Data Visualization in Public Health DC TUG March 17 2015
Data Visualization in Public Health DC TUG March 17 2015Data Visualization in Public Health DC TUG March 17 2015
Data Visualization in Public Health DC TUG March 17 2015
 
Data Preparation and Visualization for Monitoring NCDs Mortality
Data Preparation and Visualization for Monitoring NCDs MortalityData Preparation and Visualization for Monitoring NCDs Mortality
Data Preparation and Visualization for Monitoring NCDs Mortality
 
Data Visualization in Health
Data Visualization in HealthData Visualization in Health
Data Visualization in Health
 

Ähnlich wie Indigenous mortality and inequalities in Latin America

Montenegro -indigenous_health
Montenegro  -indigenous_healthMontenegro  -indigenous_health
Montenegro -indigenous_healthbueno buono good
 
the bmj BMJ 2021;373n1343 doi 10.1136bmj.n1343 1R E
the bmj  BMJ 2021;373n1343  doi 10.1136bmj.n1343 1R Ethe bmj  BMJ 2021;373n1343  doi 10.1136bmj.n1343 1R E
the bmj BMJ 2021;373n1343 doi 10.1136bmj.n1343 1R EGrazynaBroyles24
 
SOCIAL PROTECTION INTERVENTIONS FOR TB CONTROL: THE BRAZILIAN EXPERIENCE
SOCIAL PROTECTION INTERVENTIONS FOR TB CONTROL: THE BRAZILIAN EXPERIENCESOCIAL PROTECTION INTERVENTIONS FOR TB CONTROL: THE BRAZILIAN EXPERIENCE
SOCIAL PROTECTION INTERVENTIONS FOR TB CONTROL: THE BRAZILIAN EXPERIENCEUNITAID
 
Soc 2113 ch 20 2017
Soc 2113 ch 20 2017Soc 2113 ch 20 2017
Soc 2113 ch 20 2017WendyScott34
 
Diversity and Cultural Competency in Health Care Je.docx
 Diversity and Cultural Competency in Health Care     Je.docx Diversity and Cultural Competency in Health Care     Je.docx
Diversity and Cultural Competency in Health Care Je.docxShiraPrater50
 
Diversity and Cultural Competency in Health Care Je.docx
Diversity and Cultural Competency in Health Care     Je.docxDiversity and Cultural Competency in Health Care     Je.docx
Diversity and Cultural Competency in Health Care Je.docxAASTHA76
 
South America: Trends & Challenges for Development
South America: Trends & Challenges for DevelopmentSouth America: Trends & Challenges for Development
South America: Trends & Challenges for DevelopmentThe Rockefeller Foundation
 
CS12A - Lesson 1 : Human Population
CS12A - Lesson 1 : Human PopulationCS12A - Lesson 1 : Human Population
CS12A - Lesson 1 : Human PopulationMary Faith Balagbis
 
Indicators of development
Indicators of developmentIndicators of development
Indicators of developmentZeenia Ahmed
 
NYC, Race, Covid-19 [timestamp Jun 12, 2020]
NYC, Race, Covid-19 [timestamp Jun 12, 2020]NYC, Race, Covid-19 [timestamp Jun 12, 2020]
NYC, Race, Covid-19 [timestamp Jun 12, 2020]Swati Chaudhary
 
12.04.20 | COVID-19 Disparities in Black & Latino Communities: Implications f...
12.04.20 | COVID-19 Disparities in Black & Latino Communities: Implications f...12.04.20 | COVID-19 Disparities in Black & Latino Communities: Implications f...
12.04.20 | COVID-19 Disparities in Black & Latino Communities: Implications f...UC San Diego AntiViral Research Center
 
Mortality variations in Kenya
Mortality variations in KenyaMortality variations in Kenya
Mortality variations in KenyaMulenge Peter
 
IMPLEMENTATION OF PRIMARY CARE EDUCATION TO PROMOTE COLORECTAL C
IMPLEMENTATION OF PRIMARY CARE EDUCATION TO PROMOTE COLORECTAL CIMPLEMENTATION OF PRIMARY CARE EDUCATION TO PROMOTE COLORECTAL C
IMPLEMENTATION OF PRIMARY CARE EDUCATION TO PROMOTE COLORECTAL CLizbethQuinonez813
 
Human population explosion
Human population explosion Human population explosion
Human population explosion Asim Gm
 

Ähnlich wie Indigenous mortality and inequalities in Latin America (20)

Montenegro -indigenous_health
Montenegro  -indigenous_healthMontenegro  -indigenous_health
Montenegro -indigenous_health
 
the bmj BMJ 2021;373n1343 doi 10.1136bmj.n1343 1R E
the bmj  BMJ 2021;373n1343  doi 10.1136bmj.n1343 1R Ethe bmj  BMJ 2021;373n1343  doi 10.1136bmj.n1343 1R E
the bmj BMJ 2021;373n1343 doi 10.1136bmj.n1343 1R E
 
SOCIAL PROTECTION INTERVENTIONS FOR TB CONTROL: THE BRAZILIAN EXPERIENCE
SOCIAL PROTECTION INTERVENTIONS FOR TB CONTROL: THE BRAZILIAN EXPERIENCESOCIAL PROTECTION INTERVENTIONS FOR TB CONTROL: THE BRAZILIAN EXPERIENCE
SOCIAL PROTECTION INTERVENTIONS FOR TB CONTROL: THE BRAZILIAN EXPERIENCE
 
Soc 2113 ch 20 2017
Soc 2113 ch 20 2017Soc 2113 ch 20 2017
Soc 2113 ch 20 2017
 
Multicultural Affairs, Current Trends 2011
Multicultural Affairs, Current Trends 2011Multicultural Affairs, Current Trends 2011
Multicultural Affairs, Current Trends 2011
 
Diversity and Cultural Competency in Health Care Je.docx
 Diversity and Cultural Competency in Health Care     Je.docx Diversity and Cultural Competency in Health Care     Je.docx
Diversity and Cultural Competency in Health Care Je.docx
 
Diversity and Cultural Competency in Health Care Je.docx
Diversity and Cultural Competency in Health Care     Je.docxDiversity and Cultural Competency in Health Care     Je.docx
Diversity and Cultural Competency in Health Care Je.docx
 
Population by suresh kumar kundur
Population by suresh kumar kundurPopulation by suresh kumar kundur
Population by suresh kumar kundur
 
Global-Demography.pdf
Global-Demography.pdfGlobal-Demography.pdf
Global-Demography.pdf
 
South America: Trends & Challenges for Development
South America: Trends & Challenges for DevelopmentSouth America: Trends & Challenges for Development
South America: Trends & Challenges for Development
 
CS12A - Lesson 1 : Human Population
CS12A - Lesson 1 : Human PopulationCS12A - Lesson 1 : Human Population
CS12A - Lesson 1 : Human Population
 
Indicators of development
Indicators of developmentIndicators of development
Indicators of development
 
Unit 3. studying population
Unit 3. studying populationUnit 3. studying population
Unit 3. studying population
 
NYC, Race, Covid-19 [timestamp Jun 12, 2020]
NYC, Race, Covid-19 [timestamp Jun 12, 2020]NYC, Race, Covid-19 [timestamp Jun 12, 2020]
NYC, Race, Covid-19 [timestamp Jun 12, 2020]
 
12.04.20 | COVID-19 Disparities in Black & Latino Communities: Implications f...
12.04.20 | COVID-19 Disparities in Black & Latino Communities: Implications f...12.04.20 | COVID-19 Disparities in Black & Latino Communities: Implications f...
12.04.20 | COVID-19 Disparities in Black & Latino Communities: Implications f...
 
Mortality variations in Kenya
Mortality variations in KenyaMortality variations in Kenya
Mortality variations in Kenya
 
Global demography
Global demographyGlobal demography
Global demography
 
IMPLEMENTATION OF PRIMARY CARE EDUCATION TO PROMOTE COLORECTAL C
IMPLEMENTATION OF PRIMARY CARE EDUCATION TO PROMOTE COLORECTAL CIMPLEMENTATION OF PRIMARY CARE EDUCATION TO PROMOTE COLORECTAL C
IMPLEMENTATION OF PRIMARY CARE EDUCATION TO PROMOTE COLORECTAL C
 
Disproportionate Impact of Diabetes
Disproportionate Impact of DiabetesDisproportionate Impact of Diabetes
Disproportionate Impact of Diabetes
 
Human population explosion
Human population explosion Human population explosion
Human population explosion
 

Mehr von Ramon Martinez

Visualizando la prevalencia de HIV en el Mundo
Visualizando la prevalencia de HIV en el MundoVisualizando la prevalencia de HIV en el Mundo
Visualizando la prevalencia de HIV en el MundoRamon Martinez
 
Uru mort materna 12 de set 2011
Uru mort materna 12 de set 2011Uru mort materna 12 de set 2011
Uru mort materna 12 de set 2011Ramon Martinez
 
Mortalidad materna 2 ha
Mortalidad materna 2 haMortalidad materna 2 ha
Mortalidad materna 2 haRamon Martinez
 
Mortalidad materna 1 ha
Mortalidad materna 1 haMortalidad materna 1 ha
Mortalidad materna 1 haRamon Martinez
 
Mexbúsqueda m maternas sep2011
Mexbúsqueda m maternas sep2011Mexbúsqueda m maternas sep2011
Mexbúsqueda m maternas sep2011Ramon Martinez
 
Cri reunión montevideo
Cri reunión montevideoCri reunión montevideo
Cri reunión montevideoRamon Martinez
 
Chile investigacion de muertes maternas reunión mortalidad materna ops 2011
Chile investigacion de muertes maternas reunión mortalidad materna ops 2011Chile investigacion de muertes maternas reunión mortalidad materna ops 2011
Chile investigacion de muertes maternas reunión mortalidad materna ops 2011Ramon Martinez
 
Brasil investigacion de las muertes maternas
Brasil investigacion de las muertes maternasBrasil investigacion de las muertes maternas
Brasil investigacion de las muertes maternasRamon Martinez
 
Cc01 ops calidad_informacion
Cc01 ops calidad_informacionCc01 ops calidad_informacion
Cc01 ops calidad_informacionRamon Martinez
 
Cc01 ops diagnostico_capacitacion_fci
Cc01 ops diagnostico_capacitacion_fciCc01 ops diagnostico_capacitacion_fci
Cc01 ops diagnostico_capacitacion_fciRamon Martinez
 
Marinho fatima indicators targets post mdg_seattle_mar 2011
Marinho fatima indicators targets post mdg_seattle_mar 2011Marinho fatima indicators targets post mdg_seattle_mar 2011
Marinho fatima indicators targets post mdg_seattle_mar 2011Ramon Martinez
 
Global congres va fatima marinho bali_feb_2011p_final
Global congres va fatima marinho bali_feb_2011p_finalGlobal congres va fatima marinho bali_feb_2011p_final
Global congres va fatima marinho bali_feb_2011p_finalRamon Martinez
 

Mehr von Ramon Martinez (20)

Visualizando la prevalencia de HIV en el Mundo
Visualizando la prevalencia de HIV en el MundoVisualizando la prevalencia de HIV en el Mundo
Visualizando la prevalencia de HIV en el Mundo
 
Uru mort materna 12 de set 2011
Uru mort materna 12 de set 2011Uru mort materna 12 de set 2011
Uru mort materna 12 de set 2011
 
Motalidad matena clap
Motalidad matena clapMotalidad matena clap
Motalidad matena clap
 
Mortalidad materna 2 ha
Mortalidad materna 2 haMortalidad materna 2 ha
Mortalidad materna 2 ha
 
Mortalidad materna 1 ha
Mortalidad materna 1 haMortalidad materna 1 ha
Mortalidad materna 1 ha
 
Mexbúsqueda m maternas sep2011
Mexbúsqueda m maternas sep2011Mexbúsqueda m maternas sep2011
Mexbúsqueda m maternas sep2011
 
Cri reunión montevideo
Cri reunión montevideoCri reunión montevideo
Cri reunión montevideo
 
Crc clap 2011
Crc  clap 2011Crc  clap 2011
Crc clap 2011
 
Chile investigacion de muertes maternas reunión mortalidad materna ops 2011
Chile investigacion de muertes maternas reunión mortalidad materna ops 2011Chile investigacion de muertes maternas reunión mortalidad materna ops 2011
Chile investigacion de muertes maternas reunión mortalidad materna ops 2011
 
Brasil investigacion de las muertes maternas
Brasil investigacion de las muertes maternasBrasil investigacion de las muertes maternas
Brasil investigacion de las muertes maternas
 
Cc01 ops calidad_informacion
Cc01 ops calidad_informacionCc01 ops calidad_informacion
Cc01 ops calidad_informacion
 
Cc01 ops red_centros
Cc01 ops red_centrosCc01 ops red_centros
Cc01 ops red_centros
 
Cc01 cn argentina
Cc01 cn argentinaCc01 cn argentina
Cc01 cn argentina
 
Cc01 cevece venezuela
Cc01 cevece venezuelaCc01 cevece venezuela
Cc01 cevece venezuela
 
Cc01 cemece mexico
Cc01 cemece mexicoCc01 cemece mexico
Cc01 cemece mexico
 
Cc01 who fic_eic
Cc01 who fic_eicCc01 who fic_eic
Cc01 who fic_eic
 
Cc01 cbcd brasil
Cc01 cbcd brasilCc01 cbcd brasil
Cc01 cbcd brasil
 
Cc01 ops diagnostico_capacitacion_fci
Cc01 ops diagnostico_capacitacion_fciCc01 ops diagnostico_capacitacion_fci
Cc01 ops diagnostico_capacitacion_fci
 
Marinho fatima indicators targets post mdg_seattle_mar 2011
Marinho fatima indicators targets post mdg_seattle_mar 2011Marinho fatima indicators targets post mdg_seattle_mar 2011
Marinho fatima indicators targets post mdg_seattle_mar 2011
 
Global congres va fatima marinho bali_feb_2011p_final
Global congres va fatima marinho bali_feb_2011p_finalGlobal congres va fatima marinho bali_feb_2011p_final
Global congres va fatima marinho bali_feb_2011p_final
 

Indigenous mortality and inequalities in Latin America

  • 1. 20th Canadian Conference on Global Health Indigenous Mortality and Inequalities in Latin 27–29 October 2013 America: the cases of Brazil and Ecuador Ottawa, Canada Fatima Marinho de Souza1, Patricia Soliz1, Ramón Martinez1, Airlane Alencar2, Fabiana Del Popolo3 1 Poster Number 91 Pan American Health Organization, 2University of Sao Paulo, Brazil, 3CELADE Objective Latin America (LA) has experienced rapid improvements in life expectancy, reduced poverty, and infant mortality. Although social-economic, and health disparities between indigenous and non-indigenous remain. Mortality information by ethnicity isn’t available from most of LA countries. Outcomes • 17 of 20 LA countries encompass 47 million indigenous, 9% of the population (Table 1). There are 896,917 indigenous in Brazil (0.5% of the population) and 1,018,176 in Ecuador (7%). • In Brazil, urban areas comprise 36% of the indigenous and 85% of nonTitle indigenous. Aged 15-under 36% are indigenous and 24% are non-indigenous. Illiteracy rate is 23% in indigenous and 9% among non-indigenous in aged 15over. • In Ecuador, urban areas comprise 21% of the indigenous and 66% of nonindigenous. Aged 15-under are 37% of the indigenous and 31% of nonindigenous. Illiteracy rate is 23% among indigenous and 7% among nonindigenous in aged 15-over. The study aims to assess mortality inequalities between indigenous and non-indigenous in Brazil and Ecuador. • Under-five mortality rates in indigenous were 2.5 and 1.6 fold of nonindigenous in Brazil and Ecuador respectively. Methods • In both, first cause of death was pneumonia-influenza among indigenous, killing significantly more indigenous aged 5-under and non-indigenous aged 70-over. Census results from 2000/2010 from all LA countries’ Statistics Institutes were used to count indigenous and describing socio-demographic characteristics in Brazil and Ecuador. Brazil Ministry of Health and Ecuador National Institute of Statistics provided mortality data for 2010. • In Brazil, intestinal-infection was the third cause of death in indigenous, 6 times higher than non-indigenous and malnutrition/anemia was ranked fifth, 2.4 higher than non-indigenous (Table 2). • In Ecuador, malnutrition and anemia was ranked ninth, rate ratio of 2.4 (Table 3). In both countries, indigenous suicide rate was twice of non-indigenous, being 10 fold among indigenous aged 15-19. Table 2: Leading causes of death among indigenous and non-indigenous. Brazil 2010 Death certificates, including underlying causes of death coded using ICD-10 were used. The leading causes of death for indigenous and non-indigenous were compared; crude and age-standardized mortality rates by causes were estimated, and rate ratio calculated. Title Table 1: Indigenous Population in Latin America countries Countries and Census Year Argentina, 2010 Total Population 40,117,096 Indigenous Population 955,032 Indigenous % Bolivia 2010(a) 9,995,000 6,216,026 62.2 Brazil 2010 190,755,799 896,917 0.5 Chile 2012 1,6634,603 1,842,607 11.1 Colombia 2005 41,468,384 1,392,623 3.4 Costa Rica 2011 4,301,712 104,143 2.4 Ecuador 2010 14,483,499 1,018,176 7.0 El Salvador 2007 5,744,113 13,310 0.2 Guatemala 2010(a) 14,334,000 5,881,009 41.0 Honduras 2010(a) 7,619,000 536,541 7.0 Mexico 2010 (b) 112,336,538 19,906,326 17.7 Nicaragua 2005 4,979,850 443,847 8.9 * Rate by 100,000/people Table 3: Leading causes of death among indigenous and non-indigenous. Ecuador 2010 2.4 Panama 2010 Outcomes 3,405,813 417,559 12.3 Paraguay 2010(a) 6,458,000 110,730 1.7 Peru 2007 ( c) 27,053,394 6,489,109 24.0 Uruguay 2011 3,251,654 159,319 4.9 Venezuela, Rep. Bol. 2011 TOTAL 2,722,7930 759,960 2.8 530,166,385 47,143,233 8.9 Source: Del Popolo, Fabiana (2013); "Pueblos indígenas y afrodescendientes en los censos de la década 2010 de América Latina: avances y desafíos en el derecho a la información", CELADECEPAL, Santiago, Chile. (a) For these countries there is not census round results 2010. Therefore, the percentages of indigenous population derived from the 2000 census round was applied to the estimated total population in 2010, the latter on the basis of population estimates prepared by the CELADE (Demographic Observatory No. 11) (b) Because the question on ethnicity was applied to the population 3 years and over, Indigenous status assigned to children under 3 years old when the head of household or spouse is declared indigenous (c ) Peru included in this census only native language therefore we estimated the indigenous population with the following criteria: when the head of household or spouse declared an indigenous language, all household members were assigned as indigenous Conclusion s Title * Rate by 100,000/people Discussion and Conclusion Indigenous have social-demographic and mortality pattern of poverty: high birth and mortality rates, young population, rural residency, high illiteracy, and high infectious disease and malnutrition mortality rates. Suicide is a leading cause of death among indigenous. Studies showed that high suicide rate among young indigenous result from discrimination and living between two worlds. Inequality between indigenous and non-indigenous has existed for centuries. Indigenous are dying by avoidable causes, including high child mortality. They haven’t been benefited by social-economic and health improvements observed in LA.