1. Bonding with Iceland
Már Wolfgang Mixa
One of the fundamental questions regarding investments is the allocation
process, i.e., where to locate ones investments. This is mainly in regards to the
geographical allocation and the proportion of stocks and bonds within each area. Given
the fact that you, the reader, have logged on to www.bonds.is indicates that you have an
interest in Icelandic investments and may be contemplating whether government bonds
is a suitable starting point. Icelandic government bonds are, from my standpoint, hands
down where investors should concentrate their asset allocation when it comes to
Icelandic investments. I will show why.
When making investment decisions within each geographical market, my main
focus usually is the comparison of rate of returns between government bonds and
stocks. These comparisons are usually focused on the yield rates of the bonds and
price-earnings ratios, commonly known as P/E ratios. The yield rates simply show the
percentage returns one annually gains from investing in bonds. What P/E ratios
basically show is the amount of years it takes current profits of a company to
accumulate its current stock market value. A high P/E ratio, therefore, indicates that it
takes longer for a company to accumulate via profits its current market value. By
setting the number of that ratio under one, i.e., the inverse number, one finds the current
required rate of return of each stock.
Market Value Profits P/E ratio Inverse P/E ratio = Current required rate of return
A 100 10 10 1/10 = 10%
B 100 20 5 1/5 = 20%
C 200 20 10 1/10 = 10%
The general reason why companies have different P/E ratios is that expectations
differ regarding the future growth of profits of companies. This is mainly in regards to
the sectors in which those companies operate. It could be justified to invest in company
A, which has a high P/E ratio and thus a low current required rate of return, if valid
expectations are in store that its earnings will grow faster than those of company B.
Too often though, such earnings growth disappoints along the way. In general I believe
that one should stick to companies with lower P/E ratios that hence have a higher
required rate of return.
Companies can, of course, have exceptionally good and bad years. Profits
during one year, and thus the associated P/E ratio, are more likely than not an unreliable
indicator of the each company’s fair market value. When taking a weighted average of
profits among all the companies within a country index, however, the average P/E ratio
is a good indicator of current rates of return of the stock market as a whole.
The current rate of return for stocks still needs to be adjusted to inflation and
GDP forecasts for the coming years. By comparing then the required rate of returns
between government bonds and stocks one can find where one would be wise to invest.
Having said that, it follows that I believe that P/E ratios, bond yields and GDP growth
is what determines whether one should allocate most of ones investments within each
country in bonds or stocks (also actually which sectors within each country one should
focus on regarding stock-picking).
This comparison methodology has been successful in the past. Comparing for
example rates of return between US government bonds and the Standard and Poor´s 500
stock market index in the past sixteen years has been a good indicator of when one
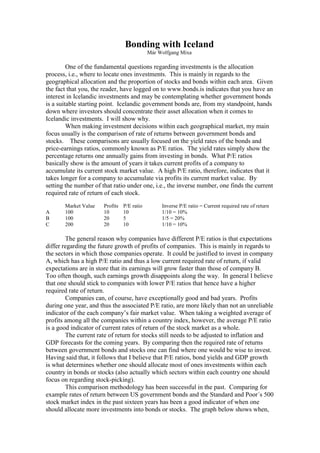
should allocate more investments into bonds or stocks. The graph below shows when,
2. according to this method, stocks are overvalued, hence bonds during the same period
being sound investment opportunities. At zero, stocks and bonds are equally attractive
investment opportunities, when the line goes below zero stocks become more attractive
and when it goes above zero bonds become the flavor of the month.
Value of 5 year US government bonds compared to the
S&P 500 stock index
0,60
0,50
0,40
0,30
0,20
0,10
0,00
-0,10
-0,20
-0,30
-0,40
86 87 88 89 90 91 92 93 94 95 96 97 98 99 00 01
There are four periods during this time interval that indicated that bonds were a
screaming buy, i.e. each time the line went above 20%. Not surprisingly, bonds gave
fantastic returns following such periods and stock prices consequentially fell sharply
three of those four periods. Observant readers probably note that the single most
screaming buy period was only a year ago when NASDAQ mania was close to its peak
and bonds considered to be only for old fuddy duddies. Since then bond prices have
skyrocketed while stock prices have plunged. Keep in mind that high valuations of
stocks not followed by higher profits increases their P/E ratios and thus lowers their
current required rate of returns.
This methodology has not been applicable in most other countries until recently
due to restrictions placed upon pension funds regarding the proportion of stocks they
were allowed to invest in. That decreased obviously the demand for stocks and had the
reverse effect on bonds. With such restrictions becoming history, such a comparison
method will become more applicable on a worldwide basis.
A couple of years ago I wrote an article introducing this comparison of yields
between bonds and stocks. The conclusion of the article was that the Icelandic stock
market was 50% overvalued compared to the rate of return obtained from government
bonds. At that time such an assertion seemed to be ludicrous. If one had, however,
invested 100 krona in the ICEX-15, Iceland’s main stock index, during that period one
would barely receive that 100 krona back today. That is a rather lousy rate of return if
you ask me. Bonds on the other hand have provided during the same period an
accumulated rate of return close to 20%. The methodology may have overshot
regarding the degree of under valuation of bonds but clearly gave an indication of
where the “wise” investor should have placed the bets.
3. According to last years figures, the rate of return of Icelandic stocks within the
ICEX-15 index is about 2,5% (last year was actually exceptionally bad, mainly because
of the high interest rate environment Icelandic companies face!). The rate returned by a
6-year non-indexed government bond today is about 10%, that is close to fourfold the
rate compared to the ICEX-15! In fact, the profits by the ICEX-15 index companies
have never at today’s market values come close to providing the rate of return that a
“risk-free” Icelandic government bonds provides today.
Usually, when bonds are obviously a wise investment choice, it is sensible to
keep the foot light on the pedal when it comes to stock investments. It may thus be
concluded that I believe that one should shy away from Icelandic stocks. Proposed tax
reductions for companies and anticipated rate cuts may, however, bode very well for
returns from Icelandic stocks in the coming years and could then very well outperform
the rate of returns bonds will offer. From that standpoint I am becoming more bullish
on Icelandic stocks than ever before. One only needs to look at the effect lowered
interest rates had on the US stock market from 1981 onwards. Those are, however, big
“ifs” which may not bear fruit whilst Icelandic bonds will surely provide a guaranteed
income. Icelandic bonds seem hence to be hands down the prudent first choice for
investors investing in Iceland.
Birt á vefsíðu Lánasýslu ríkisins, www.bonds.is, 30. apríl, 2001.