State and all local
•
0 gefällt mir•289 views

Census data on State and local government employment from 1997 - 2009

Empfohlen
Weitere ähnliche Inhalte
Mehr von Marc Danziger
Mehr von Marc Danziger (11)
Kürzlich hochgeladen
Kürzlich hochgeladen (20)
State and all local
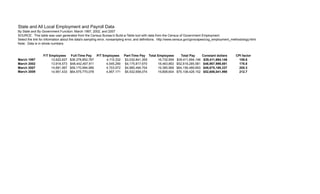
- 1. State and All Local Employment and Payroll Data By State and By Government Function: March 1997, 2002, and 2007 SOURCE: This table was user generated from the Census Bureau's Build-a-Table tool with data from the Census of Government Employment. Select the link for information about the data's sampling error, nonsampling error, and definitions. http://www.census.gov/govs/apes/cog_employment_methodology.html Note: Data is in whole numbers. F/T Employees Full-Time Pay P/T Employees Part-Time Pay Total Employees Total Pay Constant dollars CPI factor March 1997 12,622,627 $36,378,852,787 4,110,332 $3,032,841,359 16,732,959 $39,411,694,146 $39,411,694,146 159.6 March 2002 13,918,573 $48,442,467,911 4,545,290 $4,175,817,670 18,463,863 $52,618,285,581 $46,967,999,881 178.8 March 2007 14,681,997 $59,170,994,989 4,703,972 $4,985,494,704 19,385,969 $64,156,489,693 $49,875,186,337 205.3 March 2009 14,951,433 $64,575,770,078 4,857,171 $5,532,658,074 19,808,604 $70,108,428,152 $52,606,041,998 212.7