The HELCOM Maritime Assessment - how to visualize complex problems in the Baltic Sea
•Als PPTX, PDF herunterladen•
2 gefällt mir•557 views

This presentation was given at a course about data visualization at the Helsinki University and organized by Koponen+Hilden

Empfohlen
Weitere ähnliche Inhalte
Ähnlich wie The HELCOM Maritime Assessment - how to visualize complex problems in the Baltic Sea
Ähnlich wie The HELCOM Maritime Assessment - how to visualize complex problems in the Baltic Sea (20)
Mehr von Manuel Frias
Mehr von Manuel Frias (20)
Kürzlich hochgeladen
Kürzlich hochgeladen (20)
The HELCOM Maritime Assessment - how to visualize complex problems in the Baltic Sea
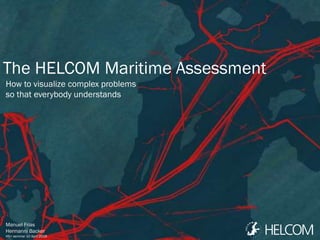
- 1. The HELCOM Maritime Assessment How to visualize complex problems so that everybody understands Manuel Frias Hermanni Backer HS+ seminar 10 April 2019
- 2. Hello, I am a geographer with no formal education in visual design
- 3. I am a biologist. I don't have any formal training in design or data visualization either. But we have something in common
- 4. We are interested in visualizing data so that as many as possible can understand
- 5. We are going to show you our attempt to make understandable complex issues in the Baltic Sea. We’ll put the report Maritime Assessment as an example
- 6. Scientific data is usually very difficult to visualize. Let us show you some examples
- 10. But before showing you the Maritime Assessment let me explain this thing called HELCOM
- 11. To understand HELCOM we need to talk about a sea that has many problems
- 12. The Baltic Sea is unique and fragile
- 13. There are four characteristics that make the Baltic Sea unique and fragile
- 14. Many people living around; it’s a small area; there are low levels of salt and the Baltic is not so deep!
- 15. This is how we usually see the Baltic Sea... But there is another way
- 16. This one—the catchment area. All rivers in this area flow into the Baltic Sea. Therefore, all the pollution of 85 million people.
- 17. The Baltic Sea is very small
- 18. How many Baltic Seas fit in the Indian Ocean?
- 19. 60
- 20. The Baltic Sea is one of the less salty seas in the world (which has implications for biodiversity) Leonid Mamchenkov Red Sea 40 East Med 39 Ocean seawater 35 Black Sea 20 Baltic Sea 7 Agriculture irrigation 2 Drinking water 0,1 Salinity ‰
- 21. 55 m 730 m 2 km 3,5 km 4 km It is also one of the shallowest seas in the world Baltic Baikal Med Atlantic PacificMean depth
- 22. 460 m 1,5 km 5 km 9 km 11 km Baltic Baikal Med Atlantic PacificMax depth Yes, the Baltic is like a big swimming pool
- 23. The Baltic Sea is unique. These special charactieristic make it very fragile.
- 24. Our dear sea has been so sick... and still is! That’s why HELCOM exists.
- 26. 50 years ago scientists started to realize that the Baltic Sea was getting very sick. What did they notice? Let’s see some graphs...
- 27. In meters WATER CLARITY summer Secchi depth 1900 6 7 8 9 10 11 1920 1940 1960 1980 2000 2020 In the beginning of the century the water was clear But the population increased dramatically from the 50’s and therefore its needs (more shipping traffic, more agriculture, more waste water…)
- 28. 1900 200 400 600 800 1000 1200 Tons per year (t/a) in .000 NITROGEN waterborne inputs via waterways 1920 1940 1960 1980 2000 2020 0 The amount of nitrogen released into the Baltic Sea, used for example in fertilizers, increased also dramatically
- 29. Tons per year (t/a) in .000 PHOSPHORUS waterborne inputs via waterways 1900 10 30 40 60 70 80 1920 1940 1960 1980 2000 2020 0 20 50 And also the amount of phosphorus
- 30. The excess of nitrogen and phosphorus causes EUTROPHICATION, one of the main problems of the Baltic Sea
- 31. It causes many problems. For example, bottom-living organisms in this area are dead due to eutrophication
- 32. An area bigger than Estonia!
- 33. In 1974, all countries around the Baltic Sea decided to react and signed the HELSINKI CONVENTION to protect the marine environment.
- 34. The Helsinki Commission (HELCOM) was established in order to apply the Convention. It is formed by all representatives of the 9 governments around the Baltic plus the EU
- 35. And the first HELCOM Secretariat was formed in 1981. The Secretariat coordinates HELCOM activities.
- 36. Now you know about HELCOM... Scientists and policy-makers together to save the Baltic Sea
- 37. But this is a workshop about data visualization. The scientific community need to visualize data in a way that policy-makers can understand
- 38. And this is very, very difficult. In my opinion there are three main reasons why it is challenging
- 39. 1. Lack of visual literacy Dan Roam (2011) ”Blah, blah, blah” Visual expression is considered to be for artists instead of a tool for thinking. Also, data visualization is not taught properly, if at all.
- 40. 2. ”It has always been done like this!” Doing something different is hard.
- 41. 3. Prioritize accuracy over clarity Scientists put, logically, a lot of emphasis in details. That’s good for research but not always for communicating.
- 42. We need to change this!
- 43. We in HELCOM are trying to make data more understandable. We don't have a formal training in data visualization but we like reading. Let me show you some examples of what we have done.
- 44. Joost Grootens This is a work HELCOM commissioned to Dutch designer Joost Grootens
- 46. Planning the Bothnian Sea was designed by Johannes Nieminen and Tuomas Siitonen
- 47. This animation of the shipping traffic with HELCOM data was made by Lauri Vanhala
- 48. We remade a report with tables and numbers and made it with maps and graphs—the Port Reception Facilities report
- 50. We designed this report ourselves
- 51. 2014 2018201720162015 Work starts Draft outline Draft text and design Layout Shipping traffic data processing It took us a while...
- 52. We made a lot of sketches
- 53. We were an international team
- 54. We are very proud of the visual contents, an alternative to the classical table of contents
- 60. That’s all folks! To sum up, we think it’s worthy taking the effort to visualize data properly.
- 61. But it’s challenging! It requires some skills but, above all, will and motivation.
- 62. Before we finish let’s have a look a those graphs you saw earlier about the status of the Baltic Sea.
- 63. 1900 200 400 600 800 1000 1200 Tons per year (t/a) in .000 NITROGEN waterborne inputs via waterways 1920 1940 1960 1980 2000 2020 0 We saw that the loads of nitrogen into the sea were increasing dramatically from the 50’s
- 64. 1900 200 400 600 800 1000 1200 Tons per year (t/a) in .000 NITROGEN waterborne inputs via waterways 1920 1940 1960 1980 2000 2020 0 HELCOM work begins In 1974 the Helsinki Convention was signed
- 65. 1900 200 400 600 800 1000 1200 Tons per year (t/a) in .000 NITROGEN waterborne inputs via waterways 1920 1940 1960 1980 2000 2020 0 What happened afterwards? HELCOM work begins
- 66. 1900 200 400 600 800 1000 1200 Tons per year (t/a) in .000 NITROGEN waterborne inputs via waterways 1920 1940 1960 1980 2000 2020 0 Do you want to see it? HELCOM work begins
- 67. 1900 200 400 600 800 1000 1200 Tons per year (t/a) in .000 NITROGEN waterborne inputs via waterways 1920 1940 1960 1980 2000 2020 0 Do you REALLY want to see it? HELCOM work begins
- 68. 1900 200 400 600 800 1000 1200 Tons per year (t/a) in .000 NITROGEN waterborne inputs via waterways 1920 1940 1960 1980 2000 2020 0 HELCOM work begins Yes! After HELCOM started its activities the nitrogen loads have decreased significantly
- 69. Tons per year (t/a) in .000 PHOSPHORUS waterborne inputs via waterways 1900 10 30 40 60 70 80 1920 1940 1960 1980 2000 2020 0 20 50 And what happened with the phophorus loads? HELCOM work begins
- 70. Tons per year (t/a) in .000 PHOSPHORUS waterborne inputs via waterways 1900 10 30 40 60 70 80 1920 1940 1960 1980 2000 2020 0 20 50 Remember that excess of both nitrogen and phosphorus contribute to eutrophication… HELCOM work begins
- 71. Tons per year (t/a) in .000 PHOSPHORUS waterborne inputs via waterways 1900 10 30 40 60 70 80 1920 1940 1960 1980 2000 2020 0 20 50 HELCOM work begins Yes! The reduction of phosphorus into the Baltic Sea decreased also notably
- 72. In meters WATER CLARITY summer Secchi depth 1900 6 7 8 9 10 11 1920 1940 1960 1980 2000 2020 But what happened with the water clarity? HELCOM work begins
- 73. In meters WATER CLARITY summer Secchi depth 1900 6 7 8 9 10 11 1920 1940 1960 1980 2000 2020 If there are less nitrogen and phosphorus, in other words less polution, the water must be clearer, right? HELCOM work begins
- 74. In meters WATER CLARITY summer Secchi depth 1900 6 7 8 9 10 11 1920 1940 1960 1980 2000 2020 HELCOM work begins WRONG! Nitrogen, phosphorus and other contaminants are decreasing but this reduction is not yet enough. So there is still A LOT TO DO!
Hinweis der Redaktion
- But before that, let me first show you briefly where I work. The Baltic Sea looks like a normal sea in North Europe. But it has some characteristics that makes it specially sensitive: Closed sea Low levels of salt Shallow (55 m compared to 4 km of Indian Ocean) Large population around (85 million) Small I was curious to see how small compared to the area of the Nairobi Convention.
- But before that, let me first show you briefly where I work. The Baltic Sea looks like a normal sea in North Europe. But it has some characteristics that makes it specially sensitive: Closed sea Low levels of salt Shallow (55 m compared to 4 km of Indian Ocean) Large population around (85 million) Small I was curious to see how small compared to the area of the Nairobi Convention.
- But before that, let me first show you briefly where I work. The Baltic Sea looks like a normal sea in North Europe. But it has some characteristics that makes it specially sensitive: Closed sea Low levels of salt Shallow (55 m compared to 4 km of Indian Ocean) Large population around (85 million) Small I was curious to see how small compared to the area of the Nairobi Convention.
- The Baltic Sea also has some special physical caracteristics such as the depth and the salinity. The water salinity is very low. This is a result of the abundant freshwater runoff from the land; because it is semi-enclosed due to the Danish straight en route to the Atlantic ocean; and also because the Baltic Sea is very shallow (less water than in deep seas).
- Comparing the depth of the Baltic Sea to some other water bodies
- Comparing the depth of the Baltic Sea to some other water bodies
- The water was getting darker and less transparent. Cyanobacterial blooms become more frequent.
- N inputs were increasing dramatically
- N inputs were increasing dramatically
- In 1974, the international community around the BS decided to react and to do something for protection the marine environment. In 1974, seven countries signed the Helsinki Convention in Helsinki, Finland, which had won the hosting of the Baltic Sea diplomatic conference. This was rather historical/pioneering since The signing happened just two year after the Stockholm Conference, considered as the first major sign of global recognition of environmental concerns, and the conception of United Nations Environment Programme (UNEP). The Iron Curtain was still laying rigid but the Baltic Sea protection offered a cause to protect the common sea area, despite the Cold War
- Once they had THE LAW they needed someone to apply that law: countries. As the dictinary says a Commission is a group of people who do something: countries to restore the health of the Baltic HELCOM is not an NGO (non-governmental organization), or a private enterprise, institution nor a foundation. HELCOM = Helsinki Commission = Baltic Marine Environment Protection Commission. HELsinki COMmission -> because the Convention was signed in Helsinki, and the Commission ensures that the Convention is implemented by its signatories
- The HELCOM Secretariat coordinates HELCOM activities, hosts and manages many of the databases, produces maps,
- Most of the population and human activities are along the coast pressures to the marine environment The Baltic Sea is used by thousand ofshipping vessels and the traffic is increasing year after year. Major oil spills can happen and smal scale oil pollutions events are occur ingin the marine enviroment.
- Why is the MarAss different.
- N inputs were increasing dramatically
- N inputs were increasing dramatically
- N inputs were increasing dramatically
- N inputs were increasing dramatically
- N inputs were increasing dramatically
- N inputs were increasing dramatically
- N inputs were increasing dramatically
- N inputs were increasing dramatically
- N inputs were increasing dramatically
- The water was getting darker and less transparent. Cyanobacterial blooms become more frequent.
- The water was getting darker and less transparent. Cyanobacterial blooms become more frequent.
- The water was getting darker and less transparent. Cyanobacterial blooms become more frequent.