Weitere ähnliche Inhalte Ähnlich wie Evaluation Tool Rurener 30 11 09 (20) Kürzlich hochgeladen (20) 1. CRITERIA Relevance Effectiveness Efficiency Potential Impacts Sustainability Value-for-money Target Group Satisfaction
INDICATORS Indicator 1 Indicator 2 Indicator 3 Indicator 4 Indicator 5 Indicator 6 Indicator 7 Indicator 8 Indicator 9 Indicator 10 Indicator 11 Indicator 12 Indicator 13 Indicator 14
SUM
SEPARATION SUM RELATIVE SUM INPUT
WP Task IDEAL TARGET ANTI-IDEAL SEPARATION MEASURE ANTI- SEPARATION CLOSENESS TO THE INPUT ZERO
WP Name WP Task Actions Evaluating Member Normalized Decision Matrix VALUES VALUES MEASURE IDEAL IDEAL MEASURES IDEAL RANGE VALUES
1. Management Indicator 1 Indicator 2 Indicator 3 Indicator 4 Indicator 5 Indicator 6 Indicator 7 Indicator 8 Indicator 9 Indicator 10 Indicator 11 Indicator 12 Indicator 13 Indicator 14
Management of Organization of
project meetings kick-off meeting 1 1 1 1 1 1 1 1 1 1 1 1 1 1 1 0.35 0 0 1 0.35 0 0 1 0.35 0 0 1 0.35 0 0 1 0.35 0 0 1 0.35 0 0 1 0.35 0 0 1 0.35 0 0 1 0.35 0 0 1 0.35 0 0 1 0.35 0 0 1 0.35 0 0 1 0.35 0 0 1 0.35 0 0 0.354 0.354 0.000 0.000 0.000 0.000 112 112
Meetings
coordination 1 1 1 1 1 1 1 1 1 1 1 1 1 1 1 0.35 0 0 1 0.35 0 0 1 0.35 0 0 1 0.35 0 0 1 0.35 0 0 1 0.35 0 0 1 0.35 0 0 1 0.35 0 0 1 0.35 0 0 1 0.35 0 0 1 0.35 0 0 1 0.35 0 0 1 0.35 0 0 1 0.35 0 0 0.354 0.354 0.000 0.000 0.000 0.000
On-line meetings
and Consortium
intranet 1 1 1 1 1 1 1 1 1 1 1 1 1 1 1 0.35 0 0 1 0.35 0 0 1 0.35 0 0 1 0.35 0 0 1 0.35 0 0 1 0.35 0 0 1 0.35 0 0 1 0.35 0 0 1 0.35 0 0 1 0.35 0 0 1 0.35 0 0 1 0.35 0 0 1 0.35 0 0 1 0.35 0 0 0.354 0.354 0.000 0.000 0.000 0.000
Progress
Reports,
Intermediate
Report, Final
Reports Report 1 1 1 1 1 1 1 1 1 1 1 1 1 1 1 0.35 0 0 1 0.35 0 0 1 0.35 0 0 1 0.35 0 0 1 0.35 0 0 1 0.35 0 0 1 0.35 0 0 1 0.35 0 0 1 0.35 0 0 1 0.35 0 0 1 0.35 0 0 1 0.35 0 0 1 0.35 0 0 1 0.35 0 0 0.354 0.354 0.000 0.000 0.000 0.000
Cost Statements 1 1 1 1 1 1 1 1 1 1 1 1 1 1 1 0.35 0 0 1 0.35 0 0 1 0.35 0 0 1 0.35 0 0 1 0.35 0 0 1 0.35 0 0 1 0.35 0 0 1 0.35 0 0 1 0.35 0 0 1 0.35 0 0 1 0.35 0 0 1 0.35 0 0 1 0.35 0 0 1 0.35 0 0 0.354 0.354 0.000 0.000 0.000 0.000
Monitoring & Creation of
Evaluation monitoring board 1 1 1 1 1 1 1 1 1 1 1 1 1 1 1 0.35 0 0 1 0.35 0 0 1 0.35 0 0 1 0.35 0 0 1 0.35 0 0 1 0.35 0 0 1 0.35 0 0 1 0.35 0 0 1 0.35 0 0 1 0.35 0 0 1 0.35 0 0 1 0.35 0 0 1 0.35 0 0 1 0.35 0 0 0.354 0.354 0.000 0.000 0.000 0.000
Evaluation
Methodology 1 1 1 1 1 1 1 1 1 1 1 1 1 1 1 0.35 0 0 1 0.35 0 0 1 0.35 0 0 1 0.35 0 0 1 0.35 0 0 1 0.35 0 0 1 0.35 0 0 1 0.35 0 0 1 0.35 0 0 1 0.35 0 0 1 0.35 0 0 1 0.35 0 0 1 0.35 0 0 1 0.35 0 0 0.354 0.354 0.000 0.000 0.000 0.000
Data collection
to feed indicators 1 1 1 1 1 1 1 1 1 1 1 1 1 1 1 0.35 0 0 1 0.35 0 0 1 0.35 0 0 1 0.35 0 0 1 0.35 0 0 1 0.35 0 0 1 0.35 0 0 1 0.35 0 0 1 0.35 0 0 1 0.35 0 0 1 0.35 0 0 1 0.35 0 0 1 0.35 0 0 1 0.35 0 0 0.354 0.354 0.000 0.000 0.000 0.000
8 0 0 8 0 0 8 0 0 8 0 0 8 0 0 8 0 0 8 0 0 8 0 0 8 0 0 8 0 0 8 0 0 8 0 0 8 0 0 8 0 0 0 0.354 0.354
WP1
PERFORMANCE TO
DATE VERY LOW ☺ 2.83 0 2.83 0 2.83 0 2.83 0 2.83 0 2.83 0 2.83 0 2.83 0 2.83 0 2.83 0 2.83 0 2.83 0 2.83 0 2.83 0 0.354 0.354
0.354 0.354 0.200
0.354 0.354
0.354 0.354
0.354 0.354
3 7 16 0
5
7
2. CRITERIA Relevance Effectiveness
INDICATORS Indicator 1 Indicator 2 Indicator 3
WP Name WP Task WP Task Actions
2. Opportunities
and methods
toward energetic-
neutral villages
1 1 1
Share common
Building on definitions (rural
previous communities,
experiences energetic neutrality...)
1 1 1
Identify and analyse
pilot communities
profiles (SWOT
analysis, questioner)
1 1 1
Identify how energetic
neutrality can impact
local economic
development
Identify existing 1 1 1
methodologies of
energy strategies in
rural areas
1 1 1
Inventory of existing
measure tools,
analysis of strengths
and weaknesses
1 1 1
Designing adapted
A model toward methodological
energetic neutrality modules
1 1 1
Building tools to
measure progress
1 1 1
on-line pedagogical
guidelines
4. Effectiveness Efficiency Potential Impacts Sustainability Value-for-money
Indicator 4 Indicator 5 Indicator 6 Indicator 7 Indicator 8 Indicator 9 Indicator 10 Indicator 11
1 1 1 1 1 1 1 1
1 1 1 1 1 1 1 1
1 1 1 1 1 1 1 1
1 1 1 1 1 1 1 1
1 1 1 1 1 1 1 1
1 1 1 1 1 1 1 1
1 1 1 1 1 1 1 1
1 1 1 1 1 1 1 1
6. Value-for-money Target Group Satisfaction
Indicator 12 Indicator 13 Indicator 14
Indicator 1
1 1 1
1 0.35 0
1 1 1
1 0.35 0
1 1 1
1 0.35 0
1 1 1
1 0.35 0
1 1 1
1 0.35 0
1 1 1
1 0.35 0
1 1 1
1 0.35 0
1 1 1
1 0.35 0
8 0 0
8. Indicator 2 Indicator 3
0 1 0.35 0 0 1 0.35 0 0
0 1 0.35 0 0 1 0.35 0 0
0 1 0.35 0 0 1 0.35 0 0
0 1 0.35 0 0 1 0.35 0 0
0 1 0.35 0 0 1 0.35 0 0
0 1 0.35 0 0 1 0.35 0 0
0 1 0.35 0 0 1 0.35 0 0
0 1 0.35 0 0 1 0.35 0 0
0.13 8 0 0 8 0 0
10. Indicator 4 Indicator 5 Indicator 6
1 0.35 0 0 1 0.35 0 0 1
1 0.35 0 0 1 0.35 0 0 1
1 0.35 0 0 1 0.35 0 0 1
1 0.35 0 0 1 0.35 0 0 1
1 0.35 0 0 1 0.35 0 0 1
1 0.35 0 0 1 0.35 0 0 1
1 0.35 0 0 1 0.35 0 0 1
1 0.35 0 0 1 0.35 0 0 1
8 0 0 8 0 0 8
12. Evaluating Member Normalized Decision M
Indicator 7 Indicator 8
0.35 0 0 1 0.35 0 0 1 0.35
0.35 0 0 1 0.35 0 0 1 0.35
0.35 0 0 1 0.35 0 0 1 0.35
0.35 0 0 1 0.35 0 0 1 0.35
0.35 0 0 1 0.35 0 0 1 0.35
0.35 0 0 1 0.35 0 0 1 0.35
0.35 0 0 1 0.35 0 0 1 0.35
0.35 0 0 1 0.35 0 0 1 0.35
0 0 8 0 0 8 0
14. zed Decision Matrix
Indicator 9 Indicator 10
0 0 1 0.35 0 0 1 0.35 0
0 0 1 0.35 0 0 1 0.35 0
0 0 1 0.35 0 0 1 0.35 0
0 0 1 0.35 0 0 1 0.35 0
0 0 1 0.35 0 0 1 0.35 0
0 0 1 0.35 0 0 1 0.35 0
0 0 1 0.35 0 0 1 0.35 0
0 0 1 0.35 0 0 1 0.35 0
0 8 0 0 8 0 0
16. Indicator 11 Indicator 12
0 1 0.35 0 0 1 0.35 0
0 1 0.35 0 0 1 0.35 0
0 1 0.35 0 0 1 0.35 0
0 1 0.35 0 0 1 0.35 0
0 1 0.35 0 0 1 0.35 0
0 1 0.35 0 0 1 0.35 0
0 1 0.35 0 0 1 0.35 0
0 1 0.35 0 0 1 0.35 0
8 0 0 8 0 0
18. Indicator 13 Indicator 14
0 1 0.35 0 0 1 0.35 0
0 1 0.35 0 0 1 0.35 0
0 1 0.35 0 0 1 0.35 0
0 1 0.35 0 0 1 0.35 0
0 1 0.35 0 0 1 0.35 0
0 1 0.35 0 0 1 0.35 0
0 1 0.35 0 0 1 0.35 0
0 1 0.35 0 0 1 0.35 0
8 0 0 8 0 0
20. SEPARATION SEPARATION
IDEAL TARGET ANTI-IDEAL MEASURE MEASURE ANTI-
VALUES VALUES IDEAL IDEAL
0 0.354 0.354 0.000 0.000
0 0.354 0.354 0.000 0.000
0 0.354 0.354 0.000 0.000
0 0.354 0.354 0.000 0.000
0 0.354 0.354 0.000 0.000
0 0.354 0.354 0.000 0.000
0 0.354 0.354 0.000 0.000
0 0.354 0.354 0.000 0.000
0 0.354 0.354
21. 0.354 0.354
0.354 0.354
0.354 0.354
0.354 0.354
0.354 0.354
22. SUM RELATIVE
SEPARATION CLOSENESS TO SUM INPUT INPUT ZERO
MEASURES THE IDEAL RANGE VALUES
0.000 0.000 112 112
0.000 0.000
0.000 0.000
0.000 0.000
0.000 0.000
0.000 0.000
0.000 0.000
0.000 0.000
24. CRITERIA Relevance Effectiveness
INDICATORS Indicator 1 Indicator 2 Indicator 3
3. A Network to
WP Name
enhance WP Task WP Task Actions
energetic-neutral
communities
Use information and
On-line Knowledge communication
transfer technologies 1 1 1
Identify experts to
answer to the
communities'
questions 1 1 1
Manage language
barrier to allow
mutualisation of
expertise 1 1 1
Database of
network members
presenting their
Mentoring process areas of expertise 1 1 1
Identify mentors,
pupils and twins:
“communities to
support
communities” 1 1 1
Network Charter,
Sustainability of the updated database
Network and information 1 1 1
Evaluate progresses
Links with other
of the Network
rural/energy
Community 1 1 1
networks; future
structure of the
network 1 1 1
WP3 PERFORMANCE TO
DATE VERY LOW ☺
26. Effectiveness Efficiency Potential Impacts Sustainability Value-for-money
Indicator 4 Indicator 5 Indicator 6 Indicator 7 Indicator 8 Indicator 9 Indicator 10 Indicator 11
1 1 1 1 1 1 1 1
1 1 1 1 1 1 1 1
1 1 1 1 1 1 1 1
1 1 1 1 1 1 1 1
1 1 1 1 1 1 1 1
1 1 1 1 1 1 1 1
1 1 1 1 1 1 1 1
1 1 1 1 1 1 1 1
28. Value-for-money Target Group Satisfaction
Indicator 12 Indicator 13 Indicator 14
Indicator 1
1 1 1 1 0.35 0
1 1 1 1 0.35 0
1 1 1 1 0.35 0
1 1 1 1 0.35 0
1 1 1 1 0.35 0
1 1 1 1 0.35 0
1 1 1 1 0.35 0
1 1 1 1 0.35 0
8 0 0
2.83 0
30. Indicator 2 Indicator 3
0 1 0.35 0 0 1 0.35 0 0
0 1 0.35 0 0 1 0.35 0 0
0 1 0.35 0 0 1 0.35 0 0
0 1 0.35 0 0 1 0.35 0 0
0 1 0.35 0 0 1 0.35 0 0
0 1 0.35 0 0 1 0.35 0 0
0 1 0.35 0 0 1 0.35 0 0
0 1 0.35 0 0 1 0.35 0 0
0.13 8 0 0 8 0 0
2.83 0 2.83 0
32. Indicator 4 Indicator 5 Indicator 6
1 0.35 0 0 1 0.35 0 0 1
1 0.35 0 0 1 0.35 0 0 1
1 0.35 0 0 1 0.35 0 0 1
1 0.35 0 0 1 0.35 0 0 1
1 0.35 0 0 1 0.35 0 0 1
1 0.35 0 0 1 0.35 0 0 1
1 0.35 0 0 1 0.35 0 0 1
1 0.35 0 0 1 0.35 0 0 1
8 0 0 8 0 0 8
2.83 0 2.83 0 2.83
34. Evaluating Member Normalized Decision M
Indicator 7 Indicator 8
0.35 0 0 1 0.35 0 0 1 0.35
0.35 0 0 1 0.35 0 0 1 0.35
0.35 0 0 1 0.35 0 0 1 0.35
0.35 0 0 1 0.35 0 0 1 0.35
0.35 0 0 1 0.35 0 0 1 0.35
0.35 0 0 1 0.35 0 0 1 0.35
0.35 0 0 1 0.35 0 0 1 0.35
0.35 0 0 1 0.35 0 0 1 0.35
0 0 8 0 0 8 0
0 2.83 0 2.83
36. ed Decision Matrix
Indicator 9 Indicator 10
0 0 1 0.35 0 0 1 0.35 0
0 0 1 0.35 0 0 1 0.35 0
0 0 1 0.35 0 0 1 0.35 0
0 0 1 0.35 0 0 1 0.35 0
0 0 1 0.35 0 0 1 0.35 0
0 0 1 0.35 0 0 1 0.35 0
0 0 1 0.35 0 0 1 0.35 0
0 0 1 0.35 0 0 1 0.35 0
0 8 0 0 8 0 0
0 2.83 0 2.83 0
38. Indicator 11 Indicator 12
0 1 0.35 0 0 1 0.35 0 0
0 1 0.35 0 0 1 0.35 0 0
0 1 0.35 0 0 1 0.35 0 0
0 1 0.35 0 0 1 0.35 0 0
0 1 0.35 0 0 1 0.35 0 0
0 1 0.35 0 0 1 0.35 0 0
0 1 0.35 0 0 1 0.35 0 0
0 1 0.35 0 0 1 0.35 0 0
8 0 0 8 0 0
2.83 0 2.83 0
40. Indicator 13 Indicator 14
1 0.35 0 0 1 0.35 0 0
1 0.35 0 0 1 0.35 0 0
1 0.35 0 0 1 0.35 0 0
1 0.35 0 0 1 0.35 0 0
1 0.35 0 0 1 0.35 0 0
1 0.35 0 0 1 0.35 0 0
1 0.35 0 0 1 0.35 0 0
1 0.35 0 0 1 0.35 0 0
8 0 0 8 0 0 0
2.83 0 2.83 0
42. IDEAL TARGET ANTI-IDEAL SEPARATION SEPARATION MEASURE
VALUES VALUES MEASURE IDEAL ANTI-IDEAL
0.354 0.354 0.000 0.000
0.354 0.354 0.000 0.000
0.354 0.354 0.000 0.000
0.354 0.354 0.000 0.000
0.354 0.354 0.000 0.000
0.354 0.354 0.000 0.000
0.354 0.354 0.000 0.000
0.354 0.354 0.000 0.000
0.354 0.354
0.354 0.354
0.354 0.354
0.354 0.354
0.354 0.354
44. RELATIVE
SUM SEPARATION CLOSENESS TO THE SUM INPUT INPUT ZERO
MEASURES IDEAL RANGE VALUES
0.000 0.000 112 112
0.000 0.000
0.000 0.000
0.000 0.000
0.000 0.000
0.000 0.000
0.000 0.000
0.000 0.000
0.200
46. CRITERIA Relevance Effectiveness
INDICATORS Indicator 1 Indicator 2 Indicator 3
WP Name local WP Task
4. Concrete WP Task Actions
actions in
energetic-neutral
communities
Strategic
commitment
(become a 1 1 1
Commitment of Energetic-neutral
communities community)
Commitment to tools
(benefit from network 1 1 1
tools and activities)
Implementations Raising awareness 1 1 1
and actions at local level
Collect energy data
at the local level (see 1 1 1
WP2 t2)
Set-up Energy
strategies in small 1 1 1
rural communities
Active mentoring and
twinning: one to one 1 1 1
training and
experience sharing
Local progresses
toward energetic- 1 1 1
Evaluation neutrality
Annual local reports:
impact on local 1 1 1
development
WP4 PERFORMANCE
TO DATE VERY LOW
☺
48. Effectiveness Efficiency Potential Impacts Sustainability Value-for-money
Indicator 4 Indicator 5 Indicator 6 Indicator 7 Indicator 8 Indicator 9 Indicator 10 Indicator 11
1 1 1 1 1 1 1 1
1 1 1 1 1 1 1 1
1 1 1 1 1 1 1 1
1 1 1 1 1 1 1 1
1 1 1 1 1 1 1 1
1 1 1 1 1 1 1 1
1 1 1 1 1 1 1 1
1 1 1 1 1 1 1 1
50. Value-for-money Target Group Satisfaction
Indicator 12 Indicator 13 Indicator 14
Indicator 1
1 1 1
1 0.35 0 0
1 1 1
1 0.35 0 0
1 1 1
1 0.35 0 0
1 1 1
1 0.35 0 0
1 1 1
1 0.35 0 0
1 1 1
1 0.35 0 0
1 1 1
1 0.35 0 0
1 1 1
1 0.35 0 0
8 0 0 0.13
2.83 0
52. Indicator 2 Indicator 3 Indicator 4
1 0.35 0 0 1 0.35 0 0 1
1 0.35 0 0 1 0.35 0 0 1
1 0.35 0 0 1 0.35 0 0 1
1 0.35 0 0 1 0.35 0 0 1
1 0.35 0 0 1 0.35 0 0 1
1 0.35 0 0 1 0.35 0 0 1
1 0.35 0 0 1 0.35 0 0 1
1 0.35 0 0 1 0.35 0 0 1
8 0 0 8 0 0 8
2.83 0.13 0.13 2.83 0.13 2.83
54. Indicator 5 Indicator 6
0.35 0 0 1 0.35 0 0 1 0.35
0.35 0 0 1 0.35 0 0 1 0.35
0.35 0 0 1 0.35 0 0 1 0.35
0.35 0 0 1 0.35 0 0 1 0.35
0.35 0 0 1 0.35 0 0 1 0.35
0.35 0 0 1 0.35 0 0 1 0.35
0.35 0 0 1 0.35 0 0 1 0.35
0.35 0 0 1 0.35 0 0 1 0.35
0 0 8 0 0 8 0
0 2.83 0 2.83
56. Evaluating Member Normalized Decision Matrix
Indicator 7 Indicator 8
0 0 1 0.35 0 0 1 0.35 0
0 0 1 0.35 0 0 1 0.35 0
0 0 1 0.35 0 0 1 0.35 0
0 0 1 0.35 0 0 1 0.35 0
0 0 1 0.35 0 0 1 0.35 0
0 0 1 0.35 0 0 1 0.35 0
0 0 1 0.35 0 0 1 0.35 0
0 0 1 0.35 0 0 1 0.35 0
0 8 0 0 8 0 0
0 2.83 0 2.83 0
58. ecision Matrix
Indicator 9 Indicator 10
0 1 0.35 0 0 1 0.35 0 0
0 1 0.35 0 0 1 0.35 0 0
0 1 0.35 0 0 1 0.35 0 0
0 1 0.35 0 0 1 0.35 0 0
0 1 0.35 0 0 1 0.35 0 0
0 1 0.35 0 0 1 0.35 0 0
0 1 0.35 0 0 1 0.35 0 0
0 1 0.35 0 0 1 0.35 0 0
8 0 0 8 0 0
2.83 0 2.83 0
60. Indicator 11 Indicator 12 Indicator 13
1 0.35 0 0 1 0.35 0 0 1
1 0.35 0 0 1 0.35 0 0 1
1 0.35 0 0 1 0.35 0 0 1
1 0.35 0 0 1 0.35 0 0 1
1 0.35 0 0 1 0.35 0 0 1
1 0.35 0 0 1 0.35 0 0 1
1 0.35 0 0 1 0.35 0 0 1
1 0.35 0 0 1 0.35 0 0 1
8 0 0 8 0 0 8
2.83 0 2.83 0 2.83
62. Indicator 14
0.35 0 0 1 0.35 0 0
0.35 0 0 1 0.35 0 0
0.35 0 0 1 0.35 0 0
0.35 0 0 1 0.35 0 0
0.35 0 0 1 0.35 0 0
0.35 0 0 1 0.35 0 0
0.35 0 0 1 0.35 0 0
0.35 0 0 1 0.35 0 0
0 0 8 0 0 0
0 2.83 0
64. SEPARATION SEPARATION SUM
IDEAL TARGET ANTI-IDEAL MEASURE MEASURE ANTI- SEPARATION
VALUES VALUES IDEAL IDEAL MEASURES
0.354 0.354 0.000 0.000 0.000
0.354 0.354 0.000 0.000 0.000
0.354 0.354 0.000 0.000 0.000
0.354 0.354 0.000 0.000 0.000
0.354 0.354 0.000 0.000 0.000
0.354 0.354 0.000 0.000 0.000
0.354 0.354 0.000 0.000 0.000
0.354 0.354 0.000 0.000 0.000
0.354 0.354
0.354 0.354
0.354 0.354
65. 0.354 0.354
0.354 0.354
0.354 0.354
66. RELATIVE SUM INPUT
CLOSENESS TO THE INPUT ZERO
IDEAL RANGE VALUES
0.000 112 112
0.000
0.000
0.000
0.000
0.000
0.000
0.000
0.200
68. CRITERIA Relevance Effectiveness
INDICATORS Indicator 1 Indicator 2 Indicator 3
5. Training,
WP Name WP Task WP Task Actions
Communication
and
Dissemination
Printing and
Highlight best presenting members 1 1 1
practices fact sheets
1 1 1
Producing posters
Shooting video diary 1 1 1
of community
actions
Develop web
architecture,
functions and 1 1 1
Website and graphical
webtools composition
Ensure sustainable 1 1 1
updating
1 1 1
Translation
Producing practical
guidelines: how to
use the website,
how to find a 1 1 1
mentor, how to
share my
Guidelines experience...
Printing pedagogical
guidelines (produced 1 1 1
in WP2.2)
Training and
information national Training seminars 1 1 1
seminars for members
Participation in local
and national
exhibitions to 1 1 1
promote energetic
neutral communities
Other dissemination
and communication
1 1 1
activities at the local
level
Organisation of a 1 1 1
European event and common European
communication to event on innovative
European entities rural development
69. Communication 1 1 1
toward European
Parliament members
and DG Officers
WP5 PERFORMANCE
TO DATE VERY LOW
☺
70. Effectiveness Efficiency Potential Impacts Sustainability Value-for-money
Indicator 4 Indicator 5 Indicator 6 Indicator 7 Indicator 8 Indicator 9 Indicator 10 Indicator 11
1 1 1 1 1 1 1 1
1 1 1 1 1 1 1 1
1 1 1 1 1 1 1 1
1 1 1 1 1 1 1 1
1 1 1 1 1 1 1 1
1 1 1 1 1 1 1 1
1 1 1 1 1 1 1 1
1 1 1 1 1 1 1 1
1 1 1 1 1 1 1 1
1 1 1 1 1 1 1 1
1 1 1 1 1 1 1 1
1 1 1 1 1 1 1 1
72. Value-for-money Target Group Satisfaction
Indicator 12 Indicator 13 Indicator 14
Indicator 1
1 1 1
1 0.3 0
1 1 1
1 0.3 0
1 1 1
1 0.3 0
1 1 1
1 0.3 0
1 1 1
1 0.3 0
1 1 1
1 0.3 0
1 1 1
1 0.3 0
1 1 1
1 0.3 0
1 1 1
1 0.3 0
1 1 1
1 0.3 0
1 1 1
0.3 0
1 1 1
0.3 0
73. 1 1 1
1 0.3 0
11 0 0
3.32 0
74. Indicator 2 Indicator 3
0 1 0.28 0 0 1 0.28 0
0 1 0.28 0 0 1 0.28 0
0 1 0.28 0 0 1 0.28 0
0 1 0.28 0 0 1 0.28 0
0 1 0.28 0 0 1 0.28 0
0 1 0.28 0 0 1 0.28 0
0 1 0.28 0 0 1 0.28 0
0 1 0.28 0 0 1 0.28 0
0 1 0.28 0 0 1 0.28 0
0 1 0.28 0 0 1 0.28 0
0 1 0.28 0 0 1 0.28 0
0 1 0.28 0 0 1 0.28 0
75. 0 1 0.28 0 0 1 0.28 0
0.09 13 0 0 13 0 0
3.61 0 3.61 0
3
5
7
76. Indicator 4 Indicator 5
0 1 0.28 0 0 1 0.28 0 0
0 1 0.28 0 0 1 0.28 0 0
0 1 0.28 0 0 1 0.28 0 0
0 1 0.28 0 0 1 0.28 0 0
0 1 0.28 0 0 1 0.28 0 0
0 1 0.28 0 0 1 0.28 0 0
0 1 0.28 0 0 1 0.28 0 0
0 1 0.28 0 0 1 0.28 0 0
0 1 0.28 0 0 1 0.28 0 0
0 1 0.28 0 0 1 0.28 0 0
0 1 0.28 0 0 1 0.28 0 0
0 1 0.28 0 0 1 0.28 0 0
77. 0 1 0.28 0 0 1 0.28 0 0
13 0 0.01 13 0 0.01
3.61 0.09 3.61 0.09
7
78. Evaluating Member Normalized Decisio
Indicator 6 Indicator 7 Indicator 8
1 0.28 0 0 1 0.28 0 0 1
1 0.28 0 0 1 0.28 0 0 1
1 0.28 0 0 1 0.28 0 0 1
1 0.28 0 0 1 0.28 0 0 1
1 0.28 0 0 1 0.28 0 0 1
1 0.28 0 0 1 0.28 0 0 1
1 0.28 0 0 1 0.28 0 0 1
1 0.28 0 0 1 0.28 0 0 1
1 0.28 0 0 1 0.28 0 0 1
1 0.28 0 0 1 0.28 0 0 1
1 0.28 0 0 1 0.28 0 0 1
1 0.28 0 0 1 0.28 0 0 1
79. 1 0.28 0 0 1 0.28 0 0 1
13 0 0.01 13 0 0.01 13
3.61 0.09 3.61 0.09 3.61
16 0
80. alized Decision Matrix
Indicator 9 Indicator 10
0.28 0 0 1 0.28 0 0 1 0.28
0.28 0 0 1 0.28 0 0 1 0.28
0.28 0 0 1 0.28 0 0 1 0.28
0.28 0 0 1 0.28 0 0 1 0.28
0.28 0 0 1 0.28 0 0 1 0.28
0.28 0 0 1 0.28 0 0 1 0.28
0.28 0 0 1 0.28 0 0 1 0.28
0.28 0 0 1 0.28 0 0 1 0.28
0.28 0 0 1 0.28 0 0 1 0.28
0.28 0 0 1 0.28 0 0 1 0.28
0.28 0 0 1 0.28 0 0 1 0.28
0.28 0 0 1 0.28 0 0 1 0.28
81. 0.28 0 0 1 0.28 0 0 1 0.28
0 0.01 13 0 0.01 13 0
0.09 3.61 0.09 3.61
82. Indicator 11 Indicator 12
0 0 1 0.28 0 0 1 0.28
0 0 1 0.28 0 0 1 0.28
0 0 1 0.28 0 0 1 0.28
0 0 1 0.28 0 0 1 0.28
0 0 1 0.28 0 0 1 0.28
0 0 1 0.28 0 0 1 0.28
0 0 1 0.28 0 0 1 0.28
0 0 1 0.28 0 0 1 0.28
0 0 1 0.28 0 0 1 0.28
0 0 1 0.28 0 0 1 0.28
0 0 1 0.28 0 0 1 0.28
0 0 1 0.28 0 0 1 0.28
83. 0 0 1 0.28 0 0 1 0.28
0.01 13 0 0.01 13 0
0.09 3.61 0.09 3.61
84. Indicator 13 Indicator 14
0 0 1 0.28 0 0 1 0.28 0
0 0 1 0.28 0 0 1 0.28 0
0 0 1 0.28 0 0 1 0.28 0
0 0 1 0.28 0 0 1 0.28 0
0 0 1 0.28 0 0 1 0.28 0
0 0 1 0.28 0 0 1 0.28 0
0 0 1 0.28 0 0 1 0.28 0
0 0 1 0.28 0 0 1 0.28 0
0 0 1 0.28 0 0 1 0.28 0
0 0 1 0.28 0 0 1 0.28 0
0 0 1 0.28 0 0 1 0.28 0
0 0 1 0.28 0 0 1 0.28 0
85. 0 0 1 0.28 0 0 1 0.28 0
0.01 13 0 0.01 13 0 0.01
0.09 3.61 0.09 3.61 0.09
86. SEPARATION SEPARATION
IDEAL TARGET ANTI-IDEAL MEASURE MEASURE
VALUES VALUES IDEAL ANTI-IDEAL
0 0.302 0.302 0.080 0.080
0 0.277 0.277 0.080 0.080
0 0.277 0.277 0.080 0.080
0 0.277 0.277 0.080 0.080
0 0.277 0.277 0.080 0.080
0 0.277 0.277 0.080 0.080
0 0.277 0.277 0.080 0.080
0 0.277 0.277 0.080 0.080
0 0.277 0.277 0.080 0.080
0 0.277 0.277 0.080 0.080
0 0.277 0.277 0.080 0.080
0 0.277 0.277 0.080 0.080
87. 0 0.277 0.277 0.080 0.080
0 0.277 0.277
88. SUM RELATIVE SUM INPUT
SEPARATION CLOSENESS TO INPUT ZERO
MEASURES THE IDEAL RANGE VALUES
0.160 0.500 182 182
0.160 0.500
0.160 0.500
0.160 0.500
0.160 0.500
0.160 0.500
0.160 0.500
0.160 0.500
0.160 0.500
0.160 0.500
0.160 0.500
0.160 0.500
90. CRITERIA Relevance Effectiveness
INDICATORS Indicator 1 Indicator 2 Indicator 3
WP Task
WP Name WP Task Actions
6. Common
Dissemination
Activities
Creation and regular
update of RURENER
1 1 1
information for IEE online
information systems (one
update after each
progress and intermediate
report)
Contribution, upon
request by the EACI, to the
development of additional 1 1 1
information material
(Intelligent Energy News
Review, videos, images
etc.) in the quality and
format specified
Participation and/or
contribution, to
information and
dissemination events 1 1 1
(contractors’ workshops,
conferences, briefing
days, exhibitions, etc.)
related to IEE or other
relevant EU programmes
WP6 PERFORMANCE
TO DATE VERY LOW☺
92. Effectiveness Efficiency Potential Impacts Sustainability Value-for-money
Indicator 4 Indicator 5 Indicator 6 Indicator 7 Indicator 8 Indicator 9 Indicator 10 Indicator 11
1 1 1 1 1 1 1 1
1 1 1 1 1 1 1 1
1 1 1 1 1 1 1 1
94. Value-for-money Target Group Satisfaction
Indicator 12 Indicator 13 Indicator 14
Indicator 1
1 1 1
1 0.58 0 0
1 1 1
1 0.58 0 0
1 1 1
1 0.58 0 0
3 0 0
1.73 0
96. Indicator 2 Indicator 3 Indicator 4
1 0.58 0 0 1 0.58 0 0 1
1 0.58 0 0 1 0.58 0 0 1
1 0.58 0 0 1 0.58 0 0 1
3 0 0 3 0 0 3
1.73 0 1.73 0 1.73
98. Indicator 5 Indicator 6
0.58 0 0 1 0.58 0 0 1 0.58
0.58 0 0 1 0.58 0 0 1 0.58
0.58 0 0 1 0.58 0 0 1 0.58
0 0 3 0 0 3 0
0 1.73 0 1.73
100. Evaluating Member Normalized Decision Matrix
Indicator 7 Indicator 8
0 0 1 0.58 0 0 1 0.58 0
0 0 1 0.58 0 0 1 0.58 0
0 0 1 0.58 0 0 1 0.58 0
0 3 0 0 3 0 0
0 1.73 0 1.73 0
102. ecision Matrix
Indicator 9 Indicator 10
0 1 0.58 0 0 1 0.58 0 0
0 1 0.58 0 0 1 0.58 0 0
0 1 0.58 0 0 1 0.58 0 0
3 0 0 3 0 0
1.73 0 1.73 0
104. Indicator 11 Indicator 12 Indicator 13
1 0.58 0 0 1 0.58 0 0 1
1 0.58 0 0 1 0.58 0 0 1
1 0.58 0 0 1 0.58 0 0 1
3 0 0 3 0 0 3
1.73 0 1.73 0 1.73
106. Indicator 14
0.58 0 0 1 0.58 0 0
0.58 0 0 1 0.58 0 0
0.58 0 0 1 0.58 0 0
0 0 3 0 0 0
0 1.73 0
108. SEPARATION SEPARATION SUM
IDEAL TARGET ANTI-IDEAL MEASURE MEASURE ANTI- SEPARATION
VALUES VALUES IDEAL IDEAL MEASURES
0.577 0.577 0.000 0.000 0.000
0.577 0.577 0.000 0.000 0.000
0.577 0.577 0.000 0.000 0.000
0.577 0.577
0.577 0.577
109. 0.577 0.577
0.577 0.577
0.577 0.577
0.577 0.577
0.577 0.577
0.577 0.577
0.577 0.577
0.577 0.577
0.577 0.577
110. RELATIVE SUM
CLOSENESS TO INPUT INPUT ZERO
THE IDEAL RANGE VALUES
0.000 42 42
0.000
0.000
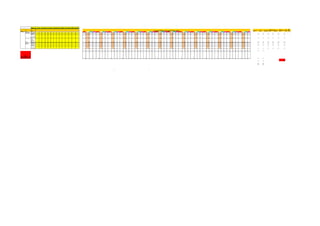
112. RURENER Performance per Workpackage
WP1- Management 0.200
1.00
0.200
WP2-Opportunities and methods toward energetic- neutral villages
0.200
WP3- A Network to enhance energetic-neutral communities
0.200
WP4- Concrete local actions in energetic-neutral communities
0.200
WP5-Training, Communication and Dissemination
0.200 0.80
WP6-Common Dissemination Activities
0.200
0.60
RURENER
PERFORMANCE
TO DATE VERY 0.40
LOW ☺
0.20
0.00
WP
113. orkpackage RURENER Performance per Workpackage
1.00
0.80
0.60
0.40
0.20
0.00
WP3- A Network to enhance energetic-neutral communities
WP1- Management WP5-Training, Communic