Mixin Classes in Odoo 17 How to Extend Models Using Mixin Classes
Visio Tutorial
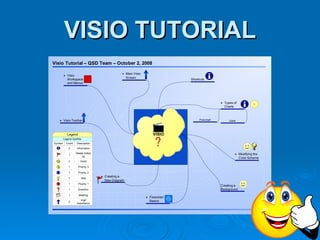
1. VISIO TUTORIAL
Visio Tutorial – QSD Team – October 2, 2008
· Main Visio
· Visio
Screen
Workspace 1 Shortcuts
and Menus
· Types of 3
Charts
· Visio Toolbar Flowchart Gantt
Legend VISIO
Legend Subtitle
Symbol Count Description
2 Information
Needs follow · Modifying the
1
up
Color Scheme
2 Good
1 Priority 3
1 Priority 2
· Creating a
1 Idea
New Diagram
1 Priority 1
Creating a
1 Question Background
1 Meeting
· Flowchart 2
High Basics
2
importance
Page 1
2. Outline
Main Visio Screen Creating a Background
Visio Workspace and Menus Modifying the Color Scheme
Visio Toolbar Adding a Hyperlink
Creating a New Diagram Using Your Visio Drawing
Align Shapes Types of Charts
Adding and Modifying Text Flowchart
Adding Additional Shapes Cross Functional Flowchart
Flowchart Basics Fishbone
Process
Gantt Chart
Decision
Timeline
Terminator
Brainstorming
Document Shortcuts
On Page Reference Resources
Off Page Reference
3. Getting Started in Visio
When you open Visio you see options such as Business
Process under Category and Basic Flowchart under
Template.
The toolbars across the top of the screen are similar to
other Microsoft programs such as Word and PowerPoint.
Unique functions are found throughout (the Shape menu
item is unique to Visio).
5. Visio Workspace and Menus
The left side of the screen shows menus specific to the
type of diagram you are creating.
For a Flowchart you will see Arrow Shapes, Backgrounds, Basic
Flowchart Shapes, Borders and Titles.
The center of the screen shows the diagram workspace.
The top menu changes depending on the diagram type,
eg. a Gantt Chart has a top menu item called Timeline.
8. Creating a New Diagram
To start a new diagram, drag and drop a shape from the
shapes menu.
If you the click the connector tool, Visio will automatically
add arrows between shapes as you add to your diagram.
As long as that connector tool is highlighted, Visio will
continue to add arrows in between the shapes.
Visio allows you to change the size or
placement of a shape, and the connector still remains
intact.
If you have left out a shape, click on the shape
you would like to add, drag it, and hover over
the connector you would like to place it on,
and you will see the scissors icon appear.
Drop the shape and it fits in easily.
11. Adding and Modifying Text
To add text to your diagram and format that text:
Begin by double-clicking on the shape and adding your text.
What you will notice is that the format, the default format, for
Visio is Arial 8 point font.
That may or may not be what you want to stick with. You can go
ahead and change the format.
But the most efficient way to do this is to enter all of your text
and then go back and format it all at once.
Select your first shape that you want to change the font,
hold down the shift key, and click on all of the other
shapes that you wish to reformat. Or use the Pointer
tool to select a number of boxes at once.
Go up to the toolbar, pick the font and size.
13. Flowchart Basics
Process Block
You can use this shape to
describe “processes”, which can
be defined for our purposes as a
certain action being taken. Some
examples of a process could be:
• Performing a calculation, such as
“Calculate the average of all the
sales”.
• A group taking an action, such as
“The Product Test group validates
the software modules”.
• A generic action, such as
“Document is placed in the tray”.
These are normally the building
blocks of your Visio diagrams.
14. Flowchart Basics
Decision Symbol
As the name implies, you would use this
symbol to branch out your diagram
based on a decision that is made. You
can think of this as an “If” statement (for
those familiar with programming
concepts).
There are two basic ways to use this
symbol:
• Yes/No Path - This has two outcomes,
Yes or No. An example would be “Is the
average greater than 0?”.
• Multiple Path - The flow can go multiple
ways based on the outcome. For
example, if could you “Choose location
to check”, and then each location could
be a path.
• The key here is to make sure you label
each path, even if it is with a “Yes” or a
“No”. Otherwise, you won’t be able to
navigate your diagram.
15. Flowchart Basics
Terminator Symbol
This is what you use when you
want to end or start your
diagram. Normally, you would
have one at the beginning and
one at the end. Make sure to
give them descriptive names.
If your diagram can end in
many places, put a terminator
at each place it can end.
This also works if you have
multiple beginning points, but
this is less common.
16. Flowchart Basics
Document Symbol
Pretty obvious explanation
here, but you might find
yourself using it a lot. If you
have any kind of document
that you are trying to represent
in your diagram, you should
use this symbol.
For instance, if the input to
your process is a file, it would
be represented by this symbol.
Another example
would be if the
output of your
process is a file.
17. Flowchart Basics
On Page Reference
This should be used if you need to
“jump” back to another part of your
process in a different part of the
diagram, but can’t connect them
using a standard connector. Also,
this can be used to modularize
your diagram.
An important point is that these
symbols work in pairs, like two
ends of a connector. The key is to
label them both the same thing so
that you know which
reference goes
where. Use
descriptive text like
“Determine customer
payment information
function”.
18. Flowchart Basics
Off Page Reference
Use this when what you are
referencing is on a different page
than the symbol. Using an
example above, if you were to
have repeatable functions in your
diagram, you might just have one
page where the details for it reside
and then use this reference when
you want people to skip to it. This
way you don’t have to repeat the
same set of symbols multiple
times in your diagram. This also
creates a cleaner, less cluttered
diagram.
19. Creating a Background
Visio provides several standard backgrounds which you
can add to your diagram.
From the menu on the left side of the screen, click on
backgrounds, select a design that you like, drag, and
drop.
Visio automatically fits the background to the existing
diagram. Visio has also added a tab at the bottom of your
screen labelled quot;backgroundquot;.
Your existing work is on page one. For the most part,
you'll be working with page one, but you always have the
option to add content to the background page as well.
The important thing to remember is that whichever page
you add content to is the page on which you will need to
edit that content.
21. Modifying the Color Scheme
The most efficient way to add color to your drawing is to
use the color scheme functionality, which will change your
shapes, background, and text all at once.
Right-click on your workspace, select color schemes, and
select a scheme from the menu. Press apply to see if you
like it, and just play around until you find one that you like.
Sometimes you need to change the color of one or two
shapes for impact.
To do this, select the shape you wish to change,
then click on the paint bucket tool and select
a color.
To create a custom colour, click on more fill
colours.
25. Adding a Hyperlink
You may want to add a hyperlink to your diagram.
To do that, click on the left menu Borders and Titles, go all
the way down to the bottom, select a hyperlink icon, drag
and drop into your shape, and the hyperlink dialog box will
appear. Or use CTRL K.
Type in your URL, click on okay, and your hyperlink has
been inserted.
You can link to a web site or to a document on
Connections
27. Using Your Visio Drawing
Once you've completed your Visio drawing, it
can be printed out just like any other Microsoft
document.
From the toolbar select file and print.
To print poster size (11 x 17) with the colour
Xerox:
In Print select Properties
In Paper/Output, change the paper to 11 x 17
In Image Options, enlarge 129%
(may need to adjust for your margins)
29. Using Your Visio Drawing
Visio drawings can also be inserted into other Microsoft
Office documents such as PowerPoint or Word.
To do this, go to your toolbar, select edit,
and copy drawing. Then go to your
PowerPoint or Word document.
Select where you would like to insert your
Visio diagram, and click edit, paste.
The Visio diagram can be edited within
other Microsoft Office applications:
To change your drawing, double-click on it while still in
PowerPoint, and Visio will open up within PowerPoint and you
can make your changes.
39. Shortcuts
CTRL S – save CTRL B – bold
CTRL P – print CTRL I – italics
CTRL C – copy CTRL U – underline
CTRL X – cut CTRL L – rotate left
CTRL V – paste
CTRL R – rotate right
CTRL A – select all
CTRL Z – undo
CTRL G – group
CTRL K – add a selected objects
hyperlink
These shortcuts also work in Word, Excel & PowerPoint
40. Resources
Templates and tutorial on Connections in QSD
Workspace
Getting Started Tutorial in Visio Help
Diagram Gallery in Visio Help
Visio 2003 training courses on microsoft.com