SlideShare ist ein Scribd-Unternehmen logo
1 von 4
Homeostasis lab                                     Name
_______________________________________

Objectives: observe how an animal responds to environmental stimulus to achieve homeostasis, relate
cellular respiration to respiratory rate

Background            Recall that living organisms perform cellular respiration
                             glucose + oxygen  carbon dioxide + water
in order to repackage energy stored in glucose into ATP molecules. ATPs each hold less energy than
a glucose molecule and are able to fuel cell work directly. Animals can obtain glucose through
consumption of food and oxygen through inhalation. Waste carbon dioxide is exhaled; water can be
excreted or used. If more cellular work is required by the organism, then more ATPs must be
manufactured; thus, more cellular respiration must occur. Therefore, more breathing must also occur to
meet the oxygen demand and remove the waste.

Stimuli from inside and outside the organism require the organism to respond in order to maintain
homeostasis. The internal stimulus of high carbon dioxide in the blood, for example, is sensed by the
brain, which responds by increasing the breathing (exhalation) rate. In this lab, we’ll examine an
external stimulus that indirectly affects breathing rate. As the environmental temperature of the mice
changes, the mice have to do cellular work to maintain a constant body temperature just like you have
to maintain a temperature of 37°C.

Predict what will happen to the amount of cellular work (metabolic rate) the mouse will have to do as we
lower its environmental temperature. Explain your prediction.


Why should that response to the cold then affect the mouse’s breathing rate?


Consider the data in the graph to the right (for some unknown
small mammal). Is there a correlation between the two
variables? Does the change in one variable cause the change
in the other? Explain.       Cup to
                            restrict
                            mouse’s
                           movement
                               s

    oxygen                Wire cage with
       CO2                 stoppers on
                            both ends
                                                                                                         1
Method                  There are two types of chambers we will use: wire cages and plastic
environmental chambers. You will find some plastic chambers already immersed in ice in the lab –
please do not remove them. We only move the wire cages. You will also find mice in wire cages –
there is no need for you to handle the mice (they bite and poop!). Be sure there is a little plastic cup in
the wire cage to restrict the movement of the mouse, but don’t squish the mouse. Also be sure the end
caps are on both ends of the wire cage tightly.

First, put your mouse’s cage inside the plastic chamber at room temperature. Let him adjust for about
5 min. Meanwhile, change the experiment time on the computer to 700 seconds by clicking
Experiment, then Data Collection, then change the time to 700 s. As soon as you seal the mouse’s
chamber with the stopper, press the data collection button on the computer to record the amount of
oxygen in the chamber. Collect data for 10 minutes – the software measures this time in seconds (s).
Ignore the readings for the first 100 s; the mouse is adjusting to its new environment. Note the % O2 at
100 s. Describe the trend in the data, recording the initial (100 s) O2 and final (700 s) O2 amounts
(recorded as % O2 in the air). Record your data (don’t forget temperature) in the data table.

Second, put your mouse’s cage inside the plastic chamber in the ice chest. Let the mouse acclimate
for a couple of minutes – no longer than 5. As soon as you seal the chamber with the stopper, press
the data collection button on the computer to record the amount of oxygen in the chamber. Collect data
for 10 minutes. Ignore the first 100 s again; the mouse is adjusting to its new environment. Note the %
O2 at 100 s and the temperature at 700 s. Remove the mouse’s cage from the ice. Describe the trend
in the data, recording the starting (at 100 s) O2, final (at 700 s) O2, and temperature at 700 s. Record
your data in the data table.

Data
          Temperature °C     % O2 at    Final            % O2           % O2           Briefly
                             100 s      % O2 at      decreased       decreased       describe the
                                        700 s         in 10 min.      in 1 min.         trend

room
temp.


 mice
on ice!


                                                                                                          2
Oxygen and
                                                             temperature
                                                           sensors sending
                                                               results to
                                                               computer
                                 Cup to
                                 restrict
                                 mouse’s
                                movement
                                    s

        oxygen                 Wire cage with
           CO2                  stoppers on
                                 both ends


                                 Plastic chamber with
                                    stopper and O2
                                 sensors on open end


Before leaving lab, be sure that your results are comparable to those of the other students in lab. Are
there large discrepancies? If so, what might explain them?


Postlab – Be sure to use the GROUP data posted on Bb, not your own data

Do the data support your prediction on p. 1? Explain briefly.


Why did the mice respond to colder temperatures the way they did? Explain in terms of breathing rate
and cellular respiration rate.


                                                                                                          3
Did the mice exhibit negative or positive feedback to maintain homeostasis? Explain.


What do you think would happen if we had increased the temperature above room temperature?
Explain.


Why does the presence of the mouse reduce the % of O2 in the air in the chamber? What is replacing
the O2? Why?


You noted differences between your data and others’ data in lab. What is a source of natural variation
in the data? Explain.


What is a source of experimental variation in the data? Explain.


                                                                                                         4

Weitere ähnliche Inhalte

Ähnlich wie 1 mouse homeostasis lab

How Tube 3 Changed Colors Into An Orange-Brown
How Tube 3 Changed Colors Into An Orange-BrownHow Tube 3 Changed Colors Into An Orange-Brown
How Tube 3 Changed Colors Into An Orange-BrownLisa Olive
 
Lab 3 Primary Productivity in Water.docx
Lab 3 Primary Productivity in Water.docxLab 3 Primary Productivity in Water.docx
Lab 3 Primary Productivity in Water.docxwrite22
 
Bio 102 – City College of New York – Biology Dept.Experiment 2
Bio 102 – City College of New York – Biology Dept.Experiment 2Bio 102 – City College of New York – Biology Dept.Experiment 2
Bio 102 – City College of New York – Biology Dept.Experiment 2ChantellPantoja184
 
Optimization of Adol Adduct
Optimization of Adol AdductOptimization of Adol Adduct
Optimization of Adol AdductDan Betts
 
Lab review
Lab reviewLab review
Lab reviewktanaka2
 
Lab review
Lab reviewLab review
Lab reviewktanaka2
 
Investigation04 en
Investigation04 enInvestigation04 en
Investigation04 enmcnewbold
 
lesson7-1The KineticTheory of gases
lesson7-1The  KineticTheory of gaseslesson7-1The  KineticTheory of gases
lesson7-1The KineticTheory of gasesPau Fong Yong
 

Ähnlich wie 1 mouse homeostasis lab (15)

How Tube 3 Changed Colors Into An Orange-Brown
How Tube 3 Changed Colors Into An Orange-BrownHow Tube 3 Changed Colors Into An Orange-Brown
How Tube 3 Changed Colors Into An Orange-Brown
 
Lab 3 Primary Productivity in Water.docx
Lab 3 Primary Productivity in Water.docxLab 3 Primary Productivity in Water.docx
Lab 3 Primary Productivity in Water.docx
 
Bio 102 – City College of New York – Biology Dept.Experiment 2
Bio 102 – City College of New York – Biology Dept.Experiment 2Bio 102 – City College of New York – Biology Dept.Experiment 2
Bio 102 – City College of New York – Biology Dept.Experiment 2
 
Optimization of Adol Adduct
Optimization of Adol AdductOptimization of Adol Adduct
Optimization of Adol Adduct
 
Data logging new
Data logging newData logging new
Data logging new
 
Data logging
Data loggingData logging
Data logging
 
Data logging new
Data logging newData logging new
Data logging new
 
Data logging
Data loggingData logging
Data logging
 
Lab review
Lab reviewLab review
Lab review
 
Lab review
Lab reviewLab review
Lab review
 
Biology Lab Report 1
Biology Lab Report 1Biology Lab Report 1
Biology Lab Report 1
 
Investigation04 en
Investigation04 enInvestigation04 en
Investigation04 en
 
Data logging pre(1)
Data logging pre(1)Data logging pre(1)
Data logging pre(1)
 
lesson7-1The KineticTheory of gases
lesson7-1The  KineticTheory of gaseslesson7-1The  KineticTheory of gases
lesson7-1The KineticTheory of gases
 
Heat and temperature
Heat and temperatureHeat and temperature
Heat and temperature
 

Mehr von lvilleDrFox

Pineapple design results
Pineapple design resultsPineapple design results
Pineapple design resultslvilleDrFox
 
7 text homework 5
7 text homework 57 text homework 5
7 text homework 5lvilleDrFox
 
15 a life without fear
15 a life without fear15 a life without fear
15 a life without fearlvilleDrFox
 
Translation mutation ppt
Translation mutation pptTranslation mutation ppt
Translation mutation pptlvilleDrFox
 
03 transcribe and translate a gene (1)
03 transcribe and translate a gene (1)03 transcribe and translate a gene (1)
03 transcribe and translate a gene (1)lvilleDrFox
 
Central dogma transcription only
Central dogma transcription onlyCentral dogma transcription only
Central dogma transcription onlylvilleDrFox
 
Dna rtt packet comprehensive (1 3 to start)
Dna rtt packet comprehensive (1 3 to start)Dna rtt packet comprehensive (1 3 to start)
Dna rtt packet comprehensive (1 3 to start)lvilleDrFox
 
3 major experiments in confirming dna is the genetic material
3 major experiments in confirming dna is the genetic material3 major experiments in confirming dna is the genetic material
3 major experiments in confirming dna is the genetic materiallvilleDrFox
 
5 hw exercise nty
5 hw exercise nty5 hw exercise nty
5 hw exercise ntylvilleDrFox
 
4 vital signs lab
4 vital signs lab4 vital signs lab
4 vital signs lablvilleDrFox
 
Breathing reading from how stuff works
Breathing reading from how stuff worksBreathing reading from how stuff works
Breathing reading from how stuff workslvilleDrFox
 

Mehr von lvilleDrFox (13)

Pineapple design results
Pineapple design resultsPineapple design results
Pineapple design results
 
7 text homework 5
7 text homework 57 text homework 5
7 text homework 5
 
15 a life without fear
15 a life without fear15 a life without fear
15 a life without fear
 
Stathmin gene
Stathmin geneStathmin gene
Stathmin gene
 
Translation mutation ppt
Translation mutation pptTranslation mutation ppt
Translation mutation ppt
 
03 transcribe and translate a gene (1)
03 transcribe and translate a gene (1)03 transcribe and translate a gene (1)
03 transcribe and translate a gene (1)
 
Central dogma transcription only
Central dogma transcription onlyCentral dogma transcription only
Central dogma transcription only
 
Dna rtt packet comprehensive (1 3 to start)
Dna rtt packet comprehensive (1 3 to start)Dna rtt packet comprehensive (1 3 to start)
Dna rtt packet comprehensive (1 3 to start)
 
3 major experiments in confirming dna is the genetic material
3 major experiments in confirming dna is the genetic material3 major experiments in confirming dna is the genetic material
3 major experiments in confirming dna is the genetic material
 
5 hw exercise nty
5 hw exercise nty5 hw exercise nty
5 hw exercise nty
 
4 vital signs lab
4 vital signs lab4 vital signs lab
4 vital signs lab
 
Mouse data new
Mouse data newMouse data new
Mouse data new
 
Breathing reading from how stuff works
Breathing reading from how stuff worksBreathing reading from how stuff works
Breathing reading from how stuff works
 

1 mouse homeostasis lab

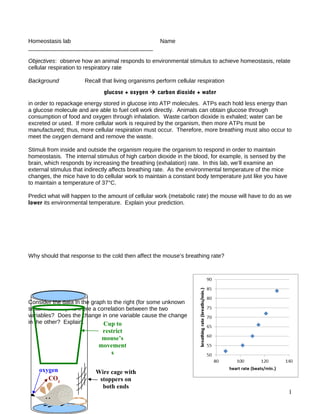
  • 1. Homeostasis lab Name _______________________________________ Objectives: observe how an animal responds to environmental stimulus to achieve homeostasis, relate cellular respiration to respiratory rate Background Recall that living organisms perform cellular respiration glucose + oxygen  carbon dioxide + water in order to repackage energy stored in glucose into ATP molecules. ATPs each hold less energy than a glucose molecule and are able to fuel cell work directly. Animals can obtain glucose through consumption of food and oxygen through inhalation. Waste carbon dioxide is exhaled; water can be excreted or used. If more cellular work is required by the organism, then more ATPs must be manufactured; thus, more cellular respiration must occur. Therefore, more breathing must also occur to meet the oxygen demand and remove the waste. Stimuli from inside and outside the organism require the organism to respond in order to maintain homeostasis. The internal stimulus of high carbon dioxide in the blood, for example, is sensed by the brain, which responds by increasing the breathing (exhalation) rate. In this lab, we’ll examine an external stimulus that indirectly affects breathing rate. As the environmental temperature of the mice changes, the mice have to do cellular work to maintain a constant body temperature just like you have to maintain a temperature of 37°C. Predict what will happen to the amount of cellular work (metabolic rate) the mouse will have to do as we lower its environmental temperature. Explain your prediction. Why should that response to the cold then affect the mouse’s breathing rate? Consider the data in the graph to the right (for some unknown small mammal). Is there a correlation between the two variables? Does the change in one variable cause the change in the other? Explain. Cup to restrict mouse’s movement s oxygen Wire cage with CO2 stoppers on both ends 1
  • 2. Method There are two types of chambers we will use: wire cages and plastic environmental chambers. You will find some plastic chambers already immersed in ice in the lab – please do not remove them. We only move the wire cages. You will also find mice in wire cages – there is no need for you to handle the mice (they bite and poop!). Be sure there is a little plastic cup in the wire cage to restrict the movement of the mouse, but don’t squish the mouse. Also be sure the end caps are on both ends of the wire cage tightly. First, put your mouse’s cage inside the plastic chamber at room temperature. Let him adjust for about 5 min. Meanwhile, change the experiment time on the computer to 700 seconds by clicking Experiment, then Data Collection, then change the time to 700 s. As soon as you seal the mouse’s chamber with the stopper, press the data collection button on the computer to record the amount of oxygen in the chamber. Collect data for 10 minutes – the software measures this time in seconds (s). Ignore the readings for the first 100 s; the mouse is adjusting to its new environment. Note the % O2 at 100 s. Describe the trend in the data, recording the initial (100 s) O2 and final (700 s) O2 amounts (recorded as % O2 in the air). Record your data (don’t forget temperature) in the data table. Second, put your mouse’s cage inside the plastic chamber in the ice chest. Let the mouse acclimate for a couple of minutes – no longer than 5. As soon as you seal the chamber with the stopper, press the data collection button on the computer to record the amount of oxygen in the chamber. Collect data for 10 minutes. Ignore the first 100 s again; the mouse is adjusting to its new environment. Note the % O2 at 100 s and the temperature at 700 s. Remove the mouse’s cage from the ice. Describe the trend in the data, recording the starting (at 100 s) O2, final (at 700 s) O2, and temperature at 700 s. Record your data in the data table. Data Temperature °C % O2 at Final % O2 % O2 Briefly 100 s % O2 at decreased decreased describe the 700 s in 10 min. in 1 min. trend room temp. mice on ice! 2
  • 3. Oxygen and temperature sensors sending results to computer Cup to restrict mouse’s movement s oxygen Wire cage with CO2 stoppers on both ends Plastic chamber with stopper and O2 sensors on open end Before leaving lab, be sure that your results are comparable to those of the other students in lab. Are there large discrepancies? If so, what might explain them? Postlab – Be sure to use the GROUP data posted on Bb, not your own data Do the data support your prediction on p. 1? Explain briefly. Why did the mice respond to colder temperatures the way they did? Explain in terms of breathing rate and cellular respiration rate. 3
  • 4. Did the mice exhibit negative or positive feedback to maintain homeostasis? Explain. What do you think would happen if we had increased the temperature above room temperature? Explain. Why does the presence of the mouse reduce the % of O2 in the air in the chamber? What is replacing the O2? Why? You noted differences between your data and others’ data in lab. What is a source of natural variation in the data? Explain. What is a source of experimental variation in the data? Explain. 4