SlideShare ist ein Scribd-Unternehmen logo
1 von 9
Downloaden Sie, um offline zu lesen
For email subscription, click here to register: http://www.fas.usda.gov/data/coffee-world-markets-and-trade
__________________________________________________________________________________________________
Approved by the World Agricultural Outlook Board/USDA
United States
Department of
Agriculture
Foreign
Agricultural
Service
June 2016
World Arabica Production Ratio Forecast to Rebound
35%
40%
45%
50%
55%
60%
65%
08/09 09/10 10/11 11/12 12/13 13/14 14/15 15/16 16/17
PercentofTotalProduction
Arabica Robusta
2016/17 Forecast Overview
World coffee production for 2016/17 is
forecast to rise 2.4 million bags from the
previous year to 155.7 million bags (60
kilograms) as record Arabica output in
Brazil more than offsets lower Robusta
production in Brazil, Vietnam, and
Indonesia. As a result, world Arabica
output is expected to rebound to 60
percent of total production after being
below this level the previous 5 years.
Global consumption is forecast at a
record 150.8 million bags, drawing
ending inventories to a 4-year low.
World exports are expected to slip from
last year’s record primarily due to lower
shipments from Indonesia, Vietnam, and
Brazil.
Brazil’s Arabica production is forecast
to jump 7.8 million bags to a record 43.9
million as yields improve. Good
blossoming between September and
November 2015 was followed by ideal
weather during the fruit-set and fruit
development period in Minas Gerais and
Sao Paulo, two regions that account for
about 80 percent of output. Robusta
production is expected to drop 1.2
million bags to a 7-year low of 12.1
million due to above-average
temperatures and prolonged dry spells in
Espirito Santo, where the vast majority is
grown. Water shortages continue to
limit irrigation, a common practice in the
state. The combined Arabica and
Robusta harvest is forecast to expand 6.6 million bags to 56.0 million. However, with slightly reduced
total supplies due to lower beginning stocks, bean exports are expected to slip 700,000 bags to 32.0
million and ending stocks are forecast nearly unchanged at 2.5 million bags.
Coffee: World Markets and Trade
Brazil’s Arabica Production Forecast at Record, Robusta to Drop Again
-
10
20
30
40
50
09/10 10/11 11/12 12/13 13/14 14/15 15/16 16/17
Million60KilogramBags
Arabica Robusta
Vietnam’s production is forecast to decline
2.0 million bags to 27.3 million as high
temperatures combined with dry growing
conditions between January and April 2016
to weaken yields. Cultivated area is
forecast nearly equal to last year, and over
95 percent of total output is Robusta.
Following 2 years of elevated inventories,
ending stocks are expected to fall 2.2
million bags to 3.5 million, and bean
exports are forecast 850,000 bags lower to
25.2 million.
Colombia’s Arabica production is forecast
down 300,000 bags to 13.3 million due to
expected heavy rains towards the end of
2016. This will likely affect the mitaca crop by disrupting the flowering process as well as creating
conditions conducive to the spread of coffee rust for trees not renovated to resistant varieties. The mitaca
crop typically accounts for about 40 percent of total output and is harvested from the central coffee region
between April and June. Also, coffee cherry borer insect infestations in this region are expected to more
than double to 10 percent of planted area, reducing yields and quality. Despite this, bean exports, mostly
to the United States and Europe, are forecast to gain 100,000 bags to 11.5 million.
Central America and Mexico account for
over 15 percent of the world’s Arabica
production, and coffee rust continues to
hamper output for most of these countries.
Although the region’s production is forecast to
add 400,000 bags to total 15.9 million, the
rebound is mostly limited to Honduras where
rust-resistant trees from recently renovated
land are expected to propel output to a record
6.1 million bags. Nicaragua is forecast
100,000 bags higher to 2.1 million as a result
of good weather during bloom as well as the
addition of output from recently renovated
land. Costa Rica, El Salvador, Guatemala, and
Mexico are flat at 1.4 million bags, 525,000
bags, 3.4 million bags, and 2.3 million bags,
respectively, as these countries continue to struggle with rust and output remains below their pre-rust
level. Bean exports for the region are forecast to gain 400,000 bags to 13.3 million mainly due to higher
exportable supplies in Honduras. Approximately 40 percent of the region’s exports are destined for the
United States, followed by 35 percent to the European Union.
Indonesia’s production is forecast to drop 1.8 million bags to 10.0 million due to severe drought
throughout much of the archipelago. Dry weather disrupted the flowering and ripening stage of cherry
formation and was most acutely felt in lowland areas of Southern Sumatra and Java where approximately
75 percent of the Robusta crop is grown. Arabica production, situated in Northern Sumatra, was mostly
unaffected by these conditions. Bean exports are forecast to plunge 1.9 million bags to 6.1 million on
lower available supplies.
0
5
10
15
20
25
30
35
08/09 09/10 10/11 11/12 12/13 13/14 14/15 15/16 16/17
Million60KilogramBags
Weather Related Problems to Interrupt Vietnam’s Growth Again
Hot and Dry Weather
Record Honduran Production in Sharp Contrast to Region
-
2
4
6
8
10
12
14
16
18
20
11/12 12/13 13/14 14/15 15/16 16/17
Million60KilogramBags
Others
Honduras
Others includes Costa Rica, El Salvador, Guatemala, Mexico, Nicaragua, and Panama
Foreign Agricultural Service/USDA June 2016
Office of Global Analysis
Ethiopia’s Arabica production is forecast at 6.5 million bags where it has remained nearly unchanged the
last 5 years. Similarly, bean exports are forecast unchanged at 3.5 million bags, with the remainder
consumed domestically.
India’s production is forecast to ease 100,000 bags to 5.2 million following a similar decline the previous
year. Dry conditions during the flowering and fruit-set period weakened yields for both Arabica and
Robusta output. Bean exports are forecast down 200,000 bags to 3.6 million.
The European Union accounts for over 40 percent of the world’s coffee bean imports and is forecast
down 500,000 bags to 44.5 million. Top suppliers include Brazil (33 percent), Vietnam (23 percent),
Honduras (6 percent), and Colombia (6 percent). With consumption rising 800,000 bags to 43.9 million,
ending stocks are expected slightly lower at 11.8 million bags.
The United States imports the second-largest amount of coffee beans and is forecast nearly unchanged at
24.6 million bags. Top suppliers include Brazil (30 percent), Colombia (21 percent), and Vietnam (13
percent). Consumption is expected to gain 400,000 bags to 25.2 million, drawing ending stocks down
slightly to 5.8 million bags.
Revised 2015/16
World production is revised up from the December estimate by 3.2 million bags to 153.3 million.
• China is now included in the database as a producer and is estimated at 2.1 million bags.
• Indonesia is revised 1.1 million bags higher to 11.8 million due to ideal weather during the
flowering and cherry ripening period.
• Uganda is raised 700,000 bags to 4.5 million on higher-than-anticipated yields following the
previous year’s damaging drought.
• Mexico is revised down 900,000 bags to 2.5 million due to coffee rust.
World bean exports are raised 6.4 million bags to 112.9 million.
• Brazil is revised up 2.7 million bags to 32.7 million on strong U.S. and European demand.
• Indonesia is raised 2.5 million bags to 8.0 million on greater exportable supplies and strong
demand from Malaysia and Thailand’s soluble sector.
• China is now included in the database as an exporter and is estimated at 1.1 million bags.
• Vietnam is down 700,000 bags to 26.0 million as suppliers have preferred to build inventories.
World ending stocks are lowered 1.3 million bags to 35.4 million.
• Brazil is down 2.9 million bags to 2.3 million due to higher exports.
• Vietnam is up 1.5 million bags to 5.7 million on slower-than-anticipated shipments.
Foreign Agricultural Service/USDA June 2016
Office of Global Analysis
For additional information, please contact Tony Halstead at 202-720-4620,
or Tony.Halstead@fas.usda.gov
To download additional data tables, go to Production, Supply and Distribution Database
(PSD Online): (http://apps.fas.usda.gov/psdonline/psdHome.aspx), scroll down to Reports, and
Click the plus sign [+] next to Coffee
FAS Reports and Databases:
Current World Market and Trade Reports:
http://apps.fas.usda.gov/psdonline/psdDataPublications.aspx
Archives World Market and Trade Reports:
http://usda.mannlib.cornell.edu/MannUsda/viewTaxonomy.do?taxonomyID=7
Production, Supply and Distribution Database (PSD Online):
http://apps.fas.usda.gov/psdonline/psdHome.aspx
Global Agricultural Information Network (Agricultural Attaché Reports):
http://gain.fas.usda.gov/Pages/Default.aspx
Global Agricultural Trade System (U.S. Exports and Imports):
http://apps.fas.usda.gov/gats/default.aspx
Click on Standard Query and select FAS in the Product Group and scroll down to Coffee and Products.
To view volume data in Green Bean Equivalent (GBE), select quantity and choose FAS Converted.
Foreign Agricultural Service/USDA June 2016
Office of Global Analysis
April-March July-June October-September
Angola Brazil Cameroon
Bolivia Cuba Central African Republic
Burundi Dominican Republic Colombia
Ecuador Haiti Congo (Kinshasa)
Indonesia Philippines Costa Rica
Madagascar Tanzania Cote d'Ivoire
Papua New Guinea El Salvador
Peru Ethiopia
Rwanda Ghana
Guatemala
Guinea
Honduras
India
Jamaica
Kenya
Laos
Liberia
Malawi
Malaysia
Mexico
Nicaragua
Nigeria
Panama
Sierra Leone
Thailand
Togo
Uganda
United States
Venezuela
Vietnam
Yemen
Non-producing countries are on an October-September marketing year.
Marketing Years for Producing Countries
Foreign Agricultural Service/USDA June 2016
Office of Global Analysis
Coffee Summary
Thousand 60-Kilogram Bags
2011/12 2012/13 2013/14 2014/15 2015/16
Jun
2016/17
Arabica Production none
34,700Brazil 42,100 41,800 37,300 36,100 43,850
7,655Colombia 9,927 12,075 13,300 13,600 13,300
6,320Ethiopia 6,500 6,345 6,475 6,500 6,500
5,600Honduras 4,725 4,400 5,100 5,700 6,100
5,200Peru 4,300 4,250 2,900 3,500 3,800
4,400Guatemala 4,000 3,500 3,125 3,275 3,300
1,090China 1,535 1,947 2,000 2,100 2,300
4,100Mexico 4,450 3,750 2,980 2,300 2,100
2,100Nicaragua 1,925 2,000 2,100 2,000 2,100
1,690India 1,643 1,703 1,630 1,490 1,420
1,775Costa Rica 1,675 1,450 1,400 1,400 1,400
1,300Indonesia 1,700 1,650 1,270 1,350 1,300
800Vietnam 900 1,175 1,050 1,100 1,050
750Kenya 660 850 750 650 700
1,350Papua New Guinea 775 815 760 700 700
5,667Other 5,757 4,630 4,498 4,518 4,146
84,497Total 92,572 92,340 86,638 86,283 94,066
Robusta Production none
25,200Vietnam 25,600 28,658 26,350 28,200 26,225
14,500Brazil 15,500 15,400 17,000 13,300 12,100
7,000Indonesia 8,800 7,850 9,200 10,400 8,700
3,540India 3,660 3,372 3,810 3,810 3,750
2,200Uganda 2,800 3,000 2,800 3,600 3,000
1,600Cote d'Ivoire 1,750 1,675 1,400 1,650 1,700
1,450Malaysia 1,400 1,500 1,500 1,500 1,500
1,000Thailand 1,000 1,000 1,000 1,000 1,000
645Cameroon 485 375 525 575 575
450Laos 460 475 485 525 550
3,040Other 2,591 2,133 2,547 2,449 2,531
60,625Total 64,046 65,438 66,617 67,009 61,631
Production none
49,200Brazil 57,600 57,200 54,300 49,400 55,950
26,000Vietnam 26,500 29,833 27,400 29,300 27,275
7,655Colombia 9,927 12,075 13,300 13,600 13,300
8,300Indonesia 10,500 9,500 10,470 11,750 10,000
6,320Ethiopia 6,500 6,345 6,475 6,500 6,500
5,600Honduras 4,725 4,400 5,100 5,700 6,100
5,230India 5,303 5,075 5,440 5,300 5,170
5,200Peru 4,300 4,250 2,900 3,500 3,800
3,075Uganda 3,600 3,850 3,550 4,500 3,700
4,410Guatemala 4,010 3,515 3,185 3,350 3,375
1,090China 1,535 1,947 2,000 2,100 2,300
4,300Mexico 4,650 3,950 3,180 2,500 2,300
2,100Nicaragua 1,925 2,000 2,125 2,025 2,125
1,600Cote d'Ivoire 1,750 1,675 1,400 1,650 1,700
1,450Malaysia 1,400 1,500 1,500 1,500 1,500
1,775Costa Rica 1,675 1,450 1,400 1,400 1,400
565Tanzania 1,180 800 1,150 1,250 1,050
1,000Thailand 1,000 1,000 1,000 1,000 1,000
1,400Papua New Guinea 825 855 810 750 750
750Kenya 660 850 750 650 700
735Cameroon 535 425 575 625 625
450Laos 460 475 485 525 550
1,200El Salvador 1,250 550 700 475 525
455Philippines 455 450 475 475 475
550Madagascar 525 550 500 255 425
4,712Other 3,828 3,258 3,085 3,212 3,102
145,122Total 156,618 157,778 153,255 153,292 155,697
Coffee marketing year for producer countries begins either in October (Colombia), April (Indonesia) or July (Brazil), as examples.
Coffee marketing year for non-producer countries begins in October. To access a complete dataset for each country, please visit:
http://apps.fas.usda.gov/psdonline/psdQuery.aspx
Foreign Agricultural Service/USDA June 2016
Office of Global Analysis
Coffee Summary, Continued
Thousand 60-Kilogram Bags
2011/12 2012/13 2013/14 2014/15 2015/16
Jun
2016/17
Bean Exports none
26,556Brazil 27,143 30,600 33,051 32,720 32,000
23,950Vietnam 23,783 27,269 19,791 26,000 25,150
6,675Colombia 8,100 10,300 11,615 11,400 11,500
4,950Indonesia 6,900 6,000 6,770 8,000 6,100
5,290Honduras 4,480 3,940 4,760 5,200 5,700
3,000Uganda 3,575 3,600 3,400 4,000 4,000
3,735India 3,420 3,330 3,390 3,800 3,600
5,140Peru 4,100 4,100 2,750 3,275 3,600
3,140Ethiopia 3,500 3,285 3,500 3,520 3,525
3,800Guatemala 3,750 3,150 3,050 3,000 3,000
15,237Other 14,852 12,018 11,732 11,950 11,720
101,473Total 103,603 107,592 103,809 112,865 109,895
Roast and Ground Exports none
960European Union 1,070 1,185 1,220 1,200 1,000
680Switzerland 810 890 975 950 950
95Vietnam 110 120 457 550 550
38China 63 87 70 275 250
405United States 365 580 390 250 200
50Mexico 126 105 175 125 125
75Colombia 85 80 90 90 90
15Panama 15 31 47 45 45
25Indonesia 35 40 50 40 40
51Brazil 31 30 28 30 30
29Other 29 80 46 30 40
2,423Total 2,739 3,228 3,548 3,585 3,320
Soluble Exports none
3,236Brazil 3,486 3,516 3,494 3,250 3,200
1,950Malaysia 2,150 2,110 2,780 2,800 3,000
2,500Indonesia 2,000 1,800 1,900 1,920 1,800
1,484India 1,435 1,667 1,496 1,500 1,500
1,235Thailand 1,700 2,100 1,975 1,500 1,500
450Vietnam 750 900 1,282 1,500 1,500
610Colombia 670 660 715 750 800
204China 239 315 471 650 700
790Mexico 915 940 835 600 600
975Ecuador 1,075 810 760 740 500
720Other 765 898 680 835 740
14,154Total 15,185 15,716 16,388 16,045 15,840
Exports none
29,843Brazil 30,660 34,146 36,573 36,000 35,230
24,495Vietnam 24,643 28,289 21,530 28,050 27,200
7,360Colombia 8,855 11,040 12,420 12,240 12,390
7,475Indonesia 8,935 7,840 8,720 9,960 7,940
5,290Honduras 4,480 3,940 4,760 5,200 5,700
5,223India 4,858 5,013 4,897 5,305 5,105
3,000Uganda 3,575 3,600 3,400 4,000 4,000
5,140Peru 4,100 4,100 2,750 3,275 3,600
3,140Ethiopia 3,500 3,285 3,500 3,520 3,525
3,840Guatemala 3,770 3,175 3,070 3,010 3,010
23,244Other 24,151 22,108 22,125 21,935 21,355
118,050Total 121,527 126,536 123,745 132,495 129,055
Coffee marketing year for producer countries begins either in October (Colombia), April (Indonesia) or July (Brazil), as examples.
Coffee marketing year for non-producer countries begins in October. Roasted coffee was converted to green bean equivalent by
multiplying the net weight of roasted coffee by 1.19. Soluble coffee was converted to green bean equivalent by multiplying the net
weight of soluble coffee by 2.6. For each non-producing country, the trade balance between imports and exports is used in order
to avoid double-counting for these figures.
Foreign Agricultural Service/USDA June 2016
Office of Global Analysis
Coffee Summary, Continued
Thousand 60-Kilogram Bags
2011/12 2012/13 2013/14 2014/15 2015/16
Jun
2016/17
Bean Imports none
43,950European Union 45,070 44,650 45,110 45,000 44,500
23,700United States 23,360 24,550 23,525 24,500 24,550
5,965Japan 7,520 6,890 7,150 7,420 7,375
2,225Canada 2,330 2,525 2,450 2,600 2,600
2,140Switzerland 2,310 2,300 2,420 2,450 2,500
1,720Russia 2,050 2,280 2,240 2,400 2,300
1,675Korea, South 1,715 2,035 2,150 2,200 2,275
2,240Algeria 1,915 2,265 2,165 2,200 2,250
1,125Malaysia 1,375 1,270 1,880 1,900 2,100
1,125Mexico 850 1,360 1,440 1,550 1,600
12,478Other 13,412 12,580 12,567 12,655 12,235
98,343Total 101,907 102,705 103,097 104,875 104,285
Roast and Ground Imports none
780Canada 675 730 765 500 600
74China 79 93 141 300 300
165Russia 180 215 260 250 275
310Ukraine 340 340 275 275 250
155Australia 170 180 190 175 200
110Korea, South 110 125 155 170 175
125Japan 135 140 110 115 125
105Norway 110 110 120 120 120
25Mexico 55 64 70 75 75
45Taiwan 55 50 70 85 75
224Other 277 342 378 211 229
2,118Total 2,186 2,389 2,534 2,276 2,424
Soluble Imports none
2,770Philippines 3,400 3,025 3,660 4,500 4,000
1,980Russia 1,900 1,735 1,550 1,800 1,800
396China 615 791 984 1,500 1,500
1,165Canada 1,225 1,350 1,280 1,100 1,200
590Japan 750 840 815 800 825
470Indonesia 630 555 720 650 700
125United States 340 365 485 450 450
1,000Ukraine 785 690 570 400 400
240Argentina 260 260 250 270 250
310Australia 310 250 275 260 250
2,119Other 2,100 2,288 1,992 2,166 2,181
11,165Total 12,315 12,149 12,581 13,896 13,556
Imports none
43,950European Union 45,070 44,650 45,110 45,000 44,500
23,825United States 23,700 24,915 24,010 24,950 25,000
6,680Japan 8,405 7,870 8,075 8,335 8,325
4,170Canada 4,230 4,605 4,495 4,200 4,400
3,865Russia 4,130 4,230 4,050 4,450 4,375
3,280Philippines 3,880 3,185 3,845 5,000 4,300
1,093China 1,624 1,794 2,015 2,725 2,750
2,140Switzerland 2,310 2,300 2,420 2,450 2,500
1,785Korea, South 1,825 2,160 2,305 2,370 2,450
2,270Algeria 1,945 2,300 2,195 2,230 2,280
18,568Other 19,289 19,234 19,692 19,337 19,385
111,626Total 116,408 117,243 118,212 121,047 120,265
Coffee marketing year for producer countries begins either in October (Colombia), April (Indonesia) or July (Brazil), as examples.
Coffee marketing year for non-producer countries begins in October. Roasted coffee was converted to green bean equivalent by
multiplying the net weight of roasted coffee by 1.19. Soluble coffee was converted to green bean equivalent by multiplying the net
weight of soluble coffee by 2.6. For each non-producing country, the trade balance between imports and exports is used in order
to avoid double-counting for these figures.
Foreign Agricultural Service/USDA June 2016
Office of Global Analysis
Coffee Summary, Continued
Thousand 60-Kilogram Bags
2011/12 2012/13 2013/14 2014/15 2015/16
Jun
2016/17
Domestic Consumption none
45,250European Union 43,275 41,475 43,820 43,100 43,900
22,946United States 23,027 23,811 23,573 24,767 25,150
20,025Brazil 20,110 20,210 20,420 20,500 20,520
7,050Japan 7,565 7,750 7,825 8,285 8,325
3,660Philippines 4,405 3,630 4,320 5,475 4,775
4,170Canada 4,230 4,605 4,495 4,200 4,400
3,865Russia 4,130 4,230 4,050 4,450 4,375
2,355Indonesia 2,635 2,750 3,040 2,750 3,110
1,045China 1,621 2,195 2,463 2,850 3,000
3,050Ethiopia 3,130 3,120 2,985 2,972 2,975
1,665Vietnam 1,825 2,008 2,217 2,600 2,868
1,785Korea, South 1,825 2,160 2,305 2,370 2,450
2,287Mexico 2,170 2,731 2,364 2,315 2,350
2,270Algeria 1,945 2,300 2,195 2,230 2,280
1,600Australia 1,660 1,615 1,775 1,810 1,800
1,460Switzerland 1,500 1,410 1,445 1,500 1,550
1,260Colombia 1,200 1,300 1,400 1,425 1,475
1,168India 1,100 1,170 1,270 1,350 1,400
1,305Venezuela 1,290 1,170 1,151 1,151 1,031
1,425Ukraine 1,255 1,155 1,025 875 825
750Argentina 835 685 710 810 785
760Norway 740 775 775 785 775
375Turkey 490 505 670 740 750
755Serbia 740 790 605 575 650
715Morocco 705 620 635 640 640
8,669Other 8,544 8,626 8,454 8,565 8,647
141,665Total 141,952 142,796 145,987 149,090 150,806
Ending Stocks none
10,400European Union 10,845 12,400 12,225 12,500 11,800
5,100United States 5,450 6,025 6,117 6,100 5,800
1,090Vietnam 1,946 2,130 6,373 5,653 3,500
2,140Japan 2,980 3,100 3,350 3,400 3,400
2,238Brazil 9,068 11,946 9,305 2,265 2,530
1,473India 1,982 2,026 2,501 2,289 1,997
90Honduras 140 300 340 500 560
249Colombia 771 961 666 826 486
45Tanzania 255 202 322 302 272
252Nicaragua 17 22 102 97 182
2,596Other 1,766 1,797 1,343 1,466 972
25,673Total 35,220 40,909 42,644 35,398 31,499
Coffee marketing year for producer countries begins either in October (Colombia), April (Indonesia) or July (Brazil), as examples.
Coffee marketing year for non-producer countries begins in October.
Foreign Agricultural Service/USDA June 2016
Office of Global Analysis

Weitere ähnliche Inhalte

Andere mochten auch

Экономика труда
Экономика трудаЭкономика труда
Экономика труда
iefmiit
 
Sam walton evaluation
Sam walton evaluationSam walton evaluation
Sam walton evaluation
swalton5
 
экономика предприятий и организаций
экономика предприятий и организацийэкономика предприятий и организаций
экономика предприятий и организаций
iefmiit
 
Управленческий и финансовый учет
Управленческий и финансовый учетУправленческий и финансовый учет
Управленческий и финансовый учет
iefmiit
 
Мировая экономика
Мировая экономикаМировая экономика
Мировая экономика
iefmiit
 
õPidisaini analüüs
õPidisaini analüüsõPidisaini analüüs
õPidisaini analüüs
karmentra
 
Электронный бизнес
Электронный бизнесЭлектронный бизнес
Электронный бизнес
iefmiit
 
Best Bday Gift 2014
Best Bday Gift 2014Best Bday Gift 2014
Best Bday Gift 2014
Ariel Chen
 

Andere mochten auch (20)

Ardilla
ArdillaArdilla
Ardilla
 
Экономика труда
Экономика трудаЭкономика труда
Экономика труда
 
Sam walton evaluation
Sam walton evaluationSam walton evaluation
Sam walton evaluation
 
CECAFÉ - Relatório Mensal JULHO 2016
CECAFÉ - Relatório Mensal JULHO 2016CECAFÉ - Relatório Mensal JULHO 2016
CECAFÉ - Relatório Mensal JULHO 2016
 
экономика предприятий и организаций
экономика предприятий и организацийэкономика предприятий и организаций
экономика предприятий и организаций
 
Управленческий и финансовый учет
Управленческий и финансовый учетУправленческий и финансовый учет
Управленческий и финансовый учет
 
7 karrierestyrkende trin til opmærksomhed, likes og tillid på nettet
7 karrierestyrkende trin til opmærksomhed, likes og tillid på nettet7 karrierestyrkende trin til opmærksomhed, likes og tillid på nettet
7 karrierestyrkende trin til opmærksomhed, likes og tillid på nettet
 
Blood diamonds
Blood diamondsBlood diamonds
Blood diamonds
 
Мировая экономика
Мировая экономикаМировая экономика
Мировая экономика
 
CECAFÉ - Relatório Mensal DEZEMBRO 2015
CECAFÉ - Relatório Mensal DEZEMBRO 2015CECAFÉ - Relatório Mensal DEZEMBRO 2015
CECAFÉ - Relatório Mensal DEZEMBRO 2015
 
õPidisaini analüüs
õPidisaini analüüsõPidisaini analüüs
õPidisaini analüüs
 
Concurso Qualidade de Café 2016 - Emater MG
Concurso Qualidade de Café 2016 - Emater MGConcurso Qualidade de Café 2016 - Emater MG
Concurso Qualidade de Café 2016 - Emater MG
 
LinkedIn foredrag - Kost & Ernæringsforbundet
LinkedIn foredrag - Kost & ErnæringsforbundetLinkedIn foredrag - Kost & Ernæringsforbundet
LinkedIn foredrag - Kost & Ernæringsforbundet
 
Электронный бизнес
Электронный бизнесЭлектронный бизнес
Электронный бизнес
 
Japan
JapanJapan
Japan
 
Relatório sobre o mercado de café da OIC - Fevereiro 2016
Relatório sobre o mercado de café da OIC - Fevereiro 2016Relatório sobre o mercado de café da OIC - Fevereiro 2016
Relatório sobre o mercado de café da OIC - Fevereiro 2016
 
Best Bday Gift 2014
Best Bday Gift 2014Best Bday Gift 2014
Best Bday Gift 2014
 
Slides
SlidesSlides
Slides
 
Boletim Ativos do Café - Edição 24 / Abril 2016
Boletim Ativos do Café - Edição 24 / Abril 2016Boletim Ativos do Café - Edição 24 / Abril 2016
Boletim Ativos do Café - Edição 24 / Abril 2016
 
5 online classrooms - dubai 2015
5 online classrooms - dubai 20155 online classrooms - dubai 2015
5 online classrooms - dubai 2015
 

Mehr von Luiz Valeriano

Mehr von Luiz Valeriano (20)

CECAFÉ - Relatório Mensal JULHO 2021
CECAFÉ - Relatório Mensal JULHO 2021CECAFÉ - Relatório Mensal JULHO 2021
CECAFÉ - Relatório Mensal JULHO 2021
 
CECAFÉ - Relatório Mensal JUNHO 2021
CECAFÉ - Relatório Mensal JUNHO 2021CECAFÉ - Relatório Mensal JUNHO 2021
CECAFÉ - Relatório Mensal JUNHO 2021
 
CECAFÉ - Relatório Mensal MAIO 2021
CECAFÉ - Relatório Mensal MAIO 2021CECAFÉ - Relatório Mensal MAIO 2021
CECAFÉ - Relatório Mensal MAIO 2021
 
Acompanhamento da Safra Brasileira de Café - 2º Levantamento - Maio 2021
Acompanhamento da Safra Brasileira de Café - 2º Levantamento - Maio 2021Acompanhamento da Safra Brasileira de Café - 2º Levantamento - Maio 2021
Acompanhamento da Safra Brasileira de Café - 2º Levantamento - Maio 2021
 
CECAFÉ - Relatório Mensal ABRIL 2021
CECAFÉ - Relatório Mensal ABRIL 2021CECAFÉ - Relatório Mensal ABRIL 2021
CECAFÉ - Relatório Mensal ABRIL 2021
 
INCAPER: Relatório de perdas na agropecuária devido aos eventos climáticos
INCAPER: Relatório de perdas na agropecuária devido aos eventos climáticosINCAPER: Relatório de perdas na agropecuária devido aos eventos climáticos
INCAPER: Relatório de perdas na agropecuária devido aos eventos climáticos
 
Emater-MG divulga cartilha com cuidados contra a Covid-19 na colheita do café
Emater-MG divulga cartilha com cuidados contra a Covid-19 na colheita do caféEmater-MG divulga cartilha com cuidados contra a Covid-19 na colheita do café
Emater-MG divulga cartilha com cuidados contra a Covid-19 na colheita do café
 
CECAFÉ - Relatório Mensal MARÇO 2021
CECAFÉ - Relatório Mensal MARÇO 2021CECAFÉ - Relatório Mensal MARÇO 2021
CECAFÉ - Relatório Mensal MARÇO 2021
 
Cartilha Colheita do Café 2021 – Orientações para prevenção do novo Coronavírus
Cartilha Colheita do Café 2021 – Orientações para prevenção do novo CoronavírusCartilha Colheita do Café 2021 – Orientações para prevenção do novo Coronavírus
Cartilha Colheita do Café 2021 – Orientações para prevenção do novo Coronavírus
 
Relatório de Levantamento da Estimativa de Perdas na Cafeicultura
Relatório de Levantamento da Estimativa de Perdas na CafeiculturaRelatório de Levantamento da Estimativa de Perdas na Cafeicultura
Relatório de Levantamento da Estimativa de Perdas na Cafeicultura
 
CECAFÉ - Relatório Mensal FEVEREIRO 2021
CECAFÉ - Relatório Mensal FEVEREIRO 2021CECAFÉ - Relatório Mensal FEVEREIRO 2021
CECAFÉ - Relatório Mensal FEVEREIRO 2021
 
CECAFÉ - Relatório Mensal JANEIRO 2021
CECAFÉ - Relatório Mensal JANEIRO 2021CECAFÉ - Relatório Mensal JANEIRO 2021
CECAFÉ - Relatório Mensal JANEIRO 2021
 
Acompanhamento da Safra Brasileira de Café - 1º Levantamento - Janeiro 2021
Acompanhamento da Safra Brasileira de Café - 1º Levantamento - Janeiro 2021Acompanhamento da Safra Brasileira de Café - 1º Levantamento - Janeiro 2021
Acompanhamento da Safra Brasileira de Café - 1º Levantamento - Janeiro 2021
 
Relatório Café Solúvel - Janeiro 2021
Relatório Café Solúvel - Janeiro 2021Relatório Café Solúvel - Janeiro 2021
Relatório Café Solúvel - Janeiro 2021
 
CECAFÉ - Relatório Mensal DEZEMBRO 2020
CECAFÉ - Relatório Mensal DEZEMBRO 2020CECAFÉ - Relatório Mensal DEZEMBRO 2020
CECAFÉ - Relatório Mensal DEZEMBRO 2020
 
Resultados Preliminares UDs Café Cerrado 2020
Resultados Preliminares UDs Café Cerrado 2020Resultados Preliminares UDs Café Cerrado 2020
Resultados Preliminares UDs Café Cerrado 2020
 
Acompanhamento da Safra Brasileira de Café - 4º Levantamento - Dezembro 2020
Acompanhamento da Safra Brasileira de Café - 4º Levantamento - Dezembro 2020Acompanhamento da Safra Brasileira de Café - 4º Levantamento - Dezembro 2020
Acompanhamento da Safra Brasileira de Café - 4º Levantamento - Dezembro 2020
 
CECAFÉ - Relatório Mensal NOVEMBRO 2020
CECAFÉ - Relatório Mensal NOVEMBRO 2020CECAFÉ - Relatório Mensal NOVEMBRO 2020
CECAFÉ - Relatório Mensal NOVEMBRO 2020
 
CECAFÉ - Relatório Mensal OUTUBRO 2020
CECAFÉ - Relatório Mensal OUTUBRO 2020CECAFÉ - Relatório Mensal OUTUBRO 2020
CECAFÉ - Relatório Mensal OUTUBRO 2020
 
CECAFÉ - Relatório Mensal SETEMBRO 2020
CECAFÉ - Relatório Mensal SETEMBRO 2020CECAFÉ - Relatório Mensal SETEMBRO 2020
CECAFÉ - Relatório Mensal SETEMBRO 2020
 

Kürzlich hochgeladen

Top profile Call Girls In Nandurbar [ 7014168258 ] Call Me For Genuine Models...
Top profile Call Girls In Nandurbar [ 7014168258 ] Call Me For Genuine Models...Top profile Call Girls In Nandurbar [ 7014168258 ] Call Me For Genuine Models...
Top profile Call Girls In Nandurbar [ 7014168258 ] Call Me For Genuine Models...
gajnagarg
 
Top profile Call Girls In Purnia [ 7014168258 ] Call Me For Genuine Models We...
Top profile Call Girls In Purnia [ 7014168258 ] Call Me For Genuine Models We...Top profile Call Girls In Purnia [ 7014168258 ] Call Me For Genuine Models We...
Top profile Call Girls In Purnia [ 7014168258 ] Call Me For Genuine Models We...
nirzagarg
 
怎样办理圣地亚哥州立大学毕业证(SDSU毕业证书)成绩单学校原版复制
怎样办理圣地亚哥州立大学毕业证(SDSU毕业证书)成绩单学校原版复制怎样办理圣地亚哥州立大学毕业证(SDSU毕业证书)成绩单学校原版复制
怎样办理圣地亚哥州立大学毕业证(SDSU毕业证书)成绩单学校原版复制
vexqp
 
Top profile Call Girls In Rohtak [ 7014168258 ] Call Me For Genuine Models We...
Top profile Call Girls In Rohtak [ 7014168258 ] Call Me For Genuine Models We...Top profile Call Girls In Rohtak [ 7014168258 ] Call Me For Genuine Models We...
Top profile Call Girls In Rohtak [ 7014168258 ] Call Me For Genuine Models We...
nirzagarg
 
Top profile Call Girls In Begusarai [ 7014168258 ] Call Me For Genuine Models...
Top profile Call Girls In Begusarai [ 7014168258 ] Call Me For Genuine Models...Top profile Call Girls In Begusarai [ 7014168258 ] Call Me For Genuine Models...
Top profile Call Girls In Begusarai [ 7014168258 ] Call Me For Genuine Models...
nirzagarg
 
Jual Obat Aborsi Surabaya ( Asli No.1 ) 085657271886 Obat Penggugur Kandungan...
Jual Obat Aborsi Surabaya ( Asli No.1 ) 085657271886 Obat Penggugur Kandungan...Jual Obat Aborsi Surabaya ( Asli No.1 ) 085657271886 Obat Penggugur Kandungan...
Jual Obat Aborsi Surabaya ( Asli No.1 ) 085657271886 Obat Penggugur Kandungan...
ZurliaSoop
 
Top profile Call Girls In Bihar Sharif [ 7014168258 ] Call Me For Genuine Mod...
Top profile Call Girls In Bihar Sharif [ 7014168258 ] Call Me For Genuine Mod...Top profile Call Girls In Bihar Sharif [ 7014168258 ] Call Me For Genuine Mod...
Top profile Call Girls In Bihar Sharif [ 7014168258 ] Call Me For Genuine Mod...
nirzagarg
 
Jual obat aborsi Bandung ( 085657271886 ) Cytote pil telat bulan penggugur ka...
Jual obat aborsi Bandung ( 085657271886 ) Cytote pil telat bulan penggugur ka...Jual obat aborsi Bandung ( 085657271886 ) Cytote pil telat bulan penggugur ka...
Jual obat aborsi Bandung ( 085657271886 ) Cytote pil telat bulan penggugur ka...
Klinik kandungan
 
Lake Town / Independent Kolkata Call Girls Phone No 8005736733 Elite Escort S...
Lake Town / Independent Kolkata Call Girls Phone No 8005736733 Elite Escort S...Lake Town / Independent Kolkata Call Girls Phone No 8005736733 Elite Escort S...
Lake Town / Independent Kolkata Call Girls Phone No 8005736733 Elite Escort S...
HyderabadDolls
 
Top profile Call Girls In Indore [ 7014168258 ] Call Me For Genuine Models We...
Top profile Call Girls In Indore [ 7014168258 ] Call Me For Genuine Models We...Top profile Call Girls In Indore [ 7014168258 ] Call Me For Genuine Models We...
Top profile Call Girls In Indore [ 7014168258 ] Call Me For Genuine Models We...
gajnagarg
 
Gartner's Data Analytics Maturity Model.pptx
Gartner's Data Analytics Maturity Model.pptxGartner's Data Analytics Maturity Model.pptx
Gartner's Data Analytics Maturity Model.pptx
chadhar227
 
Kalyani ? Call Girl in Kolkata | Service-oriented sexy call girls 8005736733 ...
Kalyani ? Call Girl in Kolkata | Service-oriented sexy call girls 8005736733 ...Kalyani ? Call Girl in Kolkata | Service-oriented sexy call girls 8005736733 ...
Kalyani ? Call Girl in Kolkata | Service-oriented sexy call girls 8005736733 ...
HyderabadDolls
 

Kürzlich hochgeladen (20)

TrafficWave Generator Will Instantly drive targeted and engaging traffic back...
TrafficWave Generator Will Instantly drive targeted and engaging traffic back...TrafficWave Generator Will Instantly drive targeted and engaging traffic back...
TrafficWave Generator Will Instantly drive targeted and engaging traffic back...
 
Top profile Call Girls In Nandurbar [ 7014168258 ] Call Me For Genuine Models...
Top profile Call Girls In Nandurbar [ 7014168258 ] Call Me For Genuine Models...Top profile Call Girls In Nandurbar [ 7014168258 ] Call Me For Genuine Models...
Top profile Call Girls In Nandurbar [ 7014168258 ] Call Me For Genuine Models...
 
Top profile Call Girls In Purnia [ 7014168258 ] Call Me For Genuine Models We...
Top profile Call Girls In Purnia [ 7014168258 ] Call Me For Genuine Models We...Top profile Call Girls In Purnia [ 7014168258 ] Call Me For Genuine Models We...
Top profile Call Girls In Purnia [ 7014168258 ] Call Me For Genuine Models We...
 
怎样办理圣地亚哥州立大学毕业证(SDSU毕业证书)成绩单学校原版复制
怎样办理圣地亚哥州立大学毕业证(SDSU毕业证书)成绩单学校原版复制怎样办理圣地亚哥州立大学毕业证(SDSU毕业证书)成绩单学校原版复制
怎样办理圣地亚哥州立大学毕业证(SDSU毕业证书)成绩单学校原版复制
 
Case Study 4 Where the cry of rebellion happen?
Case Study 4 Where the cry of rebellion happen?Case Study 4 Where the cry of rebellion happen?
Case Study 4 Where the cry of rebellion happen?
 
Top profile Call Girls In Rohtak [ 7014168258 ] Call Me For Genuine Models We...
Top profile Call Girls In Rohtak [ 7014168258 ] Call Me For Genuine Models We...Top profile Call Girls In Rohtak [ 7014168258 ] Call Me For Genuine Models We...
Top profile Call Girls In Rohtak [ 7014168258 ] Call Me For Genuine Models We...
 
Ranking and Scoring Exercises for Research
Ranking and Scoring Exercises for ResearchRanking and Scoring Exercises for Research
Ranking and Scoring Exercises for Research
 
Identify Customer Segments to Create Customer Offers for Each Segment - Appli...
Identify Customer Segments to Create Customer Offers for Each Segment - Appli...Identify Customer Segments to Create Customer Offers for Each Segment - Appli...
Identify Customer Segments to Create Customer Offers for Each Segment - Appli...
 
Top profile Call Girls In Begusarai [ 7014168258 ] Call Me For Genuine Models...
Top profile Call Girls In Begusarai [ 7014168258 ] Call Me For Genuine Models...Top profile Call Girls In Begusarai [ 7014168258 ] Call Me For Genuine Models...
Top profile Call Girls In Begusarai [ 7014168258 ] Call Me For Genuine Models...
 
Gomti Nagar & best call girls in Lucknow | 9548273370 Independent Escorts & D...
Gomti Nagar & best call girls in Lucknow | 9548273370 Independent Escorts & D...Gomti Nagar & best call girls in Lucknow | 9548273370 Independent Escorts & D...
Gomti Nagar & best call girls in Lucknow | 9548273370 Independent Escorts & D...
 
Statistics notes ,it includes mean to index numbers
Statistics notes ,it includes mean to index numbersStatistics notes ,it includes mean to index numbers
Statistics notes ,it includes mean to index numbers
 
Jual Obat Aborsi Surabaya ( Asli No.1 ) 085657271886 Obat Penggugur Kandungan...
Jual Obat Aborsi Surabaya ( Asli No.1 ) 085657271886 Obat Penggugur Kandungan...Jual Obat Aborsi Surabaya ( Asli No.1 ) 085657271886 Obat Penggugur Kandungan...
Jual Obat Aborsi Surabaya ( Asli No.1 ) 085657271886 Obat Penggugur Kandungan...
 
Top profile Call Girls In Bihar Sharif [ 7014168258 ] Call Me For Genuine Mod...
Top profile Call Girls In Bihar Sharif [ 7014168258 ] Call Me For Genuine Mod...Top profile Call Girls In Bihar Sharif [ 7014168258 ] Call Me For Genuine Mod...
Top profile Call Girls In Bihar Sharif [ 7014168258 ] Call Me For Genuine Mod...
 
Jual obat aborsi Bandung ( 085657271886 ) Cytote pil telat bulan penggugur ka...
Jual obat aborsi Bandung ( 085657271886 ) Cytote pil telat bulan penggugur ka...Jual obat aborsi Bandung ( 085657271886 ) Cytote pil telat bulan penggugur ka...
Jual obat aborsi Bandung ( 085657271886 ) Cytote pil telat bulan penggugur ka...
 
💞 Safe And Secure Call Girls Agra Call Girls Service Just Call 🍑👄6378878445 🍑...
💞 Safe And Secure Call Girls Agra Call Girls Service Just Call 🍑👄6378878445 🍑...💞 Safe And Secure Call Girls Agra Call Girls Service Just Call 🍑👄6378878445 🍑...
💞 Safe And Secure Call Girls Agra Call Girls Service Just Call 🍑👄6378878445 🍑...
 
Introduction to Statistics Presentation.pptx
Introduction to Statistics Presentation.pptxIntroduction to Statistics Presentation.pptx
Introduction to Statistics Presentation.pptx
 
Lake Town / Independent Kolkata Call Girls Phone No 8005736733 Elite Escort S...
Lake Town / Independent Kolkata Call Girls Phone No 8005736733 Elite Escort S...Lake Town / Independent Kolkata Call Girls Phone No 8005736733 Elite Escort S...
Lake Town / Independent Kolkata Call Girls Phone No 8005736733 Elite Escort S...
 
Top profile Call Girls In Indore [ 7014168258 ] Call Me For Genuine Models We...
Top profile Call Girls In Indore [ 7014168258 ] Call Me For Genuine Models We...Top profile Call Girls In Indore [ 7014168258 ] Call Me For Genuine Models We...
Top profile Call Girls In Indore [ 7014168258 ] Call Me For Genuine Models We...
 
Gartner's Data Analytics Maturity Model.pptx
Gartner's Data Analytics Maturity Model.pptxGartner's Data Analytics Maturity Model.pptx
Gartner's Data Analytics Maturity Model.pptx
 
Kalyani ? Call Girl in Kolkata | Service-oriented sexy call girls 8005736733 ...
Kalyani ? Call Girl in Kolkata | Service-oriented sexy call girls 8005736733 ...Kalyani ? Call Girl in Kolkata | Service-oriented sexy call girls 8005736733 ...
Kalyani ? Call Girl in Kolkata | Service-oriented sexy call girls 8005736733 ...
 

Relatório bianual USDA - Junho de 2016

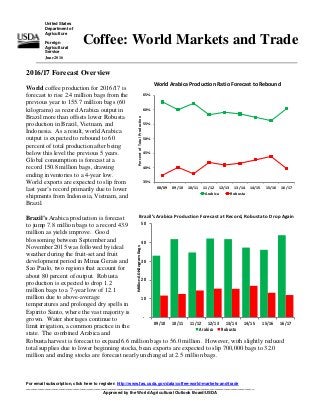
  • 1. For email subscription, click here to register: http://www.fas.usda.gov/data/coffee-world-markets-and-trade __________________________________________________________________________________________________ Approved by the World Agricultural Outlook Board/USDA United States Department of Agriculture Foreign Agricultural Service June 2016 World Arabica Production Ratio Forecast to Rebound 35% 40% 45% 50% 55% 60% 65% 08/09 09/10 10/11 11/12 12/13 13/14 14/15 15/16 16/17 PercentofTotalProduction Arabica Robusta 2016/17 Forecast Overview World coffee production for 2016/17 is forecast to rise 2.4 million bags from the previous year to 155.7 million bags (60 kilograms) as record Arabica output in Brazil more than offsets lower Robusta production in Brazil, Vietnam, and Indonesia. As a result, world Arabica output is expected to rebound to 60 percent of total production after being below this level the previous 5 years. Global consumption is forecast at a record 150.8 million bags, drawing ending inventories to a 4-year low. World exports are expected to slip from last year’s record primarily due to lower shipments from Indonesia, Vietnam, and Brazil. Brazil’s Arabica production is forecast to jump 7.8 million bags to a record 43.9 million as yields improve. Good blossoming between September and November 2015 was followed by ideal weather during the fruit-set and fruit development period in Minas Gerais and Sao Paulo, two regions that account for about 80 percent of output. Robusta production is expected to drop 1.2 million bags to a 7-year low of 12.1 million due to above-average temperatures and prolonged dry spells in Espirito Santo, where the vast majority is grown. Water shortages continue to limit irrigation, a common practice in the state. The combined Arabica and Robusta harvest is forecast to expand 6.6 million bags to 56.0 million. However, with slightly reduced total supplies due to lower beginning stocks, bean exports are expected to slip 700,000 bags to 32.0 million and ending stocks are forecast nearly unchanged at 2.5 million bags. Coffee: World Markets and Trade Brazil’s Arabica Production Forecast at Record, Robusta to Drop Again - 10 20 30 40 50 09/10 10/11 11/12 12/13 13/14 14/15 15/16 16/17 Million60KilogramBags Arabica Robusta
  • 2. Vietnam’s production is forecast to decline 2.0 million bags to 27.3 million as high temperatures combined with dry growing conditions between January and April 2016 to weaken yields. Cultivated area is forecast nearly equal to last year, and over 95 percent of total output is Robusta. Following 2 years of elevated inventories, ending stocks are expected to fall 2.2 million bags to 3.5 million, and bean exports are forecast 850,000 bags lower to 25.2 million. Colombia’s Arabica production is forecast down 300,000 bags to 13.3 million due to expected heavy rains towards the end of 2016. This will likely affect the mitaca crop by disrupting the flowering process as well as creating conditions conducive to the spread of coffee rust for trees not renovated to resistant varieties. The mitaca crop typically accounts for about 40 percent of total output and is harvested from the central coffee region between April and June. Also, coffee cherry borer insect infestations in this region are expected to more than double to 10 percent of planted area, reducing yields and quality. Despite this, bean exports, mostly to the United States and Europe, are forecast to gain 100,000 bags to 11.5 million. Central America and Mexico account for over 15 percent of the world’s Arabica production, and coffee rust continues to hamper output for most of these countries. Although the region’s production is forecast to add 400,000 bags to total 15.9 million, the rebound is mostly limited to Honduras where rust-resistant trees from recently renovated land are expected to propel output to a record 6.1 million bags. Nicaragua is forecast 100,000 bags higher to 2.1 million as a result of good weather during bloom as well as the addition of output from recently renovated land. Costa Rica, El Salvador, Guatemala, and Mexico are flat at 1.4 million bags, 525,000 bags, 3.4 million bags, and 2.3 million bags, respectively, as these countries continue to struggle with rust and output remains below their pre-rust level. Bean exports for the region are forecast to gain 400,000 bags to 13.3 million mainly due to higher exportable supplies in Honduras. Approximately 40 percent of the region’s exports are destined for the United States, followed by 35 percent to the European Union. Indonesia’s production is forecast to drop 1.8 million bags to 10.0 million due to severe drought throughout much of the archipelago. Dry weather disrupted the flowering and ripening stage of cherry formation and was most acutely felt in lowland areas of Southern Sumatra and Java where approximately 75 percent of the Robusta crop is grown. Arabica production, situated in Northern Sumatra, was mostly unaffected by these conditions. Bean exports are forecast to plunge 1.9 million bags to 6.1 million on lower available supplies. 0 5 10 15 20 25 30 35 08/09 09/10 10/11 11/12 12/13 13/14 14/15 15/16 16/17 Million60KilogramBags Weather Related Problems to Interrupt Vietnam’s Growth Again Hot and Dry Weather Record Honduran Production in Sharp Contrast to Region - 2 4 6 8 10 12 14 16 18 20 11/12 12/13 13/14 14/15 15/16 16/17 Million60KilogramBags Others Honduras Others includes Costa Rica, El Salvador, Guatemala, Mexico, Nicaragua, and Panama Foreign Agricultural Service/USDA June 2016 Office of Global Analysis
  • 3. Ethiopia’s Arabica production is forecast at 6.5 million bags where it has remained nearly unchanged the last 5 years. Similarly, bean exports are forecast unchanged at 3.5 million bags, with the remainder consumed domestically. India’s production is forecast to ease 100,000 bags to 5.2 million following a similar decline the previous year. Dry conditions during the flowering and fruit-set period weakened yields for both Arabica and Robusta output. Bean exports are forecast down 200,000 bags to 3.6 million. The European Union accounts for over 40 percent of the world’s coffee bean imports and is forecast down 500,000 bags to 44.5 million. Top suppliers include Brazil (33 percent), Vietnam (23 percent), Honduras (6 percent), and Colombia (6 percent). With consumption rising 800,000 bags to 43.9 million, ending stocks are expected slightly lower at 11.8 million bags. The United States imports the second-largest amount of coffee beans and is forecast nearly unchanged at 24.6 million bags. Top suppliers include Brazil (30 percent), Colombia (21 percent), and Vietnam (13 percent). Consumption is expected to gain 400,000 bags to 25.2 million, drawing ending stocks down slightly to 5.8 million bags. Revised 2015/16 World production is revised up from the December estimate by 3.2 million bags to 153.3 million. • China is now included in the database as a producer and is estimated at 2.1 million bags. • Indonesia is revised 1.1 million bags higher to 11.8 million due to ideal weather during the flowering and cherry ripening period. • Uganda is raised 700,000 bags to 4.5 million on higher-than-anticipated yields following the previous year’s damaging drought. • Mexico is revised down 900,000 bags to 2.5 million due to coffee rust. World bean exports are raised 6.4 million bags to 112.9 million. • Brazil is revised up 2.7 million bags to 32.7 million on strong U.S. and European demand. • Indonesia is raised 2.5 million bags to 8.0 million on greater exportable supplies and strong demand from Malaysia and Thailand’s soluble sector. • China is now included in the database as an exporter and is estimated at 1.1 million bags. • Vietnam is down 700,000 bags to 26.0 million as suppliers have preferred to build inventories. World ending stocks are lowered 1.3 million bags to 35.4 million. • Brazil is down 2.9 million bags to 2.3 million due to higher exports. • Vietnam is up 1.5 million bags to 5.7 million on slower-than-anticipated shipments. Foreign Agricultural Service/USDA June 2016 Office of Global Analysis
  • 4. For additional information, please contact Tony Halstead at 202-720-4620, or Tony.Halstead@fas.usda.gov To download additional data tables, go to Production, Supply and Distribution Database (PSD Online): (http://apps.fas.usda.gov/psdonline/psdHome.aspx), scroll down to Reports, and Click the plus sign [+] next to Coffee FAS Reports and Databases: Current World Market and Trade Reports: http://apps.fas.usda.gov/psdonline/psdDataPublications.aspx Archives World Market and Trade Reports: http://usda.mannlib.cornell.edu/MannUsda/viewTaxonomy.do?taxonomyID=7 Production, Supply and Distribution Database (PSD Online): http://apps.fas.usda.gov/psdonline/psdHome.aspx Global Agricultural Information Network (Agricultural Attaché Reports): http://gain.fas.usda.gov/Pages/Default.aspx Global Agricultural Trade System (U.S. Exports and Imports): http://apps.fas.usda.gov/gats/default.aspx Click on Standard Query and select FAS in the Product Group and scroll down to Coffee and Products. To view volume data in Green Bean Equivalent (GBE), select quantity and choose FAS Converted. Foreign Agricultural Service/USDA June 2016 Office of Global Analysis
  • 5. April-March July-June October-September Angola Brazil Cameroon Bolivia Cuba Central African Republic Burundi Dominican Republic Colombia Ecuador Haiti Congo (Kinshasa) Indonesia Philippines Costa Rica Madagascar Tanzania Cote d'Ivoire Papua New Guinea El Salvador Peru Ethiopia Rwanda Ghana Guatemala Guinea Honduras India Jamaica Kenya Laos Liberia Malawi Malaysia Mexico Nicaragua Nigeria Panama Sierra Leone Thailand Togo Uganda United States Venezuela Vietnam Yemen Non-producing countries are on an October-September marketing year. Marketing Years for Producing Countries Foreign Agricultural Service/USDA June 2016 Office of Global Analysis
  • 6. Coffee Summary Thousand 60-Kilogram Bags 2011/12 2012/13 2013/14 2014/15 2015/16 Jun 2016/17 Arabica Production none 34,700Brazil 42,100 41,800 37,300 36,100 43,850 7,655Colombia 9,927 12,075 13,300 13,600 13,300 6,320Ethiopia 6,500 6,345 6,475 6,500 6,500 5,600Honduras 4,725 4,400 5,100 5,700 6,100 5,200Peru 4,300 4,250 2,900 3,500 3,800 4,400Guatemala 4,000 3,500 3,125 3,275 3,300 1,090China 1,535 1,947 2,000 2,100 2,300 4,100Mexico 4,450 3,750 2,980 2,300 2,100 2,100Nicaragua 1,925 2,000 2,100 2,000 2,100 1,690India 1,643 1,703 1,630 1,490 1,420 1,775Costa Rica 1,675 1,450 1,400 1,400 1,400 1,300Indonesia 1,700 1,650 1,270 1,350 1,300 800Vietnam 900 1,175 1,050 1,100 1,050 750Kenya 660 850 750 650 700 1,350Papua New Guinea 775 815 760 700 700 5,667Other 5,757 4,630 4,498 4,518 4,146 84,497Total 92,572 92,340 86,638 86,283 94,066 Robusta Production none 25,200Vietnam 25,600 28,658 26,350 28,200 26,225 14,500Brazil 15,500 15,400 17,000 13,300 12,100 7,000Indonesia 8,800 7,850 9,200 10,400 8,700 3,540India 3,660 3,372 3,810 3,810 3,750 2,200Uganda 2,800 3,000 2,800 3,600 3,000 1,600Cote d'Ivoire 1,750 1,675 1,400 1,650 1,700 1,450Malaysia 1,400 1,500 1,500 1,500 1,500 1,000Thailand 1,000 1,000 1,000 1,000 1,000 645Cameroon 485 375 525 575 575 450Laos 460 475 485 525 550 3,040Other 2,591 2,133 2,547 2,449 2,531 60,625Total 64,046 65,438 66,617 67,009 61,631 Production none 49,200Brazil 57,600 57,200 54,300 49,400 55,950 26,000Vietnam 26,500 29,833 27,400 29,300 27,275 7,655Colombia 9,927 12,075 13,300 13,600 13,300 8,300Indonesia 10,500 9,500 10,470 11,750 10,000 6,320Ethiopia 6,500 6,345 6,475 6,500 6,500 5,600Honduras 4,725 4,400 5,100 5,700 6,100 5,230India 5,303 5,075 5,440 5,300 5,170 5,200Peru 4,300 4,250 2,900 3,500 3,800 3,075Uganda 3,600 3,850 3,550 4,500 3,700 4,410Guatemala 4,010 3,515 3,185 3,350 3,375 1,090China 1,535 1,947 2,000 2,100 2,300 4,300Mexico 4,650 3,950 3,180 2,500 2,300 2,100Nicaragua 1,925 2,000 2,125 2,025 2,125 1,600Cote d'Ivoire 1,750 1,675 1,400 1,650 1,700 1,450Malaysia 1,400 1,500 1,500 1,500 1,500 1,775Costa Rica 1,675 1,450 1,400 1,400 1,400 565Tanzania 1,180 800 1,150 1,250 1,050 1,000Thailand 1,000 1,000 1,000 1,000 1,000 1,400Papua New Guinea 825 855 810 750 750 750Kenya 660 850 750 650 700 735Cameroon 535 425 575 625 625 450Laos 460 475 485 525 550 1,200El Salvador 1,250 550 700 475 525 455Philippines 455 450 475 475 475 550Madagascar 525 550 500 255 425 4,712Other 3,828 3,258 3,085 3,212 3,102 145,122Total 156,618 157,778 153,255 153,292 155,697 Coffee marketing year for producer countries begins either in October (Colombia), April (Indonesia) or July (Brazil), as examples. Coffee marketing year for non-producer countries begins in October. To access a complete dataset for each country, please visit: http://apps.fas.usda.gov/psdonline/psdQuery.aspx Foreign Agricultural Service/USDA June 2016 Office of Global Analysis
  • 7. Coffee Summary, Continued Thousand 60-Kilogram Bags 2011/12 2012/13 2013/14 2014/15 2015/16 Jun 2016/17 Bean Exports none 26,556Brazil 27,143 30,600 33,051 32,720 32,000 23,950Vietnam 23,783 27,269 19,791 26,000 25,150 6,675Colombia 8,100 10,300 11,615 11,400 11,500 4,950Indonesia 6,900 6,000 6,770 8,000 6,100 5,290Honduras 4,480 3,940 4,760 5,200 5,700 3,000Uganda 3,575 3,600 3,400 4,000 4,000 3,735India 3,420 3,330 3,390 3,800 3,600 5,140Peru 4,100 4,100 2,750 3,275 3,600 3,140Ethiopia 3,500 3,285 3,500 3,520 3,525 3,800Guatemala 3,750 3,150 3,050 3,000 3,000 15,237Other 14,852 12,018 11,732 11,950 11,720 101,473Total 103,603 107,592 103,809 112,865 109,895 Roast and Ground Exports none 960European Union 1,070 1,185 1,220 1,200 1,000 680Switzerland 810 890 975 950 950 95Vietnam 110 120 457 550 550 38China 63 87 70 275 250 405United States 365 580 390 250 200 50Mexico 126 105 175 125 125 75Colombia 85 80 90 90 90 15Panama 15 31 47 45 45 25Indonesia 35 40 50 40 40 51Brazil 31 30 28 30 30 29Other 29 80 46 30 40 2,423Total 2,739 3,228 3,548 3,585 3,320 Soluble Exports none 3,236Brazil 3,486 3,516 3,494 3,250 3,200 1,950Malaysia 2,150 2,110 2,780 2,800 3,000 2,500Indonesia 2,000 1,800 1,900 1,920 1,800 1,484India 1,435 1,667 1,496 1,500 1,500 1,235Thailand 1,700 2,100 1,975 1,500 1,500 450Vietnam 750 900 1,282 1,500 1,500 610Colombia 670 660 715 750 800 204China 239 315 471 650 700 790Mexico 915 940 835 600 600 975Ecuador 1,075 810 760 740 500 720Other 765 898 680 835 740 14,154Total 15,185 15,716 16,388 16,045 15,840 Exports none 29,843Brazil 30,660 34,146 36,573 36,000 35,230 24,495Vietnam 24,643 28,289 21,530 28,050 27,200 7,360Colombia 8,855 11,040 12,420 12,240 12,390 7,475Indonesia 8,935 7,840 8,720 9,960 7,940 5,290Honduras 4,480 3,940 4,760 5,200 5,700 5,223India 4,858 5,013 4,897 5,305 5,105 3,000Uganda 3,575 3,600 3,400 4,000 4,000 5,140Peru 4,100 4,100 2,750 3,275 3,600 3,140Ethiopia 3,500 3,285 3,500 3,520 3,525 3,840Guatemala 3,770 3,175 3,070 3,010 3,010 23,244Other 24,151 22,108 22,125 21,935 21,355 118,050Total 121,527 126,536 123,745 132,495 129,055 Coffee marketing year for producer countries begins either in October (Colombia), April (Indonesia) or July (Brazil), as examples. Coffee marketing year for non-producer countries begins in October. Roasted coffee was converted to green bean equivalent by multiplying the net weight of roasted coffee by 1.19. Soluble coffee was converted to green bean equivalent by multiplying the net weight of soluble coffee by 2.6. For each non-producing country, the trade balance between imports and exports is used in order to avoid double-counting for these figures. Foreign Agricultural Service/USDA June 2016 Office of Global Analysis
  • 8. Coffee Summary, Continued Thousand 60-Kilogram Bags 2011/12 2012/13 2013/14 2014/15 2015/16 Jun 2016/17 Bean Imports none 43,950European Union 45,070 44,650 45,110 45,000 44,500 23,700United States 23,360 24,550 23,525 24,500 24,550 5,965Japan 7,520 6,890 7,150 7,420 7,375 2,225Canada 2,330 2,525 2,450 2,600 2,600 2,140Switzerland 2,310 2,300 2,420 2,450 2,500 1,720Russia 2,050 2,280 2,240 2,400 2,300 1,675Korea, South 1,715 2,035 2,150 2,200 2,275 2,240Algeria 1,915 2,265 2,165 2,200 2,250 1,125Malaysia 1,375 1,270 1,880 1,900 2,100 1,125Mexico 850 1,360 1,440 1,550 1,600 12,478Other 13,412 12,580 12,567 12,655 12,235 98,343Total 101,907 102,705 103,097 104,875 104,285 Roast and Ground Imports none 780Canada 675 730 765 500 600 74China 79 93 141 300 300 165Russia 180 215 260 250 275 310Ukraine 340 340 275 275 250 155Australia 170 180 190 175 200 110Korea, South 110 125 155 170 175 125Japan 135 140 110 115 125 105Norway 110 110 120 120 120 25Mexico 55 64 70 75 75 45Taiwan 55 50 70 85 75 224Other 277 342 378 211 229 2,118Total 2,186 2,389 2,534 2,276 2,424 Soluble Imports none 2,770Philippines 3,400 3,025 3,660 4,500 4,000 1,980Russia 1,900 1,735 1,550 1,800 1,800 396China 615 791 984 1,500 1,500 1,165Canada 1,225 1,350 1,280 1,100 1,200 590Japan 750 840 815 800 825 470Indonesia 630 555 720 650 700 125United States 340 365 485 450 450 1,000Ukraine 785 690 570 400 400 240Argentina 260 260 250 270 250 310Australia 310 250 275 260 250 2,119Other 2,100 2,288 1,992 2,166 2,181 11,165Total 12,315 12,149 12,581 13,896 13,556 Imports none 43,950European Union 45,070 44,650 45,110 45,000 44,500 23,825United States 23,700 24,915 24,010 24,950 25,000 6,680Japan 8,405 7,870 8,075 8,335 8,325 4,170Canada 4,230 4,605 4,495 4,200 4,400 3,865Russia 4,130 4,230 4,050 4,450 4,375 3,280Philippines 3,880 3,185 3,845 5,000 4,300 1,093China 1,624 1,794 2,015 2,725 2,750 2,140Switzerland 2,310 2,300 2,420 2,450 2,500 1,785Korea, South 1,825 2,160 2,305 2,370 2,450 2,270Algeria 1,945 2,300 2,195 2,230 2,280 18,568Other 19,289 19,234 19,692 19,337 19,385 111,626Total 116,408 117,243 118,212 121,047 120,265 Coffee marketing year for producer countries begins either in October (Colombia), April (Indonesia) or July (Brazil), as examples. Coffee marketing year for non-producer countries begins in October. Roasted coffee was converted to green bean equivalent by multiplying the net weight of roasted coffee by 1.19. Soluble coffee was converted to green bean equivalent by multiplying the net weight of soluble coffee by 2.6. For each non-producing country, the trade balance between imports and exports is used in order to avoid double-counting for these figures. Foreign Agricultural Service/USDA June 2016 Office of Global Analysis
  • 9. Coffee Summary, Continued Thousand 60-Kilogram Bags 2011/12 2012/13 2013/14 2014/15 2015/16 Jun 2016/17 Domestic Consumption none 45,250European Union 43,275 41,475 43,820 43,100 43,900 22,946United States 23,027 23,811 23,573 24,767 25,150 20,025Brazil 20,110 20,210 20,420 20,500 20,520 7,050Japan 7,565 7,750 7,825 8,285 8,325 3,660Philippines 4,405 3,630 4,320 5,475 4,775 4,170Canada 4,230 4,605 4,495 4,200 4,400 3,865Russia 4,130 4,230 4,050 4,450 4,375 2,355Indonesia 2,635 2,750 3,040 2,750 3,110 1,045China 1,621 2,195 2,463 2,850 3,000 3,050Ethiopia 3,130 3,120 2,985 2,972 2,975 1,665Vietnam 1,825 2,008 2,217 2,600 2,868 1,785Korea, South 1,825 2,160 2,305 2,370 2,450 2,287Mexico 2,170 2,731 2,364 2,315 2,350 2,270Algeria 1,945 2,300 2,195 2,230 2,280 1,600Australia 1,660 1,615 1,775 1,810 1,800 1,460Switzerland 1,500 1,410 1,445 1,500 1,550 1,260Colombia 1,200 1,300 1,400 1,425 1,475 1,168India 1,100 1,170 1,270 1,350 1,400 1,305Venezuela 1,290 1,170 1,151 1,151 1,031 1,425Ukraine 1,255 1,155 1,025 875 825 750Argentina 835 685 710 810 785 760Norway 740 775 775 785 775 375Turkey 490 505 670 740 750 755Serbia 740 790 605 575 650 715Morocco 705 620 635 640 640 8,669Other 8,544 8,626 8,454 8,565 8,647 141,665Total 141,952 142,796 145,987 149,090 150,806 Ending Stocks none 10,400European Union 10,845 12,400 12,225 12,500 11,800 5,100United States 5,450 6,025 6,117 6,100 5,800 1,090Vietnam 1,946 2,130 6,373 5,653 3,500 2,140Japan 2,980 3,100 3,350 3,400 3,400 2,238Brazil 9,068 11,946 9,305 2,265 2,530 1,473India 1,982 2,026 2,501 2,289 1,997 90Honduras 140 300 340 500 560 249Colombia 771 961 666 826 486 45Tanzania 255 202 322 302 272 252Nicaragua 17 22 102 97 182 2,596Other 1,766 1,797 1,343 1,466 972 25,673Total 35,220 40,909 42,644 35,398 31,499 Coffee marketing year for producer countries begins either in October (Colombia), April (Indonesia) or July (Brazil), as examples. Coffee marketing year for non-producer countries begins in October. Foreign Agricultural Service/USDA June 2016 Office of Global Analysis