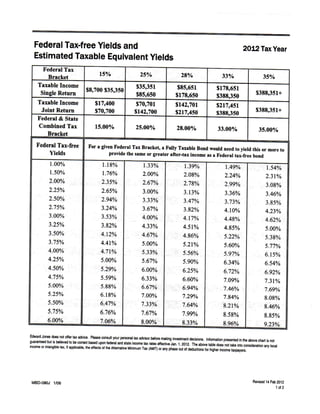
1. Federal Tax-free Yields and 2012 Tax Year
Estimated Taxable Equivalent Yields
Federal Tax 15% 25% 28%
Bracket 33% 35%
Taxable Income $8,700 $35,350 $35,351 $85,651 $178,651
Single Return $85,650 $178,650 $388,350 $388,351+
Taxable Income $17,400 $70,701 $142,701 $217,451
Joint Return $70,700 $142,700 $217,450 $388,350 $388,351+
Federal & State
Combined Tax 15.00% 25.00% 28.00% 33.00% 35.00%
Bracket
Federal Tax-free For a given Federal Tax Bracket, a Fully Taxable Bon i would need to yieId this or more to
Yields provide the same or greater after-tax income as a Federal tax-free bond
1.00% 1.18% 1.33% 1.39% 1.49% 1.54%
1.50% 1.76% 2.00% 2.08% 2.24% 2.31%
2.00% 2.35% 2.67% i 2.78% 2.99% 3.08%
2.25% 2.65% 3.00% 3.13% 3.36% 3.46%
•2.50% 2.94% 3.33% 3.47% 3.73% 3.85%
2.75% 3.24% 3.67% 3.82% 4.10% 4.23%
3.00% 3.53% 4.00% 4.17% 4.48% 4.62%
3.25% 3.82% 4.33% 4.51% 4.85% 5.00%
3.50% 4.12% 4.67% 4.86% 5.22% 5.38%
3.75% 4.41% 5.00% 5.21% 5.60% 5.77%
; 4.00% 4.71% 5.33% 5.56% 5.97% 6.15%
4.25% 5.00% 5.67% 5.90% 6.34% 6.54%
4.50% 5.29% 6.00% 6.25% 6.72% 6.92%
4.75% 5.59% 6.33% 6.60% 7.09% 7.31%
5.00% 5.88% 6.67% : 6.94% 7.46%, 7.69%
5.25% 6.18% 7.00% 7.29% 7.84% 8.08%
; 5.50% 6.47% 7.33% 7.64% 8.21% 8.46%
5.75% 6.76% 7.67% 7.99% 8.58% 8.85%
1 6.00% 7.06% 8.00% 8.33% 8.96% 9.23%
Edward Jones does not offer tax advice. Please consult your personal tax advisor before making investment decisions. Information presented in the above chart is not
guaranteed but is believed to be correct based upon federal and state income tax rates effective Jan. 1, 2012. The above table does not take into consideration any tocal
income or intangible tax, if applicable, the effects of the Alternative l(/linimum Tax (AMT) or any phase out of deductions for higher income taxpayers.
Revised 14 Feb 2012
I^BD-080J 1/06
1 of 2