SlideShare ist ein Scribd-Unternehmen logo
1 von 3
Downloaden Sie, um offline zu lesen
Selected Company Metrics and Financials
(in millions) FY 2014
Q1'12 Q2'12 Q3'12 Q4'12 Q1'13 Q2'13 Q3'13 Q4'13 Q1'14 FY2012 FY2013
Company Metrics
Monthly Active Users: Worldwide 138 151 167 185 204 218 232 241 255 185 241
QoQ% 18% 10% 10% 11% 10% 7% 6% 4% 6%
YoY% 102% 79% 65% 59% 48% 44% 39% 30% 25% 59% 30%
Monthly Active Users: United States 34 37 40 45 48 49 53 54 57 45 54
QoQ% 14% 7% 11% 10% 7% 3% 7% 3% 5%
YoY% 81% 63% 50% 50% 40% 35% 30% 21% 19% 50% 21%
Monthly Active Users: International 104 114 127 140 156 169 179 187 198 140 187
QoQ% 20% 11% 10% 11% 12% 8% 6% 4% 6%
YoY% 110% 84% 71% 62% 51% 47% 41% 33% 27% 62% 33%
Timeline Views: Worldwide 71,019 89,451 106,067 117,485 136,329 150,899 158,758 147,783 156,713 384,022 593,769
QoQ% N/A 26% 19% 11% 16% 11% 5% ‐7% 6%
YoY% N/A N/A N/A N/A 92% 69% 50% 26% 15% N/A 55%
Timeline Views: United States 23,070 27,925 32,554 35,914 39,541 40,614 43,169 40,924 45,805 119,462 164,247
QoQ% N/A 21% 17% 10% 10% 3% 6% ‐5% 12%
YoY% N/A N/A N/A N/A 71% 45% 33% 14% 16% N/A 37%
Timeline Views: International 47,949 61,526 73,513 81,571 96,788 110,285 115,589 106,859 110,908 264,560 429,522
QoQ% N/A 28% 19% 11% 19% 14% 5% ‐8% 4%
YoY% N/A N/A N/A N/A 102% 79% 57% 31% 15% N/A 62%
FY 2012 FY 2013
1 of 3
Timeline Views per MAU: Worldwide 516 591 635 635 668 691 685 613 614 2,077 2,465
QoQ% N/A 15% 7% 0% 5% 4% ‐1% ‐10% 0%
YoY% N/A N/A N/A N/A 29% 17% 8% ‐3% ‐8% N/A 19%
Timeline Views per MAU: United States 677 763 804 803 828 825 819 756 804 2,673 3,033
QoQ% N/A 13% 5% 0% 3% 0% ‐1% ‐8% 6%
YoY% N/A N/A N/A N/A 22% 8% 2% ‐6% ‐3% N/A 13%
Timeline Views per MAU: International 463 536 580 582 619 652 646 572 560 1,887 2,300
QoQ% N/A 16% 8% 0% 6% 5% ‐1% ‐11% ‐2%
YoY% N/A N/A N/A N/A 34% 22% 11% ‐2% ‐10% N/A 22%
Ad Rev per 1000 Timeline Views: Worldwide $0.63 $0.64 $0.65 $0.85 $0.74 $0.80 $0.97 $1.49 $1.44 $0.70 $1.00
QoQ% N/A 1% 2% 31% ‐13% 9% 21% 54% ‐3%
YoY% N/A N/A N/A N/A 18% 26% 49% 76% 96% N/A 43%
Ad Rev per 1000 Timeline Views: United States $1.70 $1.72 $1.72 $2.20 $1.95 $2.17 $2.58 $3.80 $3.47 $1.86 $2.63
QoQ% N/A 1% 0% 28% ‐11% 11% 19% 47% ‐9%
YoY% N/A N/A N/A N/A 15% 26% 50% 73% 78% N/A 41%
Ad Rev per 1000 Timeline Views: International $0.11 $0.14 $0.17 $0.25 $0.24 $0.30 $0.36 $0.60 $0.61 $0.18 $0.38
QoQ% N/A 29% 20% 47% ‐4% 25% 21% 65% 1%
YoY% N/A N/A N/A N/A 118% 111% 112% 139% 152% N/A 112%
1 of 3
Selected Company Metrics and Financials
($ in 000's) FY2014
Q1'12 Q2'12 Q3'12 Q4'12 Q1'13 Q2'13 Q3'13 Q4'13 Q1'14 FY2012 FY2013
Revenue Mix
GAAP Revenue (Worldwide) 54,313 68,046 82,327 112,247 114,343 139,292 168,580 242,675 250,492 316,933 664,890
QoQ% 32% 25% 21% 36% 2% 22% 21% 44% 3%
YoY% 203% 228% 212% 172% 111% 105% 105% 116% 119% 198% 110%
Advertising Revenue 44,500 56,802 68,665 99,454 100,460 120,972 153,437 219,677 226,051 269,421 594,546
QoQ% 37% 28% 21% 45% 1% 20% 27% 43% 3%
YoY% 285% 317% 244% 205% 126% 113% 123% 121% 125% 247% 121%
Data Licensing & Other 9,813 11,244 13,662 12,793 13,883 18,320 15,143 22,998 24,441 47,512 70,344
QoQ% 14% 15% 22% ‐6% 9% 32% ‐17% 52% 6%
YoY% 55% 57% 111% 48% 41% 63% 11% 80% 76% 66% 48%
GAAP Revenue (United States) 48,324 58,363 66,940 90,290 89,416 101,383 124,687 176,834 180,039 263,917 492,320
QoQ% 30% 21% 15% 35% ‐1% 13% 23% 42% 2%
YoY% 170% 181% 153% 143% 85% 74% 86% 96% 101% 158% 87%
% of Total GAAP Revenue 89% 86% 81% 80% 78% 73% 74% 73% 72% 83% 74%
GAAP Revenue (International) 5,989 9,683 15,387 21,957 24,927 37,909 43,893 65,841 70,453 53,016 172,570
QoQ% 47% 62% 59% 43% 14% 52% 16% 50% 7%
YoY% N/A N/A N/A 437% 316% 292% 185% 200% 183% 1197% 226%
% of Total GAAP Revenue 11% 14% 19% 20% 22% 27% 26% 27% 28% 17% 26%
GAAP P&L
GAAP Revenue 54,313 68,046 82,327 112,247 114,343 139,292 168,580 242,675 250,492 316,933 664,890
Cost of revenue 27,629 30,528 33,693 36,918 41,255 50,573 62,239 112,651 85,503 128,768 266,718
Research and development 18,976 27,369 32,319 40,340 47,574 64,263 87,307 394,848 149,391 119,004 593,992
FY 2012 FY 2013
p
Sales and marketing 14,450 19,655 23,662 28,784 32,439 45,258 61,214 177,305 106,235 86,551 316,216
General and administrative 13,389 17,369 13,954 14,981 16,982 18,114 21,152 67,547 38,734 59,693 123,795
Loss from Operations (20,131) (26,875) (21,301) (8,776) (23,907) (38,916) (63,332) (509,676) (129,371) (77,083) (635,831)
Interest Income (expense), net (377) (513) (766) (830) (1,233) (1,513) (1,727) (2,387) (2,567) (2,486) (6,860)
Other Income (expense), net (259) 247 938 (527) (1,529) (1,019) 818 (2,725) 798 399 (4,455)
Provision (benefit) for Income Taxes 754 442 461 (1,428) 357 777 360 (3,317) 1,222 229 (1,823)
Net Loss (21,521) (27,583) (21,590) (8,705) (27,026) (42,225) (64,601) (511,471) (132,362) (79,399) (645,323)
Non‐GAAP Financial Data
Adjusted EBITDA (875) 1,545 2,923 17,571 11,745 9,647 9,293 44,745 36,949 21,164 75,430
Adjusted EBITDA margin ‐2% 2% 4% 16% 10% 7% 6% 18% 15% 7% 11%
Non‐GAAP Net Income (loss) (11,369) (10,863) (12,688) (271) (10,524) (16,364) (17,216) 9,774 183 (35,191) (34,330)
Selected Balance Sheet Data
Cash, Cash Equivalents and Short‐term Investments 527,973 481,981 446,592 424,856 403,467 375,058 321,075 2,234,054 2,176,595 424,856 2,234,054
Working Capital 513,974 479,719 446,529 444,587 422,137 382,820 331,997 2,349,249 2,244,129 444,587 2,349,249
Property and Equipment, net 91,210 132,383 173,944 185,574 213,821 242,553 284,024 332,662 383,272 185,574 332,662
Total Stockholders' Equity (deficit) (219,193) (238,923) (256,638) (248,172) (151,509) (164,375) (178,661) 2,950,006 2,936,846 (248,172) 2,950,006
Selected Cash Flow and Supplemental Disclosures
Cash Flows from operating activities (9,961) (13,033) (10,303) 5,362 2,615 7,044 (5,393) (2,868) 42,683 (27,935) 1,398
Cash Flows from investing activities (29,467) (9,178) 73,042 15,046 (77,146) 54,672 13,591 (1,297,183) 112,963 49,443 (1,306,066)
Cash Flows from financing activities (6,146) (8,005) (10,897) (12,076) (9,919) (15,451) (18,060) 1,985,606 (36,473) (37,124) 1,942,176
Purchases of property and equipment (7,608) (18,925) (13,555) (10,511) (11,622) (15,139) (19,867) (29,116) (49,620) (50,599) (75,744)
Equipment purchases under capital leases 13,707 27,724 38,029 30,746 29,986 28,771 36,743 60,222 16,957 110,206 155,722
2 of 3
Selected Company Metrics and Financials
($ in 000's) FY2014
Q1'12 Q2'12 Q3'12 Q4'12 Q1'13 Q2'13 Q3'13 Q4'13 Q1'14 FY2012 FY2013
Reconciliation of Net Loss to Adjusted EBITDA
Net Loss (21,521) (27,583) (21,590) (8,705) (27,026) (42,225) (64,601) (511,471) (132,362) (79,399) (645,323)
Stock‐based Compensation Expense 5,227 10,900 4,268 5,346 12,922 22,646 43,602 521,197 126,369 25,741 600,367
Depreciation and amortization expense 14,029 17,520 19,956 21,001 22,730 25,917 29,023 33,224 39,951 72,506 110,894
Interest and other expense (income) 636 266 (172) 1,357 2,762 2,532 909 5,112 1,769 2,087 11,315
Provision (benefit) for income taxes 754 442 461 (1,428) 357 777 360 (3,317) 1,222 229 (1,823)
Adjusted EBITDA (875) 1,545 2,923 17,571 11,745 9,647 9,293 44,745 36,949 21,164 75,430
Reconciliation of Net Loss to Non‐GAAP Net Income (Loss)
Net Loss (21,521) (27,583) (21,590) (8,705) (27,026) (42,225) (64,601) (511,471) (132,362) (79,399) (645,323)
   Stock‐based Compensation Expense 5,227 10,900 4,268 5,346 12,922 22,646 43,602 521,197 126,369 25,741 600,367
   Amortization of acquired intangible assets 4,435 5,820 4,634 3,798 3,876 3,302 3,783 5,569 6,176 18,687 16,530
   Income tax effects related to acquisitions 490 0 0 (710) (296) (87) 0 (5,521) 0 (220) (5,904)
Non‐GAAP Net Income (Loss) (11,369) (10,863) (12,688) (271) (10,524) (16,364) (17,216) 9,774 183 (35,191) (34,330)
Stock‐based Compensation Expense by function
Total Stock‐based Compensation Expense 5,227 10,900 4,268 5,346 12,922 22,646 43,602 521,197 126,369 25,741 600,367
Cost of revenue 220 200 198 182 484 1,471 3,060 45,927 9,831 800 50,942
Research and development 2,165 4,126 2,722 3,609 8,425 15,772 29,180 326,536 78,318 12,622 379,913
Sales and marketing 307 313 365 361 2,065 2,549 5,742 104,084 27,801 1,346 114,440
General and administrative 2,535 6,261 983 1,194 1,948 2,854 5,620 44,650 10,419 10,973 55,072
FY 2012 FY 2013
3 of 33 of 3

Weitere ähnliche Inhalte

Was ist angesagt?

Epic research singapore daily sgx singapore report of 02 july 2015
Epic research singapore   daily sgx singapore report of 02 july 2015Epic research singapore   daily sgx singapore report of 02 july 2015
Epic research singapore daily sgx singapore report of 02 july 2015
Epic Research Singapore
 

Was ist angesagt? (20)

Gold Demand Trends FY 2016 data table
Gold Demand Trends FY 2016 data tableGold Demand Trends FY 2016 data table
Gold Demand Trends FY 2016 data table
 
EPIC RESEARCH SINGAPORE - Daily SGX Singapore report of 05 March 2015
EPIC RESEARCH SINGAPORE - Daily SGX Singapore report of 05 March 2015EPIC RESEARCH SINGAPORE - Daily SGX Singapore report of 05 March 2015
EPIC RESEARCH SINGAPORE - Daily SGX Singapore report of 05 March 2015
 
EPIC RESEARCH SINGAPORE - Daily SGX Singapore report of 24 June 2015
EPIC RESEARCH SINGAPORE - Daily SGX Singapore report of 24 June 2015EPIC RESEARCH SINGAPORE - Daily SGX Singapore report of 24 June 2015
EPIC RESEARCH SINGAPORE - Daily SGX Singapore report of 24 June 2015
 
EPIC RESEARCH SINGAPORE - Daily SGX Singapore report of 04 March 2015
EPIC RESEARCH SINGAPORE - Daily SGX Singapore report of 04 March 2015EPIC RESEARCH SINGAPORE - Daily SGX Singapore report of 04 March 2015
EPIC RESEARCH SINGAPORE - Daily SGX Singapore report of 04 March 2015
 
EPIC RESEARCH SINGAPORE - Daily SGX Singapore report of 05 February 2016
EPIC RESEARCH SINGAPORE - Daily SGX Singapore report of 05 February 2016EPIC RESEARCH SINGAPORE - Daily SGX Singapore report of 05 February 2016
EPIC RESEARCH SINGAPORE - Daily SGX Singapore report of 05 February 2016
 
Epic research singapore daily sgx singapore report of 22 june 2015
Epic research singapore   daily sgx singapore report of 22 june 2015Epic research singapore   daily sgx singapore report of 22 june 2015
Epic research singapore daily sgx singapore report of 22 june 2015
 
EPIC RESEARCH SINGAPORE - Daily SGX Singapore report of 10 June 2015
EPIC RESEARCH SINGAPORE - Daily SGX Singapore report of 10 June 2015EPIC RESEARCH SINGAPORE - Daily SGX Singapore report of 10 June 2015
EPIC RESEARCH SINGAPORE - Daily SGX Singapore report of 10 June 2015
 
Epic research singapore daily sgx singapore report of 02 july 2015
Epic research singapore   daily sgx singapore report of 02 july 2015Epic research singapore   daily sgx singapore report of 02 july 2015
Epic research singapore daily sgx singapore report of 02 july 2015
 
EPIC RESEARCH SINGAPORE - Daily SGX Singapore report of 28 April 2016
EPIC RESEARCH SINGAPORE - Daily SGX Singapore report of 28 April 2016EPIC RESEARCH SINGAPORE - Daily SGX Singapore report of 28 April 2016
EPIC RESEARCH SINGAPORE - Daily SGX Singapore report of 28 April 2016
 
EPIC RESEARCH SINGAPORE - Daily SGX Singapore report of 25 May 2015
EPIC RESEARCH SINGAPORE - Daily SGX Singapore report of 25 May 2015EPIC RESEARCH SINGAPORE - Daily SGX Singapore report of 25 May 2015
EPIC RESEARCH SINGAPORE - Daily SGX Singapore report of 25 May 2015
 
EPIC RESEARCH SINGAPORE - Daily SGX Singapore report of 17 March 2016
EPIC RESEARCH SINGAPORE - Daily SGX Singapore report of 17 March 2016EPIC RESEARCH SINGAPORE - Daily SGX Singapore report of 17 March 2016
EPIC RESEARCH SINGAPORE - Daily SGX Singapore report of 17 March 2016
 
EPIC RESEARCH SINGAPORE - Daily SGX Singapore report of 03 February 2016
EPIC RESEARCH SINGAPORE - Daily SGX Singapore report of 03 February 2016EPIC RESEARCH SINGAPORE - Daily SGX Singapore report of 03 February 2016
EPIC RESEARCH SINGAPORE - Daily SGX Singapore report of 03 February 2016
 
EPIC RESEARCH SINGAPORE - Daily SGX Singapore report of 27 August 2015
EPIC RESEARCH SINGAPORE - Daily SGX Singapore report of 27 August 2015EPIC RESEARCH SINGAPORE - Daily SGX Singapore report of 27 August 2015
EPIC RESEARCH SINGAPORE - Daily SGX Singapore report of 27 August 2015
 
EPIC RESEARCH SINGAPORE - Daily SGX Singapore report of 18 June 2015
EPIC RESEARCH SINGAPORE - Daily SGX Singapore report of 18 June 2015EPIC RESEARCH SINGAPORE - Daily SGX Singapore report of 18 June 2015
EPIC RESEARCH SINGAPORE - Daily SGX Singapore report of 18 June 2015
 
EPIC RESEARCH SINGAPORE - Daily SGX Singapore report of 12 February 2016
EPIC RESEARCH SINGAPORE - Daily SGX Singapore report of 12 February 2016EPIC RESEARCH SINGAPORE - Daily SGX Singapore report of 12 February 2016
EPIC RESEARCH SINGAPORE - Daily SGX Singapore report of 12 February 2016
 
EPIC RESEARCH SINGAPORE - Daily SGX Singapore report of 10 February 2016
EPIC RESEARCH SINGAPORE - Daily SGX Singapore report of 10 February 2016EPIC RESEARCH SINGAPORE - Daily SGX Singapore report of 10 February 2016
EPIC RESEARCH SINGAPORE - Daily SGX Singapore report of 10 February 2016
 
EPIC RESEARCH SINGAPORE - Daily SGX Singapore report of 24 March 2016
EPIC RESEARCH SINGAPORE - Daily SGX Singapore report of 24 March 2016EPIC RESEARCH SINGAPORE - Daily SGX Singapore report of 24 March 2016
EPIC RESEARCH SINGAPORE - Daily SGX Singapore report of 24 March 2016
 
EPIC RESEARCH SINGAPORE - Daily SGX Singapore report of 19 February 2016
EPIC RESEARCH SINGAPORE - Daily SGX Singapore report of 19 February 2016EPIC RESEARCH SINGAPORE - Daily SGX Singapore report of 19 February 2016
EPIC RESEARCH SINGAPORE - Daily SGX Singapore report of 19 February 2016
 
Conference Call 2Q15
Conference Call 2Q15Conference Call 2Q15
Conference Call 2Q15
 
EPIC RESEARCH SINGAPORE - Daily SGX Singapore report of 23 February 2016
EPIC RESEARCH SINGAPORE - Daily SGX Singapore report of 23 February 2016EPIC RESEARCH SINGAPORE - Daily SGX Singapore report of 23 February 2016
EPIC RESEARCH SINGAPORE - Daily SGX Singapore report of 23 February 2016
 

Andere mochten auch

Cuestionario niños primero
Cuestionario niños primeroCuestionario niños primero
Cuestionario niños primero
onceuno
 
предприниматели и социальные медиа
предприниматели и социальные медиапредприниматели и социальные медиа
предприниматели и социальные медиа
SMM-щик
 
Smm для медицинского центра академия здоровья
Smm для медицинского центра академия здоровьяSmm для медицинского центра академия здоровья
Smm для медицинского центра академия здоровья
SMM-щик
 
New York Times Report on Innovation and Disruption in the Publishing Industry
New York Times Report on Innovation and Disruption in the Publishing IndustryNew York Times Report on Innovation and Disruption in the Publishing Industry
New York Times Report on Innovation and Disruption in the Publishing Industry
lonelybrand
 
Twitter Q1 2014 Investor Presentation - First Ever TWTR Public Quarterly Results
Twitter Q1 2014 Investor Presentation - First Ever TWTR Public Quarterly ResultsTwitter Q1 2014 Investor Presentation - First Ever TWTR Public Quarterly Results
Twitter Q1 2014 Investor Presentation - First Ever TWTR Public Quarterly Results
lonelybrand
 
Effectiveness of Hallux Valgus Strap: A Prospective, Randomized Single-Blinde...
Effectiveness of Hallux Valgus Strap: A Prospective, Randomized Single-Blinde...Effectiveness of Hallux Valgus Strap: A Prospective, Randomized Single-Blinde...
Effectiveness of Hallux Valgus Strap: A Prospective, Randomized Single-Blinde...
Chuenchom Chueluecha
 
Twitter Powerpoint
Twitter PowerpointTwitter Powerpoint
Twitter Powerpoint
szyarto
 
Twitter powerpoint project
Twitter powerpoint projectTwitter powerpoint project
Twitter powerpoint project
JColon624
 

Andere mochten auch (18)

Twitter Q1 2014 Press Release - First Ever TWTR Public Quarterly Results
Twitter Q1 2014 Press Release - First Ever TWTR Public Quarterly ResultsTwitter Q1 2014 Press Release - First Ever TWTR Public Quarterly Results
Twitter Q1 2014 Press Release - First Ever TWTR Public Quarterly Results
 
Cuestionario niños primero
Cuestionario niños primeroCuestionario niños primero
Cuestionario niños primero
 
предприниматели и социальные медиа
предприниматели и социальные медиапредприниматели и социальные медиа
предприниматели и социальные медиа
 
Smm для медицинского центра академия здоровья
Smm для медицинского центра академия здоровьяSmm для медицинского центра академия здоровья
Smm для медицинского центра академия здоровья
 
New York Times Report on Innovation and Disruption in the Publishing Industry
New York Times Report on Innovation and Disruption in the Publishing IndustryNew York Times Report on Innovation and Disruption in the Publishing Industry
New York Times Report on Innovation and Disruption in the Publishing Industry
 
The Blogger's Roadmap: 9 Steps to Building an Editorial Calendar
The Blogger's Roadmap: 9 Steps to Building an Editorial CalendarThe Blogger's Roadmap: 9 Steps to Building an Editorial Calendar
The Blogger's Roadmap: 9 Steps to Building an Editorial Calendar
 
1st prime minister of malaya
1st prime minister of malaya1st prime minister of malaya
1st prime minister of malaya
 
Twitter Q1 2014 Investor Presentation - First Ever TWTR Public Quarterly Results
Twitter Q1 2014 Investor Presentation - First Ever TWTR Public Quarterly ResultsTwitter Q1 2014 Investor Presentation - First Ever TWTR Public Quarterly Results
Twitter Q1 2014 Investor Presentation - First Ever TWTR Public Quarterly Results
 
Effectiveness of Hallux Valgus Strap: A Prospective, Randomized Single-Blinde...
Effectiveness of Hallux Valgus Strap: A Prospective, Randomized Single-Blinde...Effectiveness of Hallux Valgus Strap: A Prospective, Randomized Single-Blinde...
Effectiveness of Hallux Valgus Strap: A Prospective, Randomized Single-Blinde...
 
Twitter 1Q14 Financials
Twitter 1Q14 FinancialsTwitter 1Q14 Financials
Twitter 1Q14 Financials
 
Twitter For Business: A Step By Step
Twitter For Business: A Step By StepTwitter For Business: A Step By Step
Twitter For Business: A Step By Step
 
Twitter Powerpoint
Twitter PowerpointTwitter Powerpoint
Twitter Powerpoint
 
Power Point Twitter
Power Point TwitterPower Point Twitter
Power Point Twitter
 
Twitter powerpoint project
Twitter powerpoint projectTwitter powerpoint project
Twitter powerpoint project
 
Twitter SWOT Analysis
Twitter SWOT AnalysisTwitter SWOT Analysis
Twitter SWOT Analysis
 
Twitter PPT
Twitter PPTTwitter PPT
Twitter PPT
 
How Twitter Changed My Life
How Twitter Changed My LifeHow Twitter Changed My Life
How Twitter Changed My Life
 
Twitter Presentation
Twitter PresentationTwitter Presentation
Twitter Presentation
 

Ähnlich wie Twitter Q1 2014 Selected Company Metrics and Financials - First Ever TWTR Public Quarterly Results

2q15quarterlyresultsdeck 150730180803-lva1-app6892
2q15quarterlyresultsdeck 150730180803-lva1-app68922q15quarterlyresultsdeck 150730180803-lva1-app6892
2q15quarterlyresultsdeck 150730180803-lva1-app6892
Jean Edouard Benois
 
1 Front Page 2 Memo TO.docx
1  Front Page 2  Memo TO.docx1  Front Page 2  Memo TO.docx
1 Front Page 2 Memo TO.docx
karisariddell
 
2 q13 investor presentation
2 q13 investor presentation2 q13 investor presentation
2 q13 investor presentation
BancoABCRI
 
Gafisa 3 q14 teleconf eng vf
Gafisa 3 q14 teleconf  eng vfGafisa 3 q14 teleconf  eng vf
Gafisa 3 q14 teleconf eng vf
Gafisa RI !
 
Gafisa 1 q14 teleconf eng vf (1)
Gafisa 1 q14 teleconf  eng vf (1)Gafisa 1 q14 teleconf  eng vf (1)
Gafisa 1 q14 teleconf eng vf (1)
Gafisa RI !
 
Valuation Of Maruti Suzuki
Valuation Of Maruti SuzukiValuation Of Maruti Suzuki
Valuation Of Maruti Suzuki
Aakash Singh
 
Valuation Of Maruti Suzuki
Valuation Of Maruti SuzukiValuation Of Maruti Suzuki
Valuation Of Maruti Suzuki
Aakash Singh
 
2 q14 arezzo_apresentacao_call eng
2 q14 arezzo_apresentacao_call eng2 q14 arezzo_apresentacao_call eng
2 q14 arezzo_apresentacao_call eng
Arezzori
 

Ähnlich wie Twitter Q1 2014 Selected Company Metrics and Financials - First Ever TWTR Public Quarterly Results (20)

LinkedIn Q2 2015 Earnings Call
LinkedIn Q2 2015 Earnings CallLinkedIn Q2 2015 Earnings Call
LinkedIn Q2 2015 Earnings Call
 
2q15quarterlyresultsdeck 150730180803-lva1-app6892
2q15quarterlyresultsdeck 150730180803-lva1-app68922q15quarterlyresultsdeck 150730180803-lva1-app6892
2q15quarterlyresultsdeck 150730180803-lva1-app6892
 
Q2 results overview 2014
Q2 results overview 2014Q2 results overview 2014
Q2 results overview 2014
 
1 Front Page 2 Memo TO.docx
1  Front Page 2  Memo TO.docx1  Front Page 2  Memo TO.docx
1 Front Page 2 Memo TO.docx
 
2 q13 investor presentation
2 q13 investor presentation2 q13 investor presentation
2 q13 investor presentation
 
Gafisa 3 q14 teleconf eng vf
Gafisa 3 q14 teleconf  eng vfGafisa 3 q14 teleconf  eng vf
Gafisa 3 q14 teleconf eng vf
 
Aksigorta - 2015 Q3 Financial Results Earnings Call Presentation
Aksigorta - 2015 Q3 Financial Results Earnings Call PresentationAksigorta - 2015 Q3 Financial Results Earnings Call Presentation
Aksigorta - 2015 Q3 Financial Results Earnings Call Presentation
 
Conference Call 3Q15
Conference Call 3Q15Conference Call 3Q15
Conference Call 3Q15
 
Conference Call 4Q14
Conference Call 4Q14Conference Call 4Q14
Conference Call 4Q14
 
Gafisa 1 q14 teleconf eng vf (1)
Gafisa 1 q14 teleconf  eng vf (1)Gafisa 1 q14 teleconf  eng vf (1)
Gafisa 1 q14 teleconf eng vf (1)
 
Valuation Of Maruti Suzuki
Valuation Of Maruti SuzukiValuation Of Maruti Suzuki
Valuation Of Maruti Suzuki
 
Valuation Of Maruti Suzuki
Valuation Of Maruti SuzukiValuation Of Maruti Suzuki
Valuation Of Maruti Suzuki
 
MF
MFMF
MF
 
Shc 1 q16_pt_new_eng_f
Shc 1 q16_pt_new_eng_fShc 1 q16_pt_new_eng_f
Shc 1 q16_pt_new_eng_f
 
LinkedIn Q4 2015 Earnings Call
LinkedIn Q4 2015 Earnings CallLinkedIn Q4 2015 Earnings Call
LinkedIn Q4 2015 Earnings Call
 
2015 q3 google_earnings_slides
2015 q3 google_earnings_slides2015 q3 google_earnings_slides
2015 q3 google_earnings_slides
 
Work sample
Work sampleWork sample
Work sample
 
Interplex presentation results_q4_fy15
Interplex presentation results_q4_fy15Interplex presentation results_q4_fy15
Interplex presentation results_q4_fy15
 
2 q14 arezzo_apresentacao_call eng
2 q14 arezzo_apresentacao_call eng2 q14 arezzo_apresentacao_call eng
2 q14 arezzo_apresentacao_call eng
 
Asset Reconstruction Company
Asset Reconstruction CompanyAsset Reconstruction Company
Asset Reconstruction Company
 

Kürzlich hochgeladen

Capstone slidedeck for my capstone project part 2.pdf
Capstone slidedeck for my capstone project part 2.pdfCapstone slidedeck for my capstone project part 2.pdf
Capstone slidedeck for my capstone project part 2.pdf
eliklein8
 
Call Girls in Chattarpur (delhi) call me [9953056974] escort service 24X7
Call Girls in Chattarpur (delhi) call me [9953056974] escort service 24X7Call Girls in Chattarpur (delhi) call me [9953056974] escort service 24X7
Call Girls in Chattarpur (delhi) call me [9953056974] escort service 24X7
9953056974 Low Rate Call Girls In Saket, Delhi NCR
 
DickinsonSlides teeeeeeeeeeessssssssssst.pptx
DickinsonSlides teeeeeeeeeeessssssssssst.pptxDickinsonSlides teeeeeeeeeeessssssssssst.pptx
DickinsonSlides teeeeeeeeeeessssssssssst.pptx
ednyonat
 
Jual Obat Aborsi Palu ( Taiwan No.1 ) 085657271886 Obat Penggugur Kandungan C...
Jual Obat Aborsi Palu ( Taiwan No.1 ) 085657271886 Obat Penggugur Kandungan C...Jual Obat Aborsi Palu ( Taiwan No.1 ) 085657271886 Obat Penggugur Kandungan C...
Jual Obat Aborsi Palu ( Taiwan No.1 ) 085657271886 Obat Penggugur Kandungan C...
ZurliaSoop
 
Capstone slidedeck for my capstone final edition.pdf
Capstone slidedeck for my capstone final edition.pdfCapstone slidedeck for my capstone final edition.pdf
Capstone slidedeck for my capstone final edition.pdf
eliklein8
 

Kürzlich hochgeladen (20)

Generate easy money from tiktok using this simple steps on the book.
Generate easy money from tiktok using this simple steps on the book.Generate easy money from tiktok using this simple steps on the book.
Generate easy money from tiktok using this simple steps on the book.
 
Pondicherry Call Girls Book Now 8617697112 Top Class Pondicherry Escort Servi...
Pondicherry Call Girls Book Now 8617697112 Top Class Pondicherry Escort Servi...Pondicherry Call Girls Book Now 8617697112 Top Class Pondicherry Escort Servi...
Pondicherry Call Girls Book Now 8617697112 Top Class Pondicherry Escort Servi...
 
Finance-and-Operations-in-the-Azure-Cloud.pdf
Finance-and-Operations-in-the-Azure-Cloud.pdfFinance-and-Operations-in-the-Azure-Cloud.pdf
Finance-and-Operations-in-the-Azure-Cloud.pdf
 
Capstone slidedeck for my capstone project part 2.pdf
Capstone slidedeck for my capstone project part 2.pdfCapstone slidedeck for my capstone project part 2.pdf
Capstone slidedeck for my capstone project part 2.pdf
 
Hire↠Young Call Girls in Hari Nagar (Delhi) ☎️ 9205541914 ☎️ Independent Esco...
Hire↠Young Call Girls in Hari Nagar (Delhi) ☎️ 9205541914 ☎️ Independent Esco...Hire↠Young Call Girls in Hari Nagar (Delhi) ☎️ 9205541914 ☎️ Independent Esco...
Hire↠Young Call Girls in Hari Nagar (Delhi) ☎️ 9205541914 ☎️ Independent Esco...
 
BDSM⚡Call Girls in Sector 76 Noida Escorts >༒8448380779 Escort Service
BDSM⚡Call Girls in Sector 76 Noida Escorts >༒8448380779 Escort ServiceBDSM⚡Call Girls in Sector 76 Noida Escorts >༒8448380779 Escort Service
BDSM⚡Call Girls in Sector 76 Noida Escorts >༒8448380779 Escort Service
 
Film show post-production powerpoint for site
Film show post-production powerpoint for siteFilm show post-production powerpoint for site
Film show post-production powerpoint for site
 
Social media marketing/Seo expert and digital marketing
Social media marketing/Seo expert and digital marketingSocial media marketing/Seo expert and digital marketing
Social media marketing/Seo expert and digital marketing
 
SEO Expert in USA - 5 Ways to Improve Your Local Ranking - Macaw Digital.pdf
SEO Expert in USA - 5 Ways to Improve Your Local Ranking - Macaw Digital.pdfSEO Expert in USA - 5 Ways to Improve Your Local Ranking - Macaw Digital.pdf
SEO Expert in USA - 5 Ways to Improve Your Local Ranking - Macaw Digital.pdf
 
Film the city investagation powerpoint :)
Film the city investagation powerpoint :)Film the city investagation powerpoint :)
Film the city investagation powerpoint :)
 
Call Girls in Chattarpur (delhi) call me [9953056974] escort service 24X7
Call Girls in Chattarpur (delhi) call me [9953056974] escort service 24X7Call Girls in Chattarpur (delhi) call me [9953056974] escort service 24X7
Call Girls in Chattarpur (delhi) call me [9953056974] escort service 24X7
 
Ignite Your Online Influence: Sociocosmos - Where Social Media Magic Happens
Ignite Your Online Influence: Sociocosmos - Where Social Media Magic HappensIgnite Your Online Influence: Sociocosmos - Where Social Media Magic Happens
Ignite Your Online Influence: Sociocosmos - Where Social Media Magic Happens
 
College & House wife Call Girls in Paharganj 9634446618 -Best Escort call gi...
College & House wife  Call Girls in Paharganj 9634446618 -Best Escort call gi...College & House wife  Call Girls in Paharganj 9634446618 -Best Escort call gi...
College & House wife Call Girls in Paharganj 9634446618 -Best Escort call gi...
 
Call Girls In South Ex. Delhi O9654467111 Women Seeking Men
Call Girls In South Ex. Delhi O9654467111 Women Seeking MenCall Girls In South Ex. Delhi O9654467111 Women Seeking Men
Call Girls In South Ex. Delhi O9654467111 Women Seeking Men
 
DickinsonSlides teeeeeeeeeeessssssssssst.pptx
DickinsonSlides teeeeeeeeeeessssssssssst.pptxDickinsonSlides teeeeeeeeeeessssssssssst.pptx
DickinsonSlides teeeeeeeeeeessssssssssst.pptx
 
Jual Obat Aborsi Palu ( Taiwan No.1 ) 085657271886 Obat Penggugur Kandungan C...
Jual Obat Aborsi Palu ( Taiwan No.1 ) 085657271886 Obat Penggugur Kandungan C...Jual Obat Aborsi Palu ( Taiwan No.1 ) 085657271886 Obat Penggugur Kandungan C...
Jual Obat Aborsi Palu ( Taiwan No.1 ) 085657271886 Obat Penggugur Kandungan C...
 
Film show pre-production powerpoint for site
Film show pre-production powerpoint for siteFilm show pre-production powerpoint for site
Film show pre-production powerpoint for site
 
Capstone slidedeck for my capstone final edition.pdf
Capstone slidedeck for my capstone final edition.pdfCapstone slidedeck for my capstone final edition.pdf
Capstone slidedeck for my capstone final edition.pdf
 
VIP Call Girls Morena 9332606886 Free Home Delivery 5500 Only
VIP Call Girls Morena 9332606886 Free Home Delivery 5500 OnlyVIP Call Girls Morena 9332606886 Free Home Delivery 5500 Only
VIP Call Girls Morena 9332606886 Free Home Delivery 5500 Only
 
Ready to get noticed? Partner with Sociocosmos
Ready to get noticed? Partner with SociocosmosReady to get noticed? Partner with Sociocosmos
Ready to get noticed? Partner with Sociocosmos
 

Twitter Q1 2014 Selected Company Metrics and Financials - First Ever TWTR Public Quarterly Results

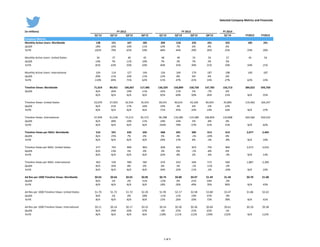
  • 1. Selected Company Metrics and Financials (in millions) FY 2014 Q1'12 Q2'12 Q3'12 Q4'12 Q1'13 Q2'13 Q3'13 Q4'13 Q1'14 FY2012 FY2013 Company Metrics Monthly Active Users: Worldwide 138 151 167 185 204 218 232 241 255 185 241 QoQ% 18% 10% 10% 11% 10% 7% 6% 4% 6% YoY% 102% 79% 65% 59% 48% 44% 39% 30% 25% 59% 30% Monthly Active Users: United States 34 37 40 45 48 49 53 54 57 45 54 QoQ% 14% 7% 11% 10% 7% 3% 7% 3% 5% YoY% 81% 63% 50% 50% 40% 35% 30% 21% 19% 50% 21% Monthly Active Users: International 104 114 127 140 156 169 179 187 198 140 187 QoQ% 20% 11% 10% 11% 12% 8% 6% 4% 6% YoY% 110% 84% 71% 62% 51% 47% 41% 33% 27% 62% 33% Timeline Views: Worldwide 71,019 89,451 106,067 117,485 136,329 150,899 158,758 147,783 156,713 384,022 593,769 QoQ% N/A 26% 19% 11% 16% 11% 5% ‐7% 6% YoY% N/A N/A N/A N/A 92% 69% 50% 26% 15% N/A 55% Timeline Views: United States 23,070 27,925 32,554 35,914 39,541 40,614 43,169 40,924 45,805 119,462 164,247 QoQ% N/A 21% 17% 10% 10% 3% 6% ‐5% 12% YoY% N/A N/A N/A N/A 71% 45% 33% 14% 16% N/A 37% Timeline Views: International 47,949 61,526 73,513 81,571 96,788 110,285 115,589 106,859 110,908 264,560 429,522 QoQ% N/A 28% 19% 11% 19% 14% 5% ‐8% 4% YoY% N/A N/A N/A N/A 102% 79% 57% 31% 15% N/A 62% FY 2012 FY 2013 1 of 3 Timeline Views per MAU: Worldwide 516 591 635 635 668 691 685 613 614 2,077 2,465 QoQ% N/A 15% 7% 0% 5% 4% ‐1% ‐10% 0% YoY% N/A N/A N/A N/A 29% 17% 8% ‐3% ‐8% N/A 19% Timeline Views per MAU: United States 677 763 804 803 828 825 819 756 804 2,673 3,033 QoQ% N/A 13% 5% 0% 3% 0% ‐1% ‐8% 6% YoY% N/A N/A N/A N/A 22% 8% 2% ‐6% ‐3% N/A 13% Timeline Views per MAU: International 463 536 580 582 619 652 646 572 560 1,887 2,300 QoQ% N/A 16% 8% 0% 6% 5% ‐1% ‐11% ‐2% YoY% N/A N/A N/A N/A 34% 22% 11% ‐2% ‐10% N/A 22% Ad Rev per 1000 Timeline Views: Worldwide $0.63 $0.64 $0.65 $0.85 $0.74 $0.80 $0.97 $1.49 $1.44 $0.70 $1.00 QoQ% N/A 1% 2% 31% ‐13% 9% 21% 54% ‐3% YoY% N/A N/A N/A N/A 18% 26% 49% 76% 96% N/A 43% Ad Rev per 1000 Timeline Views: United States $1.70 $1.72 $1.72 $2.20 $1.95 $2.17 $2.58 $3.80 $3.47 $1.86 $2.63 QoQ% N/A 1% 0% 28% ‐11% 11% 19% 47% ‐9% YoY% N/A N/A N/A N/A 15% 26% 50% 73% 78% N/A 41% Ad Rev per 1000 Timeline Views: International $0.11 $0.14 $0.17 $0.25 $0.24 $0.30 $0.36 $0.60 $0.61 $0.18 $0.38 QoQ% N/A 29% 20% 47% ‐4% 25% 21% 65% 1% YoY% N/A N/A N/A N/A 118% 111% 112% 139% 152% N/A 112% 1 of 3
  • 2. Selected Company Metrics and Financials ($ in 000's) FY2014 Q1'12 Q2'12 Q3'12 Q4'12 Q1'13 Q2'13 Q3'13 Q4'13 Q1'14 FY2012 FY2013 Revenue Mix GAAP Revenue (Worldwide) 54,313 68,046 82,327 112,247 114,343 139,292 168,580 242,675 250,492 316,933 664,890 QoQ% 32% 25% 21% 36% 2% 22% 21% 44% 3% YoY% 203% 228% 212% 172% 111% 105% 105% 116% 119% 198% 110% Advertising Revenue 44,500 56,802 68,665 99,454 100,460 120,972 153,437 219,677 226,051 269,421 594,546 QoQ% 37% 28% 21% 45% 1% 20% 27% 43% 3% YoY% 285% 317% 244% 205% 126% 113% 123% 121% 125% 247% 121% Data Licensing & Other 9,813 11,244 13,662 12,793 13,883 18,320 15,143 22,998 24,441 47,512 70,344 QoQ% 14% 15% 22% ‐6% 9% 32% ‐17% 52% 6% YoY% 55% 57% 111% 48% 41% 63% 11% 80% 76% 66% 48% GAAP Revenue (United States) 48,324 58,363 66,940 90,290 89,416 101,383 124,687 176,834 180,039 263,917 492,320 QoQ% 30% 21% 15% 35% ‐1% 13% 23% 42% 2% YoY% 170% 181% 153% 143% 85% 74% 86% 96% 101% 158% 87% % of Total GAAP Revenue 89% 86% 81% 80% 78% 73% 74% 73% 72% 83% 74% GAAP Revenue (International) 5,989 9,683 15,387 21,957 24,927 37,909 43,893 65,841 70,453 53,016 172,570 QoQ% 47% 62% 59% 43% 14% 52% 16% 50% 7% YoY% N/A N/A N/A 437% 316% 292% 185% 200% 183% 1197% 226% % of Total GAAP Revenue 11% 14% 19% 20% 22% 27% 26% 27% 28% 17% 26% GAAP P&L GAAP Revenue 54,313 68,046 82,327 112,247 114,343 139,292 168,580 242,675 250,492 316,933 664,890 Cost of revenue 27,629 30,528 33,693 36,918 41,255 50,573 62,239 112,651 85,503 128,768 266,718 Research and development 18,976 27,369 32,319 40,340 47,574 64,263 87,307 394,848 149,391 119,004 593,992 FY 2012 FY 2013 p Sales and marketing 14,450 19,655 23,662 28,784 32,439 45,258 61,214 177,305 106,235 86,551 316,216 General and administrative 13,389 17,369 13,954 14,981 16,982 18,114 21,152 67,547 38,734 59,693 123,795 Loss from Operations (20,131) (26,875) (21,301) (8,776) (23,907) (38,916) (63,332) (509,676) (129,371) (77,083) (635,831) Interest Income (expense), net (377) (513) (766) (830) (1,233) (1,513) (1,727) (2,387) (2,567) (2,486) (6,860) Other Income (expense), net (259) 247 938 (527) (1,529) (1,019) 818 (2,725) 798 399 (4,455) Provision (benefit) for Income Taxes 754 442 461 (1,428) 357 777 360 (3,317) 1,222 229 (1,823) Net Loss (21,521) (27,583) (21,590) (8,705) (27,026) (42,225) (64,601) (511,471) (132,362) (79,399) (645,323) Non‐GAAP Financial Data Adjusted EBITDA (875) 1,545 2,923 17,571 11,745 9,647 9,293 44,745 36,949 21,164 75,430 Adjusted EBITDA margin ‐2% 2% 4% 16% 10% 7% 6% 18% 15% 7% 11% Non‐GAAP Net Income (loss) (11,369) (10,863) (12,688) (271) (10,524) (16,364) (17,216) 9,774 183 (35,191) (34,330) Selected Balance Sheet Data Cash, Cash Equivalents and Short‐term Investments 527,973 481,981 446,592 424,856 403,467 375,058 321,075 2,234,054 2,176,595 424,856 2,234,054 Working Capital 513,974 479,719 446,529 444,587 422,137 382,820 331,997 2,349,249 2,244,129 444,587 2,349,249 Property and Equipment, net 91,210 132,383 173,944 185,574 213,821 242,553 284,024 332,662 383,272 185,574 332,662 Total Stockholders' Equity (deficit) (219,193) (238,923) (256,638) (248,172) (151,509) (164,375) (178,661) 2,950,006 2,936,846 (248,172) 2,950,006 Selected Cash Flow and Supplemental Disclosures Cash Flows from operating activities (9,961) (13,033) (10,303) 5,362 2,615 7,044 (5,393) (2,868) 42,683 (27,935) 1,398 Cash Flows from investing activities (29,467) (9,178) 73,042 15,046 (77,146) 54,672 13,591 (1,297,183) 112,963 49,443 (1,306,066) Cash Flows from financing activities (6,146) (8,005) (10,897) (12,076) (9,919) (15,451) (18,060) 1,985,606 (36,473) (37,124) 1,942,176 Purchases of property and equipment (7,608) (18,925) (13,555) (10,511) (11,622) (15,139) (19,867) (29,116) (49,620) (50,599) (75,744) Equipment purchases under capital leases 13,707 27,724 38,029 30,746 29,986 28,771 36,743 60,222 16,957 110,206 155,722 2 of 3
  • 3. Selected Company Metrics and Financials ($ in 000's) FY2014 Q1'12 Q2'12 Q3'12 Q4'12 Q1'13 Q2'13 Q3'13 Q4'13 Q1'14 FY2012 FY2013 Reconciliation of Net Loss to Adjusted EBITDA Net Loss (21,521) (27,583) (21,590) (8,705) (27,026) (42,225) (64,601) (511,471) (132,362) (79,399) (645,323) Stock‐based Compensation Expense 5,227 10,900 4,268 5,346 12,922 22,646 43,602 521,197 126,369 25,741 600,367 Depreciation and amortization expense 14,029 17,520 19,956 21,001 22,730 25,917 29,023 33,224 39,951 72,506 110,894 Interest and other expense (income) 636 266 (172) 1,357 2,762 2,532 909 5,112 1,769 2,087 11,315 Provision (benefit) for income taxes 754 442 461 (1,428) 357 777 360 (3,317) 1,222 229 (1,823) Adjusted EBITDA (875) 1,545 2,923 17,571 11,745 9,647 9,293 44,745 36,949 21,164 75,430 Reconciliation of Net Loss to Non‐GAAP Net Income (Loss) Net Loss (21,521) (27,583) (21,590) (8,705) (27,026) (42,225) (64,601) (511,471) (132,362) (79,399) (645,323)    Stock‐based Compensation Expense 5,227 10,900 4,268 5,346 12,922 22,646 43,602 521,197 126,369 25,741 600,367    Amortization of acquired intangible assets 4,435 5,820 4,634 3,798 3,876 3,302 3,783 5,569 6,176 18,687 16,530    Income tax effects related to acquisitions 490 0 0 (710) (296) (87) 0 (5,521) 0 (220) (5,904) Non‐GAAP Net Income (Loss) (11,369) (10,863) (12,688) (271) (10,524) (16,364) (17,216) 9,774 183 (35,191) (34,330) Stock‐based Compensation Expense by function Total Stock‐based Compensation Expense 5,227 10,900 4,268 5,346 12,922 22,646 43,602 521,197 126,369 25,741 600,367 Cost of revenue 220 200 198 182 484 1,471 3,060 45,927 9,831 800 50,942 Research and development 2,165 4,126 2,722 3,609 8,425 15,772 29,180 326,536 78,318 12,622 379,913 Sales and marketing 307 313 365 361 2,065 2,549 5,742 104,084 27,801 1,346 114,440 General and administrative 2,535 6,261 983 1,194 1,948 2,854 5,620 44,650 10,419 10,973 55,072 FY 2012 FY 2013 3 of 33 of 3