14. URL 必须是经过编码的。
('CITY=”New York” 'becames 'CITY%20%3D%20%22New
%20York%22'.)
QueryZoom=Yes 满屏缩放显示由传递的查询表达式选中的要素集。
Extent=Auto 强制客户端获取起点位置和显示范围,代替在
ArcIMSparam.js 文件中设置的起点位置和显示范围。
Use multiple hosts
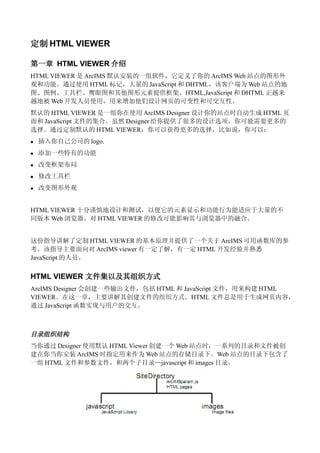
当你想要在一个安装在不同于你存放站点的主机上的服务器上运行你的 ArcIMS 服务时,你
必须采取措施来防止违反 JavaScript 的只允许访问一个主机的安全限制机制。了解更多的信
息,请阅读本指导的第一章中“Multiple Hosts”一节。
Working with an acetate layer
一个薄膜层可以被想象为在地图上面的一个透明的薄膜。一个薄膜层在地图上显示一些辅助
性信息。HTML 客户端包含多个薄膜层用来显示指南针,版权信息文本和比例尺条。你可以
修改这些元素或者添加一些新的元素。
Controlling layers displayer in Legend and LayerList
为防止某些图层在图层列表和图例中显示,在 ArcIMSparam.js 文件中可以设置
hideLayersFromList 为 true。如果该值为 true,则必须在 noListLayer 数组中创建对应元素。
每一个层都必须声明指定一个元素不论其是否会被隐藏显示,元素值从顶层图层开始从 0 开
始递增。
在下面的例子中,第四个图层将不会在图层列表和图例中显示:
// toggle the check of nonlisting of layers in LayerList and Legend
// if true, noListLayer array must have an element defined for each layer
var hideLayersFromList=true
// layers that will not be listed in the LayerList or Legend
// Note: This does not affect map display
var noListLayer = new Array();
noListLayer[0] = false;
noListLayer[1] = false;
noListLayer[2] = false;
noListLayer[3] = true; // this one will not be listed
noListLayer[4] = false;
这个不会影响图层在地图图像的实际显示。
Changing the properties of the North arrow
如果 drawNorthArrow 值为 true 指南针就会显示。可以通过修改
NorthArrowType,NorthArrowCoords,NorthArrowSize,和 NorthArrowAngle 来改变它的样式位
15. 置和尺寸大小。
Changing the properties of the copyright element
如果 drawCopyright 值为 true 则地图上将显示版权信息。通过修改以下变量:CopyrightFont,
CopyrightStyle, CopyrightSize, CopyrightCoords, CopyrightColor, CopyrightBackground,
CopyrightBGColor, CopyrightGlow, CopyrightGlowColor, 和 CopyrightText 来修改文本,格式,
大小等。
Changing the properties of scalebar
如果 drawScaleBar 值为 true 比例尺条便显示。通过修改以下变量:
ScaleBarStyle,ScaleBarFont, ScaleBarFontColor, ScaleBarSize, ScaleBarColor,
ScaleBarBackground, 和 scaleBarBackColor 修改样式,格式,大小和颜色等。
Changing the units of the scalebar
比例尺条的初始单位是在 Designer 中设置的,不过,你可以在 ArcIMSparam.js 文件中修改它
们。ScaleBarUnits 可以被设置为厘米,分米,英尺,英寸,千米,米,英里,海里,英制海
里,美制海里,美制测量英寸,美制测量英尺,美制测量英里,美制测量码,和码。地图单
位可以设为英尺,米,和度。
Adding a new element to an acetate layer
薄膜层是在 aimsXML.js 文件中创建的。这个例子展示了指南针薄膜层的创建。
theString += '<LAYER type=quot;ACETATEquot; name=quot;theNorthArrowquot;>n';
theString += '<OBJECT units=quot;PIXELquot;>n<NORTHARROW type=quot;' + NorthArrowType +
'quot; size=quot;' + NorthArrowSize + 'quot; coord=quot;' + NorthArrowCoords + 'quot;
shadow=quot;32,32,32quot; ';
theString += 'angle=quot;' + NorthArrowAngle + 'quot; antialiasing=quot;Truequot;
overlap=quot;Falsequot; />n</OBJECT>n';
theString += '</LAYER>n';
如果你想添加你自己的元素到某薄膜层,打开 aimscustom.js 文件添加语句到
addCustomToMap1,addCustomToMap2,addCustomToMap3,或者 addCustomToMap4 函数中。它
们之间的区别就是薄膜层的堆放顺序。下面是一个例子:
function addCustomToMap3(){
var customString = quot;quot;;
customString += '<LAYER type=quot;ACETATEquot; name=quot;MyCompanyTextquot;>n';
customString += '<OBJECT units=quot;PIXELquot;>n<TEXT coord=quot;135,' + (iHeight-20) +
'quot;label=quot;Company X rocks!quot;>n';
customString += '<TEXTMARKERSYMBOL fontstyle=quot;BOLDquot; fontsize=quot;12quot;
font=quot;ARIALquot; fontcolor=quot;' + modeMapColor + 'quot; ';
customString += 'threed=quot;TRUEquot; glowing=quot;' + modeMapGlow + 'quot; />n</TEXT>
16. n</OBJECT>n</LAYER>n';
Modifying attribute data display
Limiting the fields displayed
通过改变 selectFields 值为你想显示的字段,来控制选择集,查询,或者 identify 返回字段。
其缺省的值为#ALL#,即显示所有的字段。字段名必须是大写的以匹配在 ArcIMS Spatial
Server 返回的字段名。
由于查询操作是针对某一个激活的图层,你可能需要显示的字段在激活的图层改变时也改变。
如果想开启这项功能,请确认 swqpSelectFields 值为 true。如果 swapSelectFields 值为 true,
那么必须为每一个层创建一个属性名列表。
通过设置 selFieldList 值来为每一层创建一个字段名列表。在该数组中为每一个层赋一个值,
顶层图层的 index 为 0.数组中每一行分配如下:
selFieldList[2] = “NAME #ID# #SHAPE# POP”;
每层都需要一个元素。ID 和 Shape 字段必须包含在列表中并且必须由#包围。这个记号表明
这些字段不包含在数据库之中而是由服务器生成的。Image 层赋值为#ALL#是因为它根本就
没有属性。
一个关于这三个变量赋值的例子可以在第三章“HTML Viewer JavaScript Library”中找到。
Hiding display of ID and Shape field
Id 和 Shape 字段默认是显示在通过 Identify 或者 Query 请求返回的属性数据列表之中。通过
设置 ArcIMSparam.js 文件中的 hideIDFieldData 和 hideShapeFieldData 变量为 true 可隐藏这两
个字段的显示,如下:
var hideIDFieldData = true;
var hideShapeFieldData = true;
Using aliases for the field names
通过设置 useFieldAlias 为 true,可是显示一个字段的别名来代替显示其原名。当
useFieldAlias 为 true 时,需要为每一个层创建一个字段名称和别名的列表。
通过设置数组变量 fieldAliasList 来为每一层创建字段名和别名。在这个数组中为每一层赋一
个值,顶层图层的索引值为 0。该列表为一个包含一对由冒号分隔的字段名和别名的字符串。
每一对之间使用一个“|”分隔。数组中的每一个元素通过如下方式赋值:
fieldAliasList[0] = “NAME:City NAME|POP:Population”;
fieldAliasList[1]=””;
因为每一个层都需要一个元素,如果你不想为某层设置别名,只需将该列表置为空字符串(“
”)就可以了,像上面的 element[1]一样。客户端会检查别名是否存在,并且只在对应该层的
列表中存在名称/别名对的时候才进行转换。
这些赋值的例子示例可以在第三章“HTML Viewer JavaScript Liberary”中关于 useFieldAlias
数组的描述中找到。
当你使用查询生成器时,下拉列表和查询表达式显示不同的字段名。下拉列表显示的别名字
17. 段是在 fieldAliasList 中定义的。但是为了正确的处理数据库的请求查询表达式还是通过使用
原始字段名进行构造的。
Changing the number of records listed at one time
虽然地图将显示所有你选择的要素,但你可以控制每一次结果列表中记录的个数。通过设置
变量 maxFeaturesReturned 值进行控制。默认值为 25 条记录。
将该值设得过大将影响响应的速度并可能导致浏览器的性能下降。如果所选择的要素数量比
maxFeaturesReturned 值大,浏览器将自动为其前后的记录集创建链接。用户可以通过链接浏
览整个选择集。
Identifying all visible features at one lacation
在客户端默认情况下 Identify 工具只对当前激活层有效。客户端一个 IdentifyAll 工具,在使
用 Identify 工具向所有可视图层进行单击选定时向所有被选中的要素发送请求。在
ArcIMSparam.js 文件中如下设置 useIdentiry 和 useIdentifyAll 变量。二者只有一个为
true,useIdentify 优先。
var useIdentify = false;
var useIdentifyAll = true;
IdentifyAll 工具的例子可以在链接和引用示例中找到。
Changing the title,logo,and colors
Changing the title
当你使用 Designer 创建 Web 站点时可以设置 HTML 客户端的标题。默认标题为”ArcIMS
Viewer”。
你可以在 HTML 客户端创建之后通过编辑 viewer.htm 文件修改客户端的标题。用你自己的标
题文本修改下面的语句:
var theTitle = “My Very Own Viewer”;
Changing the logo and background on the topFrame
在 HTML 客户端左上角的 logo 可以通过编辑 top.htm 修改。默认情况下,使用在你 Web 站点
的 images 目录下的 aimslogo1x2.gif 作为 logo。可以编辑图片的位置,名称来修改在
topFrame 中显示的 logo。
topFrame 使用的背景图片是在 images 目录下的 grad_gray.jpg。你可以编辑图片的位置,名称
来修改 topFrame 的背景显示。同样你也可以修改在 ModeFrame.htm 和 bottom.htm 的来满足
你的需求。
如果你的 logo 与原 logo 的尺寸上区别较大,你可能想要编辑 viewer.htm 文件中该框架的宽
度。下面的语句就是将 30 修改为一个更大值以便能容纳 logo 图片。第一个 30 针对顶层框架
第二个 30 针对底层框架而言。
document.writeln('<FRAMESET ROWS=quot;' + (30+addNS) + ',*,30,0quot; FRAMEBORDER=quot;Noquot;
FRAMESPACING=quot;0quot; onload=quot;doIt()quot; BORDER=0 ' + moreStuff + '>');
18. Changing the color of the box used for zoom area
将变量 zoomBoxColor 设置为一个表示颜色的十六进制数或者颜色名。默认为红色,以下例
子将颜色改为蓝色。
Var zoomBoxColor = “#0000ff”;
ArcIMS 函数和变量使用三种颜色表示模式——十六进制数,RGB 模式和颜色名。这三种颜
色模式不可交替使用。在每一个函数中要求指定某一种颜色模式。ArcIMSparam.js 使用某一
指定格式设置默认颜色。
Printing larger maps from the browser
ArcIMS HTML 客户端设计的打印纸页面为 81/2quot;x11quot;。然而通过对客户端一些小小的修改便
可以定制为输出更大尺寸的打印地图。
以下的步骤描述了如何定制 HTML 客户端来打印一个更大尺寸地图。要使客户端能打印比
浏览器尺寸更大的地图需要编辑三个文件。
Altering the printForm.htm
拷贝下面的代码,命名为 printForm.htm 并保存到 HTML 客户端 Web 站点的根目录下,覆盖
已有的文件:
<meta http-equiv=quot;Content-Typequot; content=quot;text/html; charset=ISO-8859-1quot;>
<HTML>
<HEAD>
<title>PrintForm</title>
<SCRIPT TYPE=quot;text/javascriptquot; LANGUAGE=quot;JavaScriptquot;>
var t;
if (opener) {
if (opener.name==quot;MapFramequot;) {
t = opener.parent.MapFrame;
} else {
t = opener;
}
} else {
if (parent.MapFrame) {
t = parent.MapFrame;
} else {
t=document;
19. }
}
function goPrint() {
alert(quot;Remember to set your print layout to Landscape if necessary before
printing.quot;);
var theForm = document.forms[0];
var theTitle = theForm.title.value;
// BB: Set print resolution
t.printDPI = theForm.printRes.options[theForm.printRes.selectedIndex].value;
// BB: Set print scale, if applicable
//var theScale = theForm.scale.value;
//if ((!isNaN(parseFloat(theScale))) && (parseFloat(theScale) > 0))
// t.printScale = parseFloat(theScale);
// Get print size from form
var theMapHeight = theForm.height.value;
var theMapWidth = theForm.width.value;
t.getPrintMap(theTitle, theMapWidth, theMapHeight);
var useTextFrame = t.useTextFrame;
t=null;
if (opener) {
window.close();
} else {
if (useTextFrame) document.location = quot;text.htmquot;;
}
}
//set the size of the print image
function setPrintSize(s){
var w, h, r;
r = 0.66;
switch(s) {
case 'letter':
w = 600;
20. r = 0.55;
//document.thePrintForm.width.value = 600;
//document.thePrintForm.height.value = 400;
break;
case 'tabloid':
w = 1000;
//document.thePrintForm.width.value = 1000;
//document.thePrintForm.height.value = 600;
break;
case 'dsize':
w = 2200;
//document.thePrintForm.width.value = 2200;
//document.thePrintForm.height.value = 1400;
break;
case 'esize':
w = 3000;
//document.thePrintForm.width.value = 3000;
//document.thePrintForm.height.value = 2200;
break;
default:
w = 600;
//document.thePrintForm.width.value = 600;
//document.thePrintForm.height.value = 450;
break;
} // end switch
h = w * r;
document.thePrintForm.width.value = w;
document.thePrintForm.height.value = h;
} // end function
</SCRIPT>
21. </HEAD>
<BODY BGCOLOR=quot;Whitequot; style=quot;font-family:Arial,sans-serif; color:blackquot;>
<FORM onsubmit=quot;goPrint();return false;quot; name=quot;thePrintFormquot; ID=quot;Form1quot;>
<table style=quot;font-size:smaller;quot; width=quot;100%quot; ID=quot;Table1quot;>
<tr valign=quot;topquot;>
<td width=quot;200quot;>
<b>Print Map</b>
<a href=quot;PrintHelp.htmquot; target=quot;_blankquot;>Help</a><br>
<font size=quot;-2quot;>
Click Create Print Page, then use the menu’s File-Print to send the map
to your printer.
</font>
</td>
<td align=quot;centerquot;>
Title to display on Map:<br>
<INPUT TYPE=quot;Textquot; NAME=quot;titlequot; VALUE=quot;ArcIMS HTML Viewer Mapquot; size=quot;30quot;
ID=quot;Text1quot;>
</td>
<td valign=quot;middlequot; align=quot;centerquot;>
<INPUT TYPE=quot;Submitquot; NAME=quot;submitquot; VALUE=quot;Create Print Pagequot; ID=quot;Submit1quot;>
</td>
</tr>
<tr>
<td colspan=quot;2quot; align=quot;centerquot;>
Size of Page:
<INPUT name=quot;mapSizequot; type=quot;radioquot; value=quot;latterquot; checked
onClick=quot;setPrintSize('letter');quot; ID=quot;Radio1quot;>11x8.5
<INPUT name=quot;mapSizequot; type=quot;radioquot; value=quot;tabloidquot;
onClick=quot;setPrintSize('tabloid');quot; ID=quot;Radio2quot;>17x11
<INPUT name=quot;mapSizequot; type=quot;radioquot; value=quot;dsizequot; onClick=quot;setPrintSize('dsize');quot;
ID=quot;Radio3quot;>D Size
23. <!DOCTYPE HTML PUBLIC quot;-//W3C//DTD HTML 4.01 Transitional//ENquot;>
<html>
<head>
<title>Printing Information</title>
</head>
<body bgcolor=quot;#c0c0c0quot;>
<div align=quot;centerquot;><form><input type=quot;buttonquot; onclick=quot;window.close()quot;
value=quot;Closequot;></form></div>
<h2>Printing Information</h2>
<p>
To print, change the settings as desired in the print settings dialog.
Then click on “Create Print Page” to open
a new Browser window with the Map Image, Overview Map Image, and Legend
displayed
(your existing map page remains in the background).
You can then use the browser’s File/Print menu item to send the display to your
printer. <br>
<br>
Note that the geographical area covered by the printed map may be slightly larger than
the area you are viewing. If the dimensions of the printed map are different from
the viewed map, then one dimension (x or y) must be enlarged to include the
currently viewed map extent.<br>
<br> If you wish to change any settings after generating the print preview page,
you
will need to close the print page, return to the main mapping page and create a
new print page.
</p>
<h4>Map Title</h4>
<p>
The map title you type will be displayed at the top of the printed page.
</p>
<h4>Print Size</h4>
<p>
You may choose a size from the options listed, or enter a size in terms of
pixels.
For larger map sizes, the map service must be configured to allow large map
images.
Contact the website administrator if you have problems printing large maps.<br>
<br>
Technical
note: the size is based on the standard 96 dpi in viewing the map. The actual map
image produced will be adjusted based on the selected printer resolution dpi.
</p>
<h4>Printer Resolution</h4>
<p>
24. You should choose a printer resolution setting that matches the printer you will
be using.
This will ensure the best map image quality. If necessary check your printer
resolution before
continuing. In Windows 2000, for example, you can check the printer resolution by
choosing Start-Settings-Printers, right-clicking on the printer you intend to use,
and choose Properties.
In the “General” tab, click on “Printing Preferences”, then on “Advanced”. In the
Advanced options, the Print Quality setting shows the current/default resolution
(dpi) setting, and any available settings. If you choose a Printer Resolution
setting for the map that does not match the printer default, be sure to change the
printer setting before printing the map.
</p>
</body>
</html>
将以下的 JavaScript 代码拷贝命名为 aimsPrint.js 并保存至 HTML 客户端 Web 站点目录下
的javascript 目录下。这是一个新文件不会覆盖任何文件:
/*
* JavaScript template file for ArcIMS HTML Viewer
* dependent on aimsXML.js, ArcIMSparam.js, aimsCommon.js, aimsMap.js,
* aimsLayers.js, aimsDHTML.js
* aimsClick.js, aimsNavigation.js,
* aimsLegend.js
*/
var printDPI = 300; // BB: printer DPI—may be overridden by print form
var printHeight = 450; // BB: default print dimensions var printWidth = 450; // BB
var printScale = 0; // BB: RF scale (1:x number) for printing
var INCH_TO_MAP_UNITS = 69 * 63360 // BB: inches in one map unit — converts DPI to scale
// NOTE that for decimal-degree map, scale is only correct in x or y
// due to convergence of meridians toward the poles!
aimsPrintPresent=true;
var printTitle = titleList[4];
var printMapURL=quot;quot;;
25. var printOVURL=quot;quot;;
var printLegURL=quot;quot;;
var legVis2=false;
/*
*******************************************************************************
********
Print functions
*******************************************************************************
********
*/
// display print form
function printIt() {
hideLayer(quot;measureBoxquot;);
if (useTextFrame) {
parent.TextFrame.document.location = quot;printform.htmquot;;
} else {
var Win1 =
open(quot;printform.htmquot;,quot;PrintFormWindowquot;,quot;width=575,height=150,scrollbars=yes,resizable=yesquot;)
;
}
}
// create web page for printing
// first get Map
function getPrintMap(title, w, h) {
var tLeft, tRight, tBottom, tTop;
showRetrieveMap();
printTitle=title; legVis2=legendVisible;
26. if (aimsLegendPresent) legendVisible=true;
// BB: set print size to input values
if (w != quot;quot;) printWidth = parseInt(w);
if (h != quot;quot;) printHeight = parseInt(h);
// BB: set map extent if scale specified
tLeft = eLeft;
tRight = eRight;
tBottom = eBottom;
tTop = eTop;
//if (printScale == 0) {printScale = 1};
// Width/height of map in ground distance, scaled appropriately
// var iScaledWidth = printWidth/96 * printScale / INCH_TO_MAP_UNITS
// var iScaledHeight = printHeight/96 * printScale / INCH_TO_MAP_UNITS
// Center of map
// var xCenter = (parseFloat(eRight) + parseFloat(eLeft)) / 2
// var yCenter = (parseFloat(eTop) + parseFloat(eBottom)) / 2
// New map extents based on scale
//eLeft = xCenter - iScaledWidth/2
//eRight = xCenter + iScaledWidth/2
//eBottom = yCenter - iScaledHeight/2
//eTop = yCenter + iScaledHeight/2
//BB: set XMLMode so get print res.
XMLMode = 101;
// BB: enlarge legend in proportion to map
var tempLegW = legWidth;
27. var tempLegH = legHeight;
legWidth = parseInt(printWidth/4);
legHeight = parseInt(printWidth/3);
// BB
var theString = writeXML();
eLeft = tLeft; eRight = tRight;
eBottom = tBottom;
eTop = tTop;
legWidth = tempLegW; // BB: restore default leg vars
legHeight = tempLegH; // BB
legendVisible = legVis2;
sendToServer(imsURL,theString,101);
theString=null;
}
// second, get OVMap
function getPrintOV() {
var tempWidth = i2Width;
var tempHeight = i2Height;
i2Width=parseInt(printWidth/4); //BB: scale to print
i2Height=parseInt(printHeight/4); // BB: scale to print
var tempDraw=drawOVExtentBox;
drawOVExtentBox=true;
XMLMode = 102;
var theString = writeOVXML();
30. Win1.document.writeln(' </TR>');
Win1.document.writeln('</TABLE>');
Win1.document.writeln('</B></FONT>');
Win1.document.writeln('</body></html>');
Win1.document.close();
legendVisible=legVis2;
Win1=null;
hideRetrieveMap();
}
Working with tools and the toolbar
Changing search tolerance for Identify and Hyperlink
设置变量 pixelTolerance 为 Identify 或者 Hyperlink 操作的像素搜索容差值。容差是指在点击
点周边区域的搜索半径。默认值为 2。
var pixelTolerance = 5;
Changing the pan and zoom factors
设置变量 panFactor 和 zoomFactor 的值,来修改地图在漫游和放大时的比例因子。
//panning factor for arrow buttons
var panFactor = 0.85;
//zoom factors for v.3
var zoomFactor = 2;
Removing tools from the toolbar
ArcIMSparam.js 中包含了一组使用”use”开头命名的变量,这些变量主要用于表示每个工
具在 ArcIMS 中是否可用。比如,有变量 usePan,useZoomIn,和 useIdentify。这些工具栏都
是基于这些以”use”开头的变量值动态创建的,如果你需要在你的工具栏中包含这些工具
的话,你变可以通过将该工具对应的值设为 true.
var usePan=true;
var usePanNorth=false;
var usePanWest=false;
var usePanEast=false;
var usePanSouth=false;
Changing the toolbar images and structure
Toolbar.htm 使用与定义工具栏结构的文件。它使用 DHTML 创建两列来放置该站点选择的工
具。你可以通过定制该文件制作一个不同的表格布局,使用定制图片或者根本就不使用表格。
为了加上定制图片,可以使用你自己制作的 GIF 图片替代原本图片目录下的图片文件。如果
39. Map units
客户端从 GET_SERVICE_INFO 响应中获取地图单位。全局变量 MapUnits 决定了该值。当
地图单位未知的时候该值在加载服务时非常重要,比如在 Generic,JavaPost,和 MultiService
示例或者定制接口的过程中。
JavaScript funcion files
下面的 JavaScript 函数文件是包含在 HTML 客户端之中的文件。ArcIMSparam.js 文件在 Web
站点的根目录下。所有其他的文件都保存在 web 站点目录下的javascript 目录下。以下作简
单的介绍,更多的详细信息请查看第三章”HTML 客户端 JavaScript 库”
• ArcIMSparam.js—main parameter file that configures the HTML Viewer
• AimsBuffer.js—functions to perform buffering
• AimsClick.js—functions that respond to clicks on the map or buttons
• AimsCommon.js—general utility functions
• AimsCustom.js—templates for adding custom functionality
• AimsDHTML.js—functions for creating and using Cascading Style Sheets (layers in Netscape)
• AimsGeocode.js—functions to perform address and intersection matching
• AimsIdentify.js—functions to perform basic query including Identify and Hyperlink
• AimsLayers.js—functions for managing map layers
• AimsLegend.js—functions for managing the graphic legend
• AimsMap.js—basic mapping functions
• AimsNavigation.js—functions for interactive map navigation such as zooming and panning
• AimsPrint.js—functions for creating a Web page layout suitable for printouts
• AimsQuery.js—functions to perform attribute query, for example, Query, Find, and Search tools
• AimsResource.js—text strings used for the interface
• AimsSelect.js—functions to perform spatial selection, such as selections by rectangle and shape
• AimsXML.js—functions for basic XML communication with the servers
Using the sample HTML Viewers
ArcIMS 提供了多个已实现的 HTML 客户端示例。它们演示了大部分的函数功能以及图形用
户接口(GUI)的设计。通过这些示例你可以了解到很多关于如何创建服务以及如何访问
ArcIMS Web 站点的知识。
在上页中已经列出了所有的 HTML 客户端中使用的 JavaScript 函数。当然还有一些另外的用
于特定示例中的一些函数。
示例中有:Basic Map,Extract,Generic Map, HyperLink ,JavaPost, MultiService, Parcels, 和
Thematic Map.
下面是一个示例程序运行时必须条件的说明。你同样可以参考在你的<安装目录
>SamplesViewersHTMLSample_setup.htm 的安装指导。当然前提是你使用的是默认的经典