2018 Academy Health Annual Research Meeting Poster
•Als PPTX, PDF herunterladen•
1 gefällt mir•303 views

The Design of a Neighborhood Level Community Health Needs Assessment Map Tool for Non-Profit Hospitals
Empfohlen

Empfohlen
Weitere ähnliche Inhalte
Was ist angesagt?
Was ist angesagt? (20)
Ähnlich wie 2018 Academy Health Annual Research Meeting Poster
Ähnlich wie 2018 Academy Health Annual Research Meeting Poster (20)
Mehr von Karthikeyan Umapathy
Mehr von Karthikeyan Umapathy (20)
Kürzlich hochgeladen
Kürzlich hochgeladen (20)
2018 Academy Health Annual Research Meeting Poster
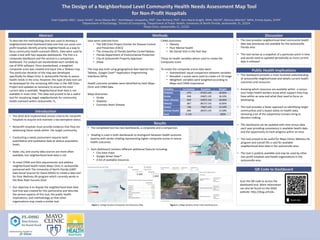
- 1. The Design of a Neighborhood Level Community Health Needs Assessment Map Tool for Non-Profit Hospitals Evan Copello, MSc1, Jason Smith2, Anna Mease BSc3, Karthikeyan Umapathy, PhD2, Dan Richard, PhD1, Ann-Marie Knight, MHA, FACHE4, Monica Albertie4, MHA, Emma Apatu, DrPH2 1Department of Psychology, 2School of Computing, 3Department of Public Health, University of North Florida, Jacksonville, FL, 32224 4Mayo Clinic, Jacksonville, FL, 32224 To describe the methodology that was used to develop a neighborhood-level dashboard data tool that can assist non- profit hospitals identify priority neighborhoods as a way to focus community health outreach efforts. Data were used to create a tool with two separate dashboards. The first is a composite dashboard and the second is a comparison dashboard. For analysis we standardized each variable by use of SPSS software. Once standardized, a weighted composite score was created and input into a Tableau map. This particular iteration of the map was developed specifically for Mayo Clinic in Jacksonville Florida to assess health needs in the area. However, this type of data tool can be developed for the remaining 499 cities in the 500 Cities Project and updated as necessary to ensure the most current data is available. Neighborhood level data is not available in most cities. This data tool proved to be a useful tool for visualizing target neighborhoods for community health outreach within Jacksonville, FL. Abstract • The completed tool has two dashboards, a composite and a comparison. • Shading is used in both dashboards to distinguish between health outcome severity with darker shading representing higher composite scores or worse health outcomes. • Each dashboard contains different additional features including: • City base maps • Google Street View™ • A list of available resources Introduction Data were collected from: • The 500 Cities Project (Center for Disease Control and Prevention (CDC)) • The University of Florida GeoPlan CenterTableau • Florida Department of Environmental Protection • City of Jacksonville Property Appraiser • Zillow The map was built using geographical data layered into Tableau. Google Code™ Application Programming Interfaces (APIs) Health outcome variables were identified by both Mayo Clinic and CHNA data. Mayo Outcomes: • Stroke • Diabetes • Coronary Heart Disease Methods • This tool provides neighborhood level community health data was previously not available for the Jacksonville, Florida area. • This tool serves as a snapshot of a particular point in time and would need to updated periodically as more current data is released. Discussion • This dashboard provides a more localized understanding of Jacksonville neighborhoods and details current health outcomes and resources. • Knowing which resources are available within a census tract helps health workers know what support they may have within an area and what they need to focus on developing. • This tool provides a faster approach to identifying target communities and is based solely on health data, removing a lot of the subjectivity humans bring to decision-making. • This dashboard can be updated with new census data each year providing consistency in available health data and the opportunity to track progress within an area. • This tool proved to be useful for Mayo Clinics Wellness Rx program and overall fills a void for available neighborhood level data in the Jacksonville area. • This tool is publicly available and may be used by other non-profit hospitals and health organizations in the Jacksonville area. Public Health Implications • The 2010 ACA implemented stricter criteria for nonprofit hospitals to acquire and maintain a tax exemption status. • Nonprofit hospitals must provide evidence that they are addressing these needs within the target community. • Conducting a needs assessment requires both quantitative and qualitative data at various population levels. • State, city, and county data sources are more often available, but neighborhood level data is not. • To meet CHNA and ACA requirements and address neighborhood health needs Mayo Clinic in Jacksonville partnered with The University of North Florida (UNF) Data Social Science for Good (DSSG) to create a data tool for their Wellness RX program which currently works in the New Town Success Zone. • Our objective is to display the neighborhood level data tool that was created for this partnership and describe the various aspects of this tool, the public health implications, and methodology so that other organizations may create a similar tool. Results Figure 1. College Gardens Composite and Outcomes Map Figure 2. College Gardens Street View and Resources Scan the QR code to access the dashboard tool. More information can also be found on the DSSG website: http://dssg.unf.edu QR Code to Dashboard CHNA Outcomes: • Obesity • Poor Mental health • No Dental Visit in the Past Year These six health variables where used to create the Composite score. To create the composite scores data were: • Standardized: equal comparison between variables • Rescaled: z-scores were used to create a 0-10 range • Weighted: variables were weighted according to Mayo and CHNA importance Variables Correlation Equation Weight Diabetes .970 .970/5.145 18.85% Stroke .948 .948/5.145 18.43% Heart Disease .929 .929/5.145 18.06% Obesity .867 .867/5.145 16.85% Dental .748 .748/5.145 14.54% Mental Health .683 .683/5.145 13.28% Total 5.145 100%