Data visualization tools
•Als PPTX, PDF herunterladen•
1 gefällt mir•275 views

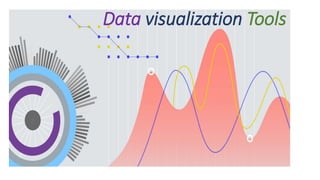
Data visualization is the graphical representation of information and data

Empfohlen
Empfohlen
Weitere ähnliche Inhalte
Was ist angesagt?
Was ist angesagt? (20)
Ähnlich wie Data visualization tools
Ähnlich wie Data visualization tools (20)
Mehr von krishnapriya Tadepalli
Mehr von krishnapriya Tadepalli (14)
Kürzlich hochgeladen
Kürzlich hochgeladen (20)
Data visualization tools
- 1. Tableau V/s Google Data Studio Data visualization Tools
- 2. Introduction Data visualization has become more and more essential for companies over the past 20 years. Many Business Intelligence tools have sprung up, trying to answer this need. Among these tools, Tableau and Google Data Studio stand out, bringing powerful and easy-to-use solutions for reporting and data visualization.
- 3. Differences between Tableau and Google Data Studio Tableau Google Data Studio Tableau is primarily a desktop application. It does offer sharing and viewing capabilities through Tableau Online In contrast, Google Data Studio is a web-based tool; it is only available via the browser. This allows users to collaborate on a project and share it very easily. In addition, any small change can be made instantly. The downside: you’re dependent on a quality internet connection. Tableau Public is a limited version of Tableau and is available for free. A Tableau Desktop license starts at $35/month for Personal Edition, and $70/month for Professional Edition. Google Data Studio is free. Previously, users were able to create only five free reports, but Google has removed this limitation. Tableau connects to various data sources, including files, databases, and certain Google products such as Google Analytics, Google BigQuery, Google Cloud SQL and Google Sheets. It does not, however, offer access to Google products like AdWords, Attribution, or YouTube Analytics, but you can get access to these via third party tools. Google Data Studio offers connectivity to Google data sources that include AdWords API, Attribution 360, BigQuery, DoubleClick Campaign Manager, Google Analytics, Google Sheets, and YouTube Analytics. It has also released a connector to the MySQL database.
- 4. Differences between Tableau and Google Data Studio Tableau Google Data Studio Tableau provides many options for preparing data for visualization. For example, you can hide columns, create groups of columns, split columns, pivot columns, and apply filters at source. Google Data Studio does not currently offer data preparation. Tableau has data-joining capabilities that include inner, left, right, and full outer joins. It is possible to join multiple data sources and use the resulting data in Tableau visualizations. Data Studio does not provide data joining capabilities. Datasets have to be built outside Data Studio and then brought in for visualization. Sometimes you don’t want to join data – all you want is a single dashboard that includes charts that come from very different data sources. For example, you may want to see a graph of the performance of a certain app from Facebook PPC next to that of Google PPC, so that you can compare them. In Tableau, you can connect to multiple data sources, create sheets with visualizations, and then add multiple sheets to a single dashboard. Similarly, Data Studio also provides the functionality to add multiple data sources to a single report. Charts can then be created using these data sources.
- 5. Differences between Tableau and Google Data Studio Tableau Google Data Studio Tableau offers the following standard (drag and drop) visualizations: • tables, • heat maps, • highlighted tables, • maps and filled maps, • pie charts, • horizontal/vertical bars, • stacked bars, • side-by-side bars, • circle view, • side-by-side circles, • line charts, • discrete line charts, • dual axis lines, • area charts, • discrete area charts, • combination charts, • scatter plots, • histograms, • box-and-whisker plots, • Gantt charts, • bullet graphs, • packed bubble charts. It is also possible to create custom visualizations in Tableau, such as sankey diagrams, sunburst charts, etc. Data Studio 360 offers: • time series charts, • bar charts, • pie charts, • tables, • maps, • scorecards, • scatter plots, • bullet charts, • area charts.
- 6. Differences between Tableau and Google Data Studio Tableau Google Data Studio Tableau allows users to connect to and use multiple data sources in visualizations. However, if these are connected to the workbook, they can be difficult to manage. For example, if multiple data sources are added to a data visualization, it is hard to tell which ones are being used, and which are not. Data Studio provides a data source management view that shows not only which data sources are included in the view, but also those that are not being used. Apart from standard aggregation functions Tableau offers over 150 functions. Apart from standard aggregation functions Data Studio offers 53 functions Tableau allows users to filter the entire dashboard by clicking on an individual data point. Data Studio does not offer this feature. Data Studio and Tableau both offer filters. It is possible to filter data for each visualization individually, or to add a filter to the report to allow the end user to drill down into the data, if they wish to do so. Metrics and dimensions in Tableau are selected with drag-and-drop or via right-clicking and selecting ‘Add to sheet’. Data Studio automatically selects the dimensions and metrics, based on the type of chart the user picks on the toolbar. Sometimes, this feature is helpful; more frequently, it actually limits you in what kind of chart you can use with what kinds of dimensions and metrics. Being unconventional is not always an option in Data Studio.
- 7. Conclusion • Both tools are fairly easy to grasp and start working with. Tableau has an extensive documentation and a long list of useful tutorials. Google Data Studio offers some documentation and a list of 6 tutorials on their support website. • In conclusion, while Tableau is seen to offer better data visualization solutions in this comparison, Google has made impressive advances in reporting, to narrow the gap. Tableau’s strength lies in that it is the more complete and powerful tool for visual data discovery and visualization. • Meanwhile, Data Studio presents itself as a good solution for building beautiful reports that are easy to customize and share quickly. • In particular, I think Data Studio is great in five key areas: Features for Everyone, Regular Updates, Best Data Connections, Always Online and Unbeatable Cost