1. LAS VEGAS VALLEY
FACT SHEET
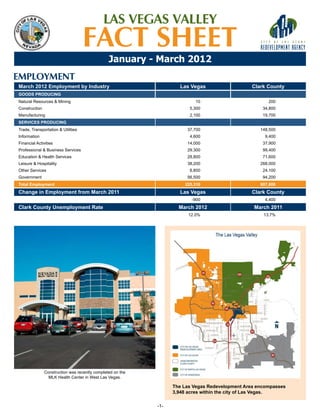
January - March 2012
EMPLOYMENT
March 2012 Employment by Industry Las Vegas Clark County
Goods Producing
Natural Resources & Mining 10 200
Construction 5,300 34,800
Manufacturing 2,100 19,700
Services Producing
Trade, Transportation & Utilities 37,700 148,500
Information 4,600 9,400
Financial Activities 14,000 37,900
Professional & Business Services 29,300 99,400
Education & Health Services 28,800 71,600
Leisure & Hospitality 38,200 268,000
Other Services 8,800 24,100
Government 56,500 94,200
Total Employment 225,310 807,800
Change in Employment from March 2011 Las Vegas Clark County
-900 4,400
Clark County Unemployment Rate March 2012 March 2011
12.0% 13.7%
Construction was recently completed on the
MLK Health Center in West Las Vegas.
The Las Vegas Redevelopment Area encompasses
3,948 acres within the city of Las Vegas.
-1-
2. TOURISM & GAMING
• There were more than 9.75 million visitors to the
Las Vegas valley during the first quarter, 3.6 percent
above the 9.42 million recorded visitors in the same
quarter of last year. Visitor volume levels have been
increasing during the past two years.
• Clark County gaming revenue totaled more than
$2.47 billion in the first quarter and is up 4.4 percent
over the previous year. All areas within Clark County
posted positive growth, with the Strip leading the way
at 5.2 percent. This was followed by Downtown (+4.0
percent), the Boulder Strip (+3.4 percent) and other
county areas (+2.6 percent). The Plaza hotel-casino recently underwent a major renovation.
Photo courtesy of The Plaza.
Visitor Volume January February March Q1, 2012
Las Vegas Valley 3,154,600 3,070,000 3,532,000 9,756,600
% Change from prior year 0.9% 6.4% 3.7% 3.6%
Gaming Revenue January February March Q1, 2012
Strip $623,512,000 $530,690,000 $448,683,000 $1,602,885,000
Downtown $47,065,000 $45,044,000 $43,388,000 $135,497,000
Boulder Strip $84,313,000 $71,653,000 $62,787,000 $218,753,000
Other County Areas $170,597,000 $164,748,000 $178,636,000 $513,981,000
Clark County $925,487,000 $812,135,000 $733,494,000 $2,471,116,000
% Change from prior year
Strip 29.2% 3.3% -14.9% 5.2%
Downtown 13.7% 13.6% -11.9% 4.0%
Boulder Strip 8.7% 22.9% -17.0% 3.4%
Other County Areas 6.8% 4.3% -2.7% 2.6%
Clark County 21.6% 5.5% -12.2% 4.4%
For-Sale Residential
Redevelopment Unincorporated North Las Vegas
Las Vegas Henderson
Area Las Vegas Valley Las Vegas Valley
NEW HOMES*
Active Projects 56 3 111 45 35 247
Total Units 6,711 669 15,673 6,417 4,429 33,230
Unsold Units 3,154 115 5,887 2,170 1,845 13,056
Closed Units – Q1 217 20 350 173 103 843
Avg. Size (SF) 2,287 1,978 2,334 2,441 2,370 2,344
Median Price $201,000 $189,000 $241,000 $218,000 $189,000 $212,000
Median Price per SF $93 $108 $101 $102 $82 $97
RESALE HOMES
Closed Single Family Units – Q1 2,809 35 3,753 1,417 1,313 9,293
Closed Multi-family Units – Q1 662 5 1,166 305 98 2,231
Avg. Days on Market 78 79 76 76 75 76
Avg. Size (SF) 1,794 1,459 1,809 2,041 1,854 1,845
Median Price $100,000 $40,050 $110,000 $145,000 $92,000 $109,000
Median Price per SF $60 $33 $66 $78 $52 $63
*New home units include those within subdivision projects that are actively selling.
-2-
3. APARTMENTS New Apartment Projects by Expected Completion
Average
Apartment Rents Average
Vacancy 1,400
& Vacancy Rent
Rate 1,146 units
1,200 2012
Las Vegas $761 9.8%
1,000 2013
Redevelopment Area $586 10.7% 851 units
Unincorporated Las Vegas Valley $780 10.3% 800 660 units
Henderson $851 8.9%
North Las Vegas $759 9.4% 600 491 units
Las Vegas Valley $747 9.7% 400
200
0
Las Vegas Unincorporated Henderson North Las Vegas
Las Vegas Valley
New Apartment Projects by Type and Expected Completion
2012 2013
Type Proj. Units Proj. Units
Las Vegas Affordable 0 0 0 0
Age Restricted 0 0 1 75
Affordable/Age Restricted 0 416 0 0
Conventional 0 0 0 0
Total 1 416 1 75
Redevelopment Area Affordable 0 0 0 0
Age Restricted 0 0 0 0
Affordable/Age Restricted 0 0 0 0
Conventional 0 0 0 0
Total 0 0 0 0
Unincorporated Las Vegas Valley Affordable 0 0 0 0
Age Restricted 0 0 0 0
Affordable/Age Restricted 3 326 0 0
Conventional 2 640 1 180
Total 5 966 1 180
Henderson Affordable 0 0 0 0
Age Restricted 0 0 0 0
Affordable/Age Restricted 1 226 0 0
Conventional 1 296 3 329
Total 2 522 3 329
North Las Vegas Affordable 0 0 0 0
Age Restricted 0 0 0 0
Affordable/Age Restricted 0 0 0 0
Conventional 2 222 1 438
Total 2 222 1 438
Las Vegas Valley Affordable 0 0 0 0
Age Restricted 0 0 1 75
Affordable/Age Restricted 5 968 0 0
Conventional 5 1,158 5 947
Total 10 2,126 6 1,022
Clark County Business License Activity*
BUSINESS LICENSING Las Vegas 1,040 issued in Q1
36,804 total active
• There were 1,040 businesses licenses issued
in the city of Las Vegas during the first quarter, Unincorporated 2,445 issued in Q1
Clark County 58,044 total active
making up 23 percent of Clark County’s 4,502
total newly-issued licenses for the quarter. 344
721 issued in Q1
of these were issued to businesses within the Henderson 12,519 total active Active
city’s Redevelopment Area. Issued
North 296 issued in Q1
• By the end of quarter, there were 36,804 active Las Vegas 12,519 total active
business licenses in the city of Las Vegas (32 0 10,000 20,000 30,000 40,000 50,000 60,000 70,000
percent of the county total). Of this amount, *Excludes Boulder City and Mesquite.
5,555 were active in the Redevelopment Area.
*Excludes Boulder City and Mesquite.
-3-
4. SPECULATIVE COMMERCIAL
• The city of Las Vegas makes up 10 percent (9.2 For-Lease Commercial Existing Under Const.
million sf) of the Las Vegas Valley’s 93.3 million sf Estimated Employment Employment Employment
of total for-lease industrial inventory.
Industrial
• Of the 41.1 million sf of total for-lease office Las Vegas 14,160 0
inventory, 35 percent (nearly 14.4 million sf) were Redevelopment Area 8,300 0
located within the city. Unincorporated Las Vegas Valley 86,130 80
Henderson 14,730 0
• Approximately 100,000 sq. ft. of new anchored
North Las Vegas 23,770 0
shopping center space was completed in the Las Vegas Valley 138,790 80
city of Las Vegas during the quarter, increasing Office
inventory to just over 15 million sq. ft. Las Vegas 60,640 0
• Las Vegas accounted for 35 percent of the total Redevelopment Area 12,080 0
42.8 million sf of for-lease anchored retail supply. Unincorporated Las Vegas Valley 86,260 0
Henderson 24,380 110
City of Las Vegas Commercial Inventory North Las Vegas 3,260 0
Las Vegas Valley 174,540 110
(Millions of SF)
Retail
16
Las Vegas 30,760 0
14 Redevelopment
Area share Redevelopment Area 1,070 0
12 Unincorporated Las Vegas Valley 32,260 0
Henderson 15,680 0
10
North Las Vegas 6,430 0
8 Las Vegas Valley 85,130 0
6
4
2
0
Industrial (9.2 MSF) Office (14.4 MSF) Retail (15.0 MSF)
Y-O-Y # of Under Under
For-Lease Commercial Existing Existing Vacancy Average
Absorbtion Const. Const.
Market Indicators Projects Space (sf) (%) Rents ($)
Space (sf) Projects Space (sf)
Industrial
Las Vegas 393 9,201,416 15.4% $0.57 -42,579 0 0
Redevelopment Area 227 4,938,437 7.6% $0.42 -8,402 0 0
Unincorporated Las Vegas Valley 1,624 57,690,738 17.9% $0.50 70,630 1 51,097
Henderson 313 9,710,448 16.6% $0.44 221,813 0 0
North Las Vegas 420 16,686,147 21.7% $0.36 67,347 0 0
Las Vegas Valley 2,750 93,288,749 18.2% $0.50 317,211 1 51,097
Office
Las Vegas 372 14,362,831 26.1% $1.89 -64,411 0 0
Redevelopment Area 62 2,527,844 16.4% $1.85 -24,286 0 0
Unincorporated Las Vegas Valley 538 20,498,957 26.4% $1.86 139,361 0 0
Henderson 141 5,572,278 23.4% $2.00 -130,007 1 26,000
North Las Vegas 27 708,704 19.4% $1.50 -18,173 0 0
Las Vegas Valley 1,078 41,142,770 25.8% $1.90 -73,230 1 26,000
Retail
Las Vegas 86 15,034,703 7.9% $1.01 59,288 0 0
Redevelopment Area 6 628,329 23.5% $1.02 31,858 0 0
Unincorporated Las Vegas Valley 99 16,129,025 10.0% $1.40 -144,672 0 0
Henderson 48 8,128,308 13.2% $1.29 -60,200 0 0
North Las Vegas 21 3,485,729 17.0% $1.24 230,613 0 0
Las Vegas Valley 254 42,777,765 10.5% $1.32 85,029 0 0
Note: Due to reclassifications of and adjustments to data between reporting periods, the commercial market data for the latest quarter may not
necessarily be comparable to a previously reported quarter.
-4-
5. BUILDING PERMITS Building Permits New New
New
Commercial &
• There were 224 new single Value Single Family Multifamily
Hotel/Motel
family units and 75 multifamily
Las Vegas Units 224 75 N/A
units permitted in the city of
Permits 224 1 4
Las Vegas in the first quarter. Valuation $30,444,959 $4,394,400 $7,708,097
Units 0 0 N/A
• Also, there were four new Redevelopment
Permits 0 0 2
commercial and hotel/motel Area
Valuation $0 $0 $6,233,097
permits issued in Las Vegas Unincorporated Units 510 0 N/A
with a total valuation of Clark County Permits 510 0 50
more than $7.7 million. This Valuation $55,723,439 $- $111,999,584
includes two projects within the Henderson Units 206 460 N/A
Redevelopment Area, which Permits 206 38 2
accounted for most of the Valuation $25,680,780 $25,512,545 $491,400
commercial valuations for the North Las Vegas Units 94 4 N/A
city. Permits 94 4 5
Valuation $13,521,000 $415,569 $2,570,151
Clark County* Units 1,034 539 N/A
Permits 1,034 43 61
Valuation $125,370,178 $30,322,514 $122,769,232
*Excludes cities of Boulder City and Mesquite.
CERTIFICATES OF OCCUPANCY The Economic and Urban Development
Department (EUD) creates, coordinates and
• There were 835 certificates of occupancies recorded in the first encourages development and redevelopment
quarter, of which 224 (or 27 percent) were issued in the city of throughout the city of Las Vegas. It increases
Las Vegas. and diversifies the city’s economic base, and
creates jobs, through business attraction,
Certificates of Occupancy Issued retention and expansion programs. In addition,
this newly expanded department now includes
400 employees who oversee and manage local,
342 state and federal grants used to provide public
services, develop public facilities and support
affordable housing for Las Vegas families with
224 lower incomes.
200 175 The EUD coordinates with the city of
Las Vegas Redevelopment Agency on
94 day-to-day operations, economic development,
job creation and long-term strategic goals.
495 S. Main St.
0 Sixth Floor
Las Vegas Unincorp. Henderson North Las Vegas, NV 89101
Tel: 702.229.6551
Clark County Las Vegas*
*North Las Vegas records non-residential certificates of occupancy only. www.lvrda.org
www.lasvegasnevada.gov/EUD
Sources:
Employment: RCG Economics LLC; U.S. Census Bureau; Nevada Department www.facebook.com/lvbusiness
of Employment, Training and Rehabilitation
Tourism & Gaming: Las Vegas Convention and Visitors Authority; Nevada State
Gaming Control Board; McCarran International Airport Disclaimer:
Business Licensing: County and municipal governments
The information furnished by RCG Economics LLC in
For-Sale Residential: HomeBuilders Research; Greater Las Vegas Association of
REALTORS® its quarterly reports to the city under this contract has
Apartment Projects: CB Richard Ellis been obtained from sources RCG deems reliable and
Apartment Rents & Vacancies: Center for Business and Economic Research at UNLV is submitted subject to errors, omissions and changes.
For-Lease Commercial: RCG Economics LLC Although RCG has no reason to doubt its accuracy,
Building Permit Activity: County and municipal governments RCG does not guarantee it.
Certificates of Occupancy: County and municipal governments ED-0023-025-12 RS
-5-