Weitere ähnliche Inhalte Ähnlich wie Westar beverage sales case (#47) (20) Kürzlich hochgeladen (20) 1. Regression Analysis
r² 0.359 n 28
r 0.599 k 1
Std. Error 3845.950 Dep. Var. BEVTOTAL
ANOVA table
Source SS df MS F p-value
Regression 215,468,679.6524 1 215,468,679.6524 14.57 .0008
Residual 384,574,674.4548 26 14,791,333.6329
Total 600,043,354.1071 27
Regression output confidence interval
variables coefficients std. error t (df=26) p-value 95% lower 95% upper
Intercept 21,497.1117 1,458.0430 14.744 3.85E-14 ### ###
MONTH 309.8116 81.1726 3.817 .0008 142.9590 476.6642
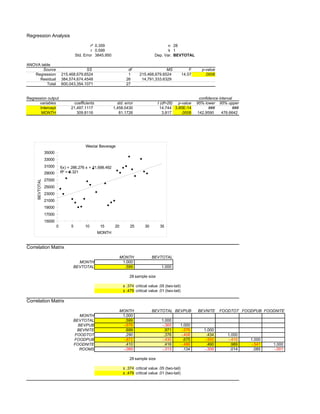
Westar Beverage
35000
33000
31000 f(x) = 286.276 x + 21,698.492
29000 R² = 0.321
27000
BEVTOTAL
25000
23000
21000
19000
17000
15000
0 5 10 15 20 25 30 35
MONTH
Correlation Matrix
MONTH BEVTOTAL
MONTH 1.000
BEVTOTAL .599 1.000
28 sample size
± .374 critical value .05 (two-tail)
± .479 critical value .01 (two-tail)
Correlation Matrix
MONTH BEVTOTAL BEVPUB BEVNITE FOODTOT FOODPUB FOODNITE
MONTH 1.000
BEVTOTAL .599 1.000
BEVPUB -.676 -.365 1.000
BEVNITE .699 .971 -.576 1.000
FOODTOT .290 .376 -.408 .434 1.000
FOODPUB -.872 -.430 .675 -.550 -.410 1.000
FOODNITE .410 .416 -.486 .490 .989 -.541 1.000
ROOMS -.089 -.313 .134 -.309 .014 .085 -.001
28 sample size
± .374 critical value .05 (two-tail)
± .479 critical value .01 (two-tail)
2. Regression Analysis
r² 0.457 n 28
r -0.676 k 1
Std. Error 1030.580 Dep. Var. BEVPUB
ANOVA table
Source SS df MS F p-value
Regression 23,278,328.9849 1 23,278,328.9849 21.92 .0001
Residual 27,614,481.8722 26 1,062,095.4566
Total 50,892,810.8571 27
Regression output confidence interval
variables coefficients std. error t (df=26) p-value 99% lower 99% upper
Intercept 8,392.0883 390.7045 21.479 4.51E-18 7,306.4320 9,477.7447
MONTH -101.8314 21.7514 -4.682 .0001 -162.2723 -41.3904
Regression Analysis
r² 0.116 n 27
r 0.340 k 1
Std. Error 600.804 Dep. Var. FOODTOT
ANOVA table
Source SS df MS F p-value
Regression 1,179,973.8078 1 1,179,973.8078 3.27 .0826
Residual 9,024,128.8588 25 360,965.1544
Total 10,204,102.6667 26
Regression output confidence interval
variables coefficients std. error t (df=25) p-value 95% lower 95% upper
Intercept 2,378.5942 231.5079 10.274 1.85E-10 1,901.7948 2,855.3936
MONTH 24.1157 13.3381 1.808 .0826 -3.3548 51.5861
Regression Analysis
r² 0.766 n 27
r -0.875 k 1
Std. Error 54.188 Dep. Var. FOODPUB
ANOVA table
Source SS df MS F p-value
Regression 240,420.5956 1 240,420.5956 81.88 2.32E-09
Residual 73,409.0340 25 2,936.3614
Total 313,829.6296 26
Regression output confidence interval
variables coefficients std. error t (df=25) p-value 95% lower 95% upper std. coeff.
Intercept 259.9821 20.8804 12.451 3.24E-12 216.9782 302.9860 0.000
MONTH -10.8855 1.2030 -9.049 2.32E-09 -13.3631 -8.4079 -0.875
Regression Analysis
r² 0.206 n 27
r 0.454 k 1
Std. Error 619.367 Dep. Var. FOODNITE
ANOVA table
3. Source SS df MS F p-value
Regression 2,485,645.5583 1 2,485,645.5583 6.48 .0175
Residual 9,590,402.2935 25 383,616.0917
Total 12,076,047.8519 26
Regression output confidence interval
variables coefficients std. error t (df=25) p-value 95% lower 95% upper std. coeff.
Intercept 2,118.6121 238.6611 8.877 3.35E-09 1,627.0804 2,610.1437 0.000
MONTH 35.0012 13.7503 2.545 .0175 6.6819 63.3204 0.454
Studentized
Studentized Deleted
Observation FOODNITE Predicted Residual Leverage Residual Residual
1 2,107.0 2,153.6 -46.6 0.134 -0.081 -0.079
2 2,141.0 2,188.6 -47.6 0.121 -0.082 -0.080
3 3,123.0 2,223.6 899.4 0.108 1.538 1.584
4 2,586.0 2,258.6 327.4 0.097 0.556 0.548
5 2,288.0 2,293.6 -5.6 0.087 -0.009 -0.009
6 2,454.0 2,328.6 125.4 0.077 0.211 0.207
7 2,171.0 2,363.6 -192.6 0.069 -0.322 -0.316
8 2,747.0 2,398.6 348.4 0.061 0.581 0.573
9 1,404.0 2,433.6 -1,029.6 0.055 -1.710 -1.783
10 1,642.0 2,468.6 -826.6 0.050 -1.369 -1.395
11 1,456.0 2,503.6 -1,047.6 0.045 -1.731 -1.808
12 2,486.0 2,538.6 -52.6 0.042 -0.087 -0.085
13 2,497.0 2,573.6 -76.6 0.039 -0.126 -0.124
14 2,465.0 2,678.6 -213.6 0.037 -0.352 -0.345
15 2,183.0 2,713.6 -530.6 0.039 -0.874 -0.870
16 3,589.0 2,748.6 840.4 0.041 1.386 1.413
17 3,010.0 2,783.6 226.4 0.045 0.374 0.367
18 3,275.0 2,818.6 456.4 0.049 0.756 0.749
19 3,225.0 2,853.6 371.4 0.055 0.617 0.609
20 3,448.0 2,888.6 559.4 0.061 0.932 0.929
21 3,835.0 2,923.6 911.4 0.068 1.524 1.568
22 3,785.0 2,958.6 826.4 0.077 1.388 1.416
23 3,198.0 2,993.6 204.4 0.086 0.345 0.339
24 2,657.0 3,028.6 -371.6 0.096 -0.631 -0.623
25 3,054.0 3,063.6 -9.6 0.108 -0.016 -0.016
26 2,930.0 3,098.6 -168.6 0.120 -0.290 -0.285
27 1,657.0 3,133.6 -1,476.6 0.133 -2.561 -2.921
Regression Analysis
r² 0.027 n 27
r -0.164 k 1
Std. Error 634.814 Dep. Var. ROOMS
ANOVA table
Source SS df MS F p-value
Regression 280,166.7841 1 280,166.7841 0.70 .4123
Residual 10,074,728.6233 25 402,989.1449
Total 10,354,895.4074 26
Regression output confidence interval
variables coefficients std. error t (df=25) p-value 95% lower 95% upper std. coeff.
Intercept 4,786.8469 244.6132 19.569 1.13E-16 4,283.0567 5,290.6371 0.000
MONTH -11.7509 14.0932 -0.834 .4123 -40.7764 17.2746 -0.164
Studentized
Studentized Deleted
Observation ROOMS Predicted Residual Leverage Residual Residual
1 4,154.0 4,775.1 -621.1 0.134 -1.051 -1.054
2 4,457.0 4,763.3 -306.3 0.121 -0.515 -0.507
3 5,077.0 4,751.6 325.4 0.108 0.543 0.535
4. 4 4,456.0 4,739.8 -283.8 0.097 -0.471 -0.463
5 4,733.0 4,728.1 4.9 0.087 0.008 0.008
6 5,383.0 4,716.3 666.7 0.077 1.093 1.098
7 5,010.0 4,704.6 305.4 0.069 0.499 0.491
8 5,030.0 4,692.8 337.2 0.061 0.548 0.540
9 5,372.0 4,681.1 690.9 0.055 1.120 1.126
10 4,889.0 4,669.3 219.7 0.050 0.355 0.349
11 4,295.0 4,657.6 -362.6 0.045 -0.584 -0.577
12 3,425.0 4,645.8 -1,220.8 0.042 -1.964 -2.093
13 3,893.0 4,634.1 -741.1 0.039 -1.191 -1.201
14 4,395.0 4,598.8 -203.8 0.037 -0.327 -0.321
15 4,524.0 4,587.1 -63.1 0.039 -0.101 -0.099
16 5,044.0 4,575.3 468.7 0.041 0.754 0.747
17 5,174.0 4,563.6 610.4 0.045 0.984 0.983
18 6,331.0 4,551.8 1,779.2 0.049 2.874 3.442
19 4,706.0 4,540.1 165.9 0.055 0.269 0.264
20 4,259.0 4,528.3 -269.3 0.061 -0.438 -0.431
21 4,284.0 4,516.6 -232.6 0.068 -0.380 -0.373
22 3,364.0 4,504.8 -1,140.8 0.077 -1.870 -1.976
23 4,250.0 4,493.1 -243.1 0.086 -0.401 -0.394
24 4,342.0 4,481.3 -139.3 0.096 -0.231 -0.226
25 5,006.0 4,469.6 536.4 0.108 0.894 0.891
26 4,761.0 4,457.8 303.2 0.120 0.509 0.501
27 3,860.0 4,446.1 -586.1 0.133 -0.992 -0.991
normal distribution
P(lower) P(upper) z
.5000 .5000 0.00
t-distribution
df =
Hypothesis Test: Independent Groups (t-test, pooled variance)
ROOMS Predicted
4,610.148 4,610.148 mean
631.083 103.806 std. dev.
27 27 n
52 df
0.0000 difference (ROOMS - Predicted)
204,520.4268 pooled variance
452.2393 pooled std. dev.
123.0840 standard error of difference
0 hypothesized difference
0.00 t
1.0000 p-value (two-tailed)
F-distribution
df1 =
Hypothesis Test: Mean vs. Hypothesized Value
736,997.000 hypothesized value
26,321.321 mean BEVTOTAL
4,714.216 std. dev.
890.903 std. error
28 n
27 df
-797.70 t
1.43E-60 p-value (two-tailed)
Confidence interval - mean
95% confidence level
5. 736997 mean
24443 std. dev.
28 n
1.960 z
9053.648 half-width
746050.648 upper confidence limit
727943.352 lower confidence limit
11. MONTH BEVTOTAL BEVPUB BEVNITE FOODTOT FOODPUB FOODNITE ROOMS
7 19051 8001 11050 2381 210 2171 5010
8 19235 8636 10599 2977 230 2747 5030
17 19624 6764 12860 2183 0 2183 4524
6 20404 6076 14328 2674 220 2454 5383
18 20459 6524 13935 3589 0 3589 5044
19 20956 4209 16747 3010 0 3010 5174
5 21447 7011 14436 2508 220 2288 4733
9 21498 9064 12434 1624 220 1404 5372
2 22924 7238 15686 2341 200 2141 4457
13 23483 8186 15297 2497 0 2497 3893
1 24443 7254 17189 2317 210 2107 4154
11 25600 7794 17806 1676 220 1456 4295
16 26004 7703 18301 2465 0 2465 4395
10 26619 8760 17859 1852 210 1642 4889
3 27501 8150 19351 3353 230 3123 5077
26 28163 4421 23742 2657 0 2657 4342
30 28896 6222 22674 2407 0 2407 5300
21 29098 5321 23777 3225 0 3225 4706
4 29282 8081 21201 2796 210 2586 4456
29 29468 5180 24288 1657 0 1657 3860
20 29754 7084 22670 3275 0 3275 6331
25 30095 6935 23160 3198 0 3198 4250
12 30373 8171 22202 2706 220 2486 3425
22 30559 5879 24680 3448 0 3448 4259
23 31038 5882 25156 3835 0 3835 4284
28 33139 6033 27106 2930 0 2930 4761
24 33833 4440 29393 3785 0 3785 3364
27 34051 5561 28490 3054 0 3054 5006
736997
26321.32
12. VARIABLES
MONTH = Month number (1=January)
BEVTOTAL = Total beverage sales, pub and nightclub
BEVPUB = Beverage sales for pub
BEVNITE = Beverage sales for night club
FOODTOT = Total amount spent on food, pub and night club.
FOODPUB = Amount spent on food for pub.
FOODNITE = Amount spent on food for night club.
ROOMS = Total room occupancy for Westar.