Center for Employment Opportunities
•
1 gefällt mir•467 views

The Center for Employment Opportunities (CEO) offers services exclusively for people with criminal records, focusing on life skills education, short-term paid transitional employment, full-time job placement, and post-placement support. CEO generates about 75% of its revenue from government contracts for services like maintenance and cleaning. It serves around 2,000 participants annually at a relatively low cost of $8,000 per person. CEO has demonstrated success in increasing employment and reducing criminal recidivism, though it has not shown consistent effects on long-term employment rates.

Empfohlen
Weitere ähnliche Inhalte
Ähnlich wie Center for Employment Opportunities
Ähnlich wie Center for Employment Opportunities (20)
Mehr von Nonprofit Investor
Mehr von Nonprofit Investor (20)
Center for Employment Opportunities
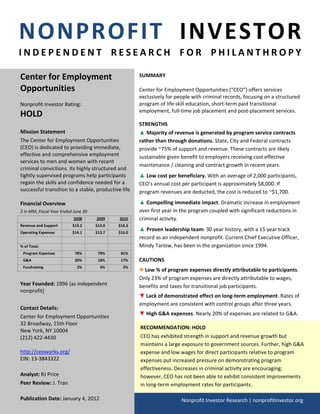
- 1. NONPROFIT INVESTOR I N D E P E N D E N T R E S E A R C H F O R P H I L A N T H R O P Y Center for Employment SUMMARY Opportunities Center for Employment Opportunities (“CEO”) offers services exclusively for people with criminal records, focusing on a structured Nonprofit Investor Rating: program of life skill education, short‐term paid transitional employment, full‐time job placement and post‐placement services. HOLD STRENGTHS Mission Statement ▲ Majority of revenue is generated by program service contracts The Center for Employment Opportunities rather than through donations. State, City and Federal contracts (CEO) is dedicated to providing immediate, provide ~75% of support and revenue. These contracts are likely effective and comprehensive employment sustainable given benefit to employers receiving cost effective services to men and women with recent maintenance / cleaning and contract growth in recent years. criminal convictions. Its highly structured and tightly supervised programs help participants ▲ Low cost per beneficiary. With an average of 2,000 participants, regain the skills and confidence needed for a CEO’s annual cost per participant is approximately $8,000. If successful transition to a stable, productive life program revenues are deducted, the cost is reduced to ~$1,700. Financial Overview ▲ Compelling immediate impact. Dramatic increase in employment $ in MM, Fiscal Year Ended June 30 over first year in the program coupled with significant reductions in 2008 2009 2010 criminal activity. Revenue and Support $13.2 $14.0 $16.3 Operating Expenses $14.1 $13.7 $16.0 ▲ Proven leadership team. 30 year history, with a 15 year track record as an independent nonprofit. Current Chief Executive Officer, % of Total: Mindy Tarlow, has been in the organization since 1994. Program Expenses 78% 78% 81% G&A 20% 18% 17% CAUTIONS Fundraising 2% 3% 2% ● Low % of program expenses directly attributable to participants. Only 23% of program expenses are directly attributable to wages, Year Founded: 1996 (as independent benefits and taxes for transitional job participants. nonprofit) ▼ Lack of demonstrated effect on long‐term employment. Rates of employment are consistent with control groups after three years. Contact Details: ▼ High G&A expenses. Nearly 20% of expenses are related to G&A. Center for Employment Opportunities 32 Broadway, 15th Floor RECOMMENDATION: HOLD New York, NY 10004 (212) 422‐4430 CEO has exhibited strength in support and revenue growth but maintains a large exposure to government sources. Further, high G&A http://ceoworks.org/ expense and low wages for direct participants relative to program EIN: 13‐3843322 expenses put increased pressure on demonstrating program effectiveness. Decreases in criminal activity are encouraging; Analyst: RJ Price however, CEO has not been able to exhibit consistent improvements Peer Review: J. Tran in long‐term employment rates for participants. Publication Date: January 4, 2012 Nonprofit Investor Research | nonprofitinvestor.org
- 3. (especially given the opening of U.S. Federal funding for the program) could be best supplemented by private employment programs to simultaneously grow support & revenue while also providing experience for participants in the non‐government job market, where presumably they will find employment long‐term. Detailed Financial Statement (GAAP basis)(1) Fiscal Year Ended June 30 2007 2008 2009 2010 Public Support & Revenue Program Service Contracts United States Direct Federal $0 $0 $0 $173,882 New York State 7,346,608 8,180,860 7,945,410 9,923,475 New York City 3,557,255 1,936,242 2,802,439 2,402,405 Other 160,778 181,706 84,756 29,046 Subtotal $11,064,641 $10,298,808 $10,832,605 $12,528,808 Unrestricted Contributions $3,115,345 $2,106,365 $2,166,311 $2,940,310 Disposal of Fixed Assets 0 (20,139) 0 0 Interest and Other Income 50,535 14,842 35,621 34,205 Net Assets Released from Restrictions 718,872 823,763 998,988 842,044 Total Public Support & Revenue $14,949,393 $13,223,639 $14,033,525 $16,345,367 % Growth (12%) 6% 16% Public Support & Revenue Sources Federal Contract 0% 0% 0% 1% NY State Contract 49% 62% 57% 61% NYC Contract 24% 15% 20% 15% Contributions 26% 22% 23% 23% Other 1% 1% 1% 0% Expenses Program Services $11,481,608 $11,002,961 $10,763,401 $12,924,837 General & Administrative 2,894,852 2,821,956 2,537,977 2,675,673 Fund Raising 136,075 259,896 428,736 399,597 Total Expenses $14,512,535 $14,084,813 $13,730,114 $16,000,107 % of Support & Revenue 97% 107% 98% 98% Expense Allocation (% of Total) Program Services 79% 78% 78% 81% General & Administrative 20% 20% 18% 17% Fund Raising 1% 2% 3% 2% Public Support & Revenue Less Expenses $436,858 ($861,174) $303,411 $345,260 Restricted Contributions 540,000 914,000 940,000 830,000 Net Assets Released from Restrictions (718,872) (823,763) (998,988) (842,044) Change in Net Assets $257,986 ($770,937) $244,423 $333,216 Average Individuals in the Program(2) 2,000 2,000 2,000 2,000 Total Expenses per Individual $7,256 $7,042 $6,865 $8,000 Total Expenses (excluding Program Revenue) per Individual 1,724 1,893 1,449 1,736 Source: Audited Financial Statements (prepared on GAAP basis), MDRC report "Transitional Jobs: Background, Program Models, and Evaluation Evidence" (Feb 2010) (1) According to financial statements (prepared on GAAP basis) as audited by Schall & Ashenfarb, LLC (2) According to MDRC report (Feb 2010) CEO has consistently spent ~20% of total expenses through General & Administrative costs. In 2009‐2010 this percentage declined slightly, and further decline in subsequent years will be paramount to push increased expenditure Center for Employment Opportunities | Nonprofit Investor Research 3
- 4. focus on program services. Furthermore, a breakout of 2010 functional expenses shows that of the ~$12.9M spent on program services, $3.3M was spent on non‐personnel charges, $0.6M was spent on payroll taxes and an additional $6.2M went to staff wages and benefits, leaving only ~$2.8M to be spent on wages and benefits for participants in CEO’s transitional jobs. Expense Breakdown Support & Revenue Breakdown $ in MM $20.0 100% $20.0 $18.0 81% 90% $18.0 79% 78% 78% $16.3 $16.0 $16.0 80% $16.0 $14.9 $14.5 $14.1 $14.0 $13.7 $14.0 70% $14.0 $13.2 $12.0 60% $12.0 $10.0 50% $10.0 $8.0 40% $8.0 $6.0 30% $6.0 $4.0 20% $4.0 $2.0 10% $2.0 $0.0 0% $0.0 2007 2008 2009 2010 2007 2008 2009 2010 Program Services General & Administrative Other Net Assets Released from Restrictions Fund Raising Program Expense % of Total Unrestricted Contributions Program Service Contracts 2010 Functional Expenses (GAAP Basis) Program Services Supporting Services Transitional Vocational CEO Fund 2010 Jobs Services Academy Subtotal G&A Raising Total Personnel Wages & Benefits Staff $2,443,765 $3,114,350 $615,168 $6,173,283 $1,662,642 $228,389 $8,064,314 Participants 2,785,172 0 0 2,785,172 0 0 2,785,172 Payroll Taxes Staff 162,091 213,137 43,599 418,827 112,883 14,445 546,155 Participants 203,541 0 0 203,541 0 0 203,541 Total Personnel $5,594,569 $3,327,487 $658,767 $9,580,823 $1,775,525 $242,834 $11,599,182 Non‐Personnel $911,950 $1,850,346 $462,886 $3,225,182 $878,452 $156,763 $4,260,397 Depreciation 66,936 26,700 25,196 118,832 21,696 0 140,528 Total Expenses $6,573,455 $5,204,533 $1,146,849 $12,924,837 $2,675,673 $399,597 $16,000,107 Personnel (Staff) 40% 64% 57% 51% 66% 61% 54% Personnel (Participants) 45% 0% 0% 23% 0% 0% 19% Non‐Personnel 14% 36% 40% 25% 33% 39% 27% Depreciation 1% 1% 2% 1% 1% 0% 1% High levels of spending on G&A, fundraising and non‐participant program services expenditures, puts increased focus on the effectiveness of CEO’s ability to increase employment and to reduce recidivism amongst its participants. Center for Employment Opportunities | Nonprofit Investor Research 4
- 5. PROGRAM RESULTS AND EFFECTIVENESS CEO does not publicly release data on their programs’ effectiveness on increasing employment rates and reducing recidivism amongst its participants. Instead, this report relies on the analysis performed by the MDRC, an independent organization that performs evaluations of policies and programs targeted to low‐income people. In February 2010, the MDRC prepared a paper titled “Transitional Jobs: Background, Program Models, and Evaluation Evidence” directed towards the Administration for Children and Families and the Office of the Assistant Secretary for Planning and Evaluation. As part of this paper, MDRC evaluated CEO’s transitional jobs and vocational services programs. In 2004‐ 2005, nearly 1,000 parolees were randomly assigned to a “Program Group” eligible for CEO’s transitional jobs program or to a “Control Group” only eligible for CEO’s basic job search assistance. Program and Control participants were tracked over a three year period for employment rates and criminal activity. % Employed (INCLUDING Transitional Jobs) % Employed (EXCLUDING Transitional Jobs) 70% Program Control 70% Program Control 60% 60% 50% 50% % Employed % Employed 40% 40% 30% 30% 20% 20% 10% 10% 0% 0% 0 1 2 3 4 5 6 7 8 9 10 11 12 0 1 2 3 4 5 6 7 8 9 10 11 12 Quarters Relative to Random Assignment Quarters Relative to Random Assignment When accounting for total sources of employment, CEO’s programs produce a dramatically increased employment rate for the first year that over time converges back to the levels experience in the control group. Furthermore, when adjusting to exclude transitional jobs, the program group performs worse than the control group over the first year (indicating that if not for transitional jobs, some participants would have found employment on their own) and comparable to the control group over the last two years. One area where CEO’s impact is undisputed is its ability to reduce criminal activity amongst participants. Arrests, convictions and incarceration all decreased significantly for participants, especially those of whom were recently released from prison. Three‐Year Impacts on Recidivism Total Recently Released from Prison Outcome Program Control Difference Program Control Difference Arrested 48.2% 53.0% (4.8%) 49.1% 59.1% (10.0%) Convicted of a Crime 43.1% 48.8% (5.7%) 44.0% 56.7% (12.7%) Felony 10.0% 11.7% (1.7%) NA NA NA Misdemeanor 34.0% 39.3% (5.3%) NA NA NA Violent Crime 7.0% 9.5% (2.5%) 5.4% 14.3% (8.9%) Incarcerated 58.4% 65.3% (6.9%) 60.2% 71.3% (11.1%) For New Crime 22.3% 26.1% (3.8%) NA NA NA For Technical Parole Violation 37.1% 35.6% 1.5% NA NA NA Total Days 172 186 (14) NA NA NA Arrested, Convicted or Incarcerated 65.2% 70.9% (5.7%) NA NA NA Sample Size (Total: 977) 568 409 225 160 Center for Employment Opportunities | Nonprofit Investor Research 5
- 6. TRANSPARENCY CEO's website provides information about the organization's programs, leadership and financial situation. Program services expenses are well documented in their audited financial statements, with detailed breakout of personnel costs (staff vs. participants) and non‐personnel expenditures. However, CEO provides limited analysis of the results of their efforts and efficacy of their programs, forcing potential donors to rely on third‐party analysis. CEO files its Form 990 with the IRS each year and its financial statements are regularly audited by the accounting firm Schall & Ashenfarb, LLC. OTHER THIRD PARTY RATINGS GiveWell states that CEO “does not currently qualify for our highest ratings”, but GiveWell does not mention what rating it ascribes to CEO. Similar to NPI’s findings, GiveWell struggled with CEO’s lack of demonstrated increases in employment rates amongst participants. Philanthropedia’s expert network rated CEO a “2010 Top Non‐Profit” with 18 experts viewing CEO as the nonprofit with the most impact in its field, while 6 experts disagreed with that assessment. o Strengths include: Compelling increase in employment and reduction of criminal activity for immediate period out of prison. Operational strength in marketing, finance and data tracking / management. Strong, consistent leadership under Mindy Tarlow and her team. o Areas for Improvement include: Programs to increase long‐term retention and employment. Personal / social services related to relationship counseling and child support. Increasing communication to the public and employers on / program results / lessons learned. GET INVOLVED Be an employer: http://ceoworks.org/services/who‐we‐serve/employers/ Donate: http://ceoworks.org/support‐us/donate/ Stay in touch: http://ceoworks.org/stayintouch/ DISCLOSURES RJ does not have any affiliation with Center for Employment Opportunities and has never made a donation to the organization. NPI analysts and NPI as an organization do not receive any form of compensation from reviewed charities. Center for Employment Opportunities | Nonprofit Investor Research 6