Measuring Memories - my Health History Timeline
•Als PPT, PDF herunterladen•
0 gefällt mir•316 views

I created a health history timeline that helped me tell my story better.

Empfohlen
Empfohlen
Weitere ähnliche Inhalte
Kürzlich hochgeladen
Kürzlich hochgeladen (20)
Empfohlen
Empfohlen (20)
Measuring Memories - my Health History Timeline
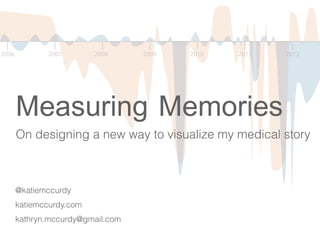
- 1. @katiemccurdy katiemccurdy.com kathryn.mccurdy@gmail.com Measuring Memories On designing a new way to visualize my medical story
- 3. A strong smile A weak smile
- 6. Me: Uhhhhh…. Dr: Tell me your story
- 15. I could tell a more coherent story
- 17. I felt more in control
- 19. Making memories visible solved my communication problem
- 20. Thanks! @katiemccurdy katiemccurdy.com kathryn.mccurdy@gmail.com Let’s co-design with patients to solve real problems
Hinweis der Redaktion
- I want to talk to you about how I solved a common communication problem by using my design skills.
- When I was 13 I was sitting at the dinner table with my family laughing at something my brother said. My mom said 'what's wrong with you, why are you making that face?' I ran to the bathroom and as much as I tried to smile, it looked like a grimace.
- I was diagnosed with the autoimmune disease Myasthenia Gravis, which causes weakness in voluntary muscles, mostly in my face. My smile is affected, and sometimes I have a hard time chewing or talking for long periods.
- I also get droopy eyelids and have some double vision and once in awhile, when I have a serious flare-up, my double vision gets so bad that I have to wear an eye patch. I’ve been on prednisone for 17 years now, and cellcept for a year and a half.
- But over time I realized my autoimmune disease wasn’t accounting for all my symptoms. Did I have another disease? Was some of this due to medication side effects? I had no clue. So I decided to look around for a new doctor.
- I found a holistic doctor and made an appointment, but I wasn't sure how to even start explaining my complex, 20-year story to him. I’ve also moved around a lot and didn’t have easy access to my medical records.
- By trade I’m a user experience designer, and my job is to simplify the complex and make things confusing systems easier to understand and visualize. I decided that the best way to tell my story would be to visualize my most significant symptoms on a timeline.
- My first step was to plot all of the major events I could remember regarding my two most significant symptoms: weakness, and gut issues. I recorded these using pencil and paper on a timeline stretching from birth to the present day.
- I didn't have my medical records at the time, so I did all of this from memory. I clearly remembered the times when I was doing well, which I indicated with positive y-axis values, and the times I was doing poorly, when I felt ‘down,’ as negative y-axis values.
- I also added notes for those points in time when I'd taken antibiotics or changed medications. It wasn’t a perfect science, but I was surprised how much I remembered and how robust my graph started looking.
- My next step was to go into Adobe illustrator and overlay these timelines on top of each other. I used the peach color to indicate ‘guts’ and the blue color to indicate Myasthenia Gravis.
- I printed the timeline on 3 pieces of regular paper and taped it together. I went to my doctor visit excited and ready to tell my story.
- When the doctor came into the exam room, I walked him through my story, using my finger to point to the high and low points as I talked about them.
- He listened and followed my hand as I gestured, but he didn’t ask questions about the timeline or engage with it. He didn’t seem excited.
- I felt a little sad, but I felt MUCH more organized in my speech and I remembered everything I wanted to say.
- After that visit I put the timeline PDF on my ipad and took it to a few different doctor visits. Most have seemed pretty interested in engaging with it and zooming in to try to find connections and discover trends.
- I learned some important things through this process, I felt a new sense of control over my illnesses and symptoms. I could see them, make sense of them, and start to see trends.
- I learned that antibiotics were probably made me sicker. My symptoms always came back worse than ever. Seeing the increasing number of antibiotic rounds and the increasingly low points on my graph made me change my behavior and stop asking for antibiotics, and in fact refuse them.
- You can see that this was a classic design problem. By identifying the problem, prototyping a medical history visualization, and testing with real users (doctors), I was able to solve one of my big communication problems as a patient.
- My call to action is for us to co-design with patients to help solve other real patient problems