Session 12 4th edition PMP
•Als PPTX, PDF herunterladen•
3 gefällt mir•1,114 views


Empfohlen
Weitere ähnliche Inhalte
Was ist angesagt?
Was ist angesagt? (20)
Andere mochten auch
Andere mochten auch (19)
Ähnlich wie Session 12 4th edition PMP
Ähnlich wie Session 12 4th edition PMP (20)
Kürzlich hochgeladen
Kürzlich hochgeladen (16)
Session 12 4th edition PMP
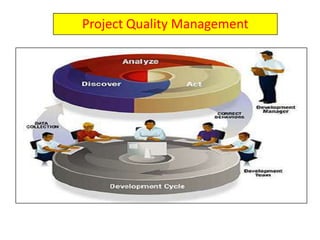
- 2. . Project Quality Management Knowledge Area Process Initiating Planning Executing Monitoring & Contol Closing Quality Quality Planning Perform Quality - Assurance Perform Quality - Control Enter phase/ Start project Exit phase/ End project Initiating Processes Closing Processes Planning Processes Executing Processes Monitoring & Controlling Processes
- 3. Project Quality Management • Quality is degree to which the project fulfills requirements • Quality Management includes creating and following policies and procedures to ensure that a project meet the defined needs (from the customer’s perspective). • Completing project with no deviations from the project requirements.
- 4. Quality Concepts • Quality vs. Grade – Quality: the degree to which a set of inherent characteristics fulfill requirements – Quality level that fails to meet quality requirements is always a PROBLEM – Grade: a category assigned to product or service having the same functional use but different technical characteristics – Low grade may not be a problem
- 5. DEMING, W. Edward Continuous improvement PDCA (Plan–Do–Check– Act) Top down support ( top management support ) CROSBY, Philip Performance standard is “Zero defect “ Cost of quality is measured by cost of non- conformance Conformance to requirements Quality comes from Prevention JURAN, J. Moses Fitness for use Technical / Statistical focus Juran’s Trilogy : Quality improvement, Quality planning and Quality Control Quality Management Gurus
- 6. Important points • Customer satisfaction • Conformance to requirement • Fitness for use: product/service produced must satisfy real needs • Prevention over inspection • Cost of preventing mistakes < cost of correcting • Quality is planned not inspected in • Continuous improvement (Kaizen) • Based on PDCA cycle • Management Responsibility • Success requires the participation of all members of the project team, •but remains the responsibility of management to provide the resources needed to succeed.
- 7. Difference Between Quality Processes Quality Planning Quality Assurance Quality Control Planning Implementation Control Determine which quality standards are relevant and how to measure them Determine if the quality measurement is relevant Perform the measurement and compare to the plan
- 8. Plan Quality • The process of identifying requirement and/or standards for the project and product and documenting how the project will demonstrate compliance. Inputs 1. Scope baseline 2. Stakeholder register 3. Cost performance baseline 4. Schedule baseline 5. Risk register 6. Enterprise environmental factors 7. Organizational process assets Tools & Techniques 1. Cost benefit analysis 2. Cost of Quality (CoQ) 3. Control charts 4. Benchmarking 5. Design of experiments 6. Statistical sampling 7. Flowcharting 8. Proprietary quality management methodologies 9. Additional quality planning tools Outputs 1. Quality management plan 2. Quality metrics 3. Quality checklists 4. Process improvement plan 5. Project document updates
- 9. Cost-Benefit Analysis -The primary benefits of meeting quality requirements can include less rework, higher productivity, and increased stakeholder satisfaction. - A business case for each quality activity compares the cost of the quality step to the expected benefit.
- 10. Cost of Quality • Cost of quality (CoQ) – Looking at what the cost of conformance and nonconformance to quality and creating an appropriate balance < Image Source: PMBOK Guide 4nd Edition. PMI © 2008
- 11. Control charts Upper control limit Lower control limit Out of control Assignable/special cause Specification limit: is point determines by customer, not calculated based on control chart Normal and expected variation Usually 3 or 6 sigma Rule of seven (non random data points) Out of control Assignable/special cause Normal distribution curve
- 12. • Benchmarking comparing actual or planned project practices to those of comparable projects to identify best practices, generate ideas for improvement, and provide a basis for measuring performance.
- 13. Design of Experiments -provide the optimal conditions for the product or process, highlight the factors that influence the results -reveal the presence of interactions and synergy among the factors.
- 14. Statistical Sampling -choosing part of a population of interest for inspection - Sample frequency and sizes should be determined
- 15. Flowcharting - graphical representation of a process showing the relationships among process steps
- 16. • Proprietary Quality Management Methodologies Three Sigma, Six Sigma,
- 17. • Additional Quality Planning Tools • Brainstorming • • Affinity diagrams. • • Force field analysis: which are diagrams of the forces for and against change. • • Nominal group techniques
- 18. Output • Quality Management Plan –Contains: • Project management method • Role and responsibility in managing quality • Deliverable measurement • Standard for monitoring & control purpose • Process review • Major check points • Inspection & acceptance criteria
- 19. QUALITY MANAGEMENT PLAN Project Title: Date Prepared: Quality Roles and Responsibilities: Role: Responsibilities: 1. Describe the role needed. 2. 3. 4. 1. Describe the responsibilities associated with the role. 2. 3. 4. Quality Assurance Approach: Describe the processes, procedures, methods, tools, and techniques that will be used in performing quality assurance activities. Quality Control Approach: Describe the processes, procedures, methods, tools, and techniques that will be used in performing quality control activities. Quality Improvement Approach: Describe the processes, procedures, methods, tools, and techniques that will be used in performing quality improvement activities.
- 20. QUALITY MANAGEMENT PLAN Project Title: Date Prepared: Quality Roles and Responsibilities: Role: Responsibilities: 1.Initiate action to prevent the occurrence of non-conforming work 2.Identify, evaluate, and document quality problems 3.Recommend or initiate quality improvement solutions 4.Stop the work when non-conforming work is identified, until the deficiency is corrected 1. all personnel who manage, perform, and ensure the quality of the work Quality Assurance Approach: Develop check list to ensure all activities is performed in right method. Develop, implement, and manage the team in QA program , Provide training for the staff to ensure appropriate training quality procedures are in place, through pre-activity meetings and daily on site reviews Quality Control Approach: Provide quality control sampling and testing to develop and refine work processes to meet quality requirements and provide conformance to the contract, plans, and specifications. b. Submit documentation to the PM on a daily basis as performed and needed Quality Improvement Approach: Observation the sequence of activities can make improving in sequencing Comparing the actual performed work to plan making continuous improvement Analyzing reasons of non- conforming work
- 21. Quality metrics An operational that describes how quality control process will measure it. What are things that important to measure and decide what measurement is acceptable
- 22. QUALITY METRICS Project Title: Date Prepared: ID Item Metric Measurement Method WBS or other identifier. Item to be measured. Measurement. Method of measuring.
- 23. QUALITY METRICS Project Title: Constructing private hospital Date Prepared: ID Item Metric Measurement Method 1.1.2 Purchase of medical devices on-time performance Comparing between planned time and actual time 1.1.1.2 Test of medical devices Test coverage The variance between number of planned test and number of actual tests 1.3.1 Electrical installation staying within the approved budget by ± 10% The variance between budget and actual cost
- 24. • Quality checklists – A list of items to inspect, step to be performed and note if any defects found – Checklists range from simple to complex based on project requirements and practices.
- 25. Process Improvement Plan •Process boundaries. Describes the purpose of processes, their start and end, their inputs/outputs, the data required, the owner, and the stakeholders. • Process configuration. A graphic depiction of processes, with interfaces identified, used to facilitate analysis. • Process metrics. Along with control limits, allows analysis of process efficiency. • Targets for improved performance. Guides the process improvement activities
- 26. – Six Sigma uses the DMAIC steps as a road map for improving processes. – There are only 5 steps. – They are logical and they can be used to improve any processes in any industry. DMAIC – The Road Map for Improving Results Control Im prove A nalyze Measure Define Process Under Study Y = f(X1, X2, X3, ...Xn)
- 27. QUESTIONS?
- 28. 1- A planning phase for an engineering component generated 80 engineering drawings. The QA team randomly selected 8 drawings for inspection. This exercise can BEST be described as example of: A-Inspection B-Statistical Sampling C-Flowcharting D-Control Charting
- 29. 2- Quality is: 1- Meeting and exceeding the customer’s expectations 2- Adding extras to make the customer happy 3- Conformance to requirements and fitness of use 4- Conformance to management’s requirements
- 30. 3- which of the following explain why quality is planned not inspected in ? A-it reduces quality and is less expensive B- it improves quality and is more expensive C- it reduces quality and is more expensive D- it improves quality and is less expensive
- 31. 4-What are the cost types in modern quality management? A- Costs of good quality – costs of bad quality B- Planning costs – assurance costs – control costs C-Planning costs – doing costs – checking costs – acting costs D- Prevention costs – appraisal costs – failure costs
- 32. 5- all of the following are examples of the cost of nonconformance except A- rework B- quality training C-scrap D-warranty costs
- 33. 6- a control chart shows seven data points in a row on one side of the mean what should be done? A- perform a design of experiments B- Adjust the chart to reflect the new mean C- find an assignable cause D- nothing .this is the rule of seven and can be ignored
- 34. Thank you