Salaries by Economic Activity (NACE 2) in the Baltic States 3rd quarter 2016
•
1 gefällt mir•1,171 views

Average Monthly Gross Salaries by Economic Activity (NACE Rev 2) in the Baltic States 3rd quarter 2016

Empfohlen
Empfohlen
Weitere ähnliche Inhalte
Was ist angesagt?
Was ist angesagt? (19)
Andere mochten auch
Andere mochten auch (20)
Ähnlich wie Salaries by Economic Activity (NACE 2) in the Baltic States 3rd quarter 2016
Ähnlich wie Salaries by Economic Activity (NACE 2) in the Baltic States 3rd quarter 2016 (9)
Mehr von Kadri Seeder
Mehr von Kadri Seeder (20)
Kürzlich hochgeladen
Kürzlich hochgeladen (20)
Salaries by Economic Activity (NACE 2) in the Baltic States 3rd quarter 2016
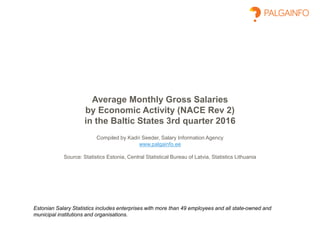
- 1. Average Monthly Gross Salaries by Economic Activity (NACE Rev 2) in the Baltic States 3rd quarter 2016 Compiled by Kadri Seeder, Salary Information Agency www.palgainfo.ee Source: Statistics Estonia, Central Statistical Bureau of Latvia, Statistics Lithuania Estonian Salary Statistics includes enterprises with more than 49 employees and all state-owned and municipal institutions and organisations.
- 2. 0 500 1000 1500 2000 Agriculture, forestry and fishing Mining and quarrying Manufacturing Electricity, gas, steam and air conditioning supply Water supply; sewerage, waste management and… Construction Wholesale and retail trade; Repair of motor… Transportation and storage Accommodation and food service activities Information and communication Financial and insurance activities Real estate activities Professional, scientific and technical activities Administrative and support service activities Public administration and defence; compulsory… Education Human health and social work activities Arts, entertainment and recreation Other service activities Average monthly gross wage by economic activity, 3rd quarter of 2016, EUR Estonia Latvia Lithuania Source: Statistics Estonia, Central Statistical Bureau of Latvia, Statistics Lithuania
- 3. -5% 0% 5% 10% 15% 20% Agriculture, forestry and fishing Mining and quarrying Manufacturing Electricity, gas, steam and air conditioning supply Water supply; sewerage, waste management and remediation activities Construction Wholesale and retail trade; Repair of motor vehicles and motorcycles Transportation and storage Accommodation and food service activities Information and communication Financial and insurance activities Real estate activities Professional, scientific and technical activities Administrative and support service activities Public administration and defence; compulsory social security Education Human health and social work activities Arts, entertainment and recreation Other service activities Change of average monthly gross wage by economic activity, 3rd Q 2015/16 The same quarter of previous year = 100 Estonia Latvia Lithuania Source: Statistics Estonia, Central Statistical Bureau of Latvia, Statistics Lithuania
- 4. 1088 1004 1348 730 831 726 972 608 715 721 689 807 0 200 400 600 800 1000 1200 1400 1600 1800 2000 (A) AGRICULTURE, FORESTRY AND FISHING (A 01) Crop and animal production, hunting and related service activities (A 02) Forestry and logging (A 03) Fishing and aquaculture Average monthly gross salary, III quarter 2016 AGRICULTURE, FORESTRY AND FISHING (A1–3) Estonia Latvia Lithuania
- 5. 1089 1001 1417 805 730 984 822 786 0 200 400 600 800 1000 1200 1400 1600 1800 2000 (C) MANUFACTURING (C 10) Manufacture of food products (C 11) Manufacture of beverages Average monthly gross salary, III quarter 2016 MANUFACTURE OF FOOD AND BEVERAGES (C10–12) Estonia Latvia Lithuania *Lithuania – C 10 = (C10-12) Manufacture of food products, beverages and tobacco
- 6. 907 687 720 618 526 568 708 596 571 0 200 400 600 800 1000 1200 1400 1600 1800 2000 (C 13) Manufacture of textiles (C 14) Manufacture of wearing apparel (C 15) Manufacture of leather and related products Average monthly gross salary, III quarter 2016 MANUFACTURE OF TEXTILES, WEARING APPAREL AND LEATHER PRODUCTS (C13–15) Estonia Latvia Lithuania
- 7. 1171 1251 1208 972 765 860 934 647 773 749 0 200 400 600 800 1000 1200 1400 1600 1800 2000 (C 16) Manufacture of wood and of products of wood (C 17) Manufacture of paper and paper products (C 18) Printing and reproduction of recorded media (C 31) Manufacture of furniture Average monthly gross salary, III quarter 2016 MANUFACTURE OF WOOD AND PAPER PRODUCTS, FURNITURE, PRINTING INDUSTRY (C16–18, C31) Estonia Latvia Lithuania *Lithuania – C 16 = (C16-18) Manufacture of wood, paper, printing and reproduction
- 8. 1287 1088 1468 808 785 1138 1218 900 0 200 400 600 800 1000 1200 1400 1600 1800 2000 (C 20) Manufacture of chemicals and chemical products (C 22) Manufacture of rubber and plastic products (C 23) Manufacture of other non-metallic mineral products Average monthly gross salary, III quarter 2016 MANUFACTURE OF CHEMICAL, RUBBER, PLASTIC AND NON-METALLIC MINERAL PRODUCTS (C20–23) Estonia Latvia Lithuania *Lithuania – C 22 = (C22-23) Manufacture of rubber and plastics products, and other non-metallic mineral products
- 9. 1388 1311 1129 1176 1418 808 878 1185 894 909 875 1212 795 954 0 200 400 600 800 1000 1200 1400 1600 1800 2000 (C 24) Manufacture of basic metals (C 25) Manufacture of fabricated metal products, except machinery and equipment (C 26) Manufacture of computer, electronic and optical products (C 27) Manufacture of electrical equipment (C 28) Manufacture of machinery and equipment n.e.c. Average monthly gross salary, III quarter 2016 MANUFACTURE OF METAL PRODUCTS, MACHINERY AND EQUIPMENT (C24–28) Estonia Latvia Lithuania *Lithuania – C 25 = (C24-25) Manufacture of basic metals and fabricated metal products
- 10. 1166 1003 1361 1019 846 665 799 893 0 200 400 600 800 1000 1200 1400 1600 1800 2000 (C 29) Manufacture of motor vehicles, trailers and semi-trailers (C 30) Manufacture of other transport equipment (C 32) Other manufacturing (C 33) Repair and installation of machinery and equipment Average monthly gross salary, III quarter 2016 MANUFACTURE OF VEHICLES AND TRANSPORT EQUIPMENT, REPAIR MACHINERY (C29–30, C32–33) Estonia Latvia Lithuania
- 11. 1597 1126 1216 1196 1243 830 958 763 801 704 1024 792 778 0 200 400 600 800 1000 1200 1400 1600 1800 (D) ELECTRICITY, GAS, STEAM AND AIR CONDITIONING SUPPLY (E) WATER SUPPLY, SEWERAGE, WASTE MANAGEMENT (E 36) Water collection, treatment and supply (E 37) Sewerage (E 38) Waste collection, treatment and disposal activities; materials recovery (E 39) Remediation activities and other waste management services Average monthly gross salary, III quarter 2016 ELECTRICITY, GAS AND WATER SUPPLY, SEWERAGE, WASTE MANAGEMENT (D–E) Estonia Latvia Lithuania
- 12. 1091 1724 1572 1504 826 803 1044 709 731 0 200 400 600 800 1000 1200 1400 1600 1800 2000 (F) CONSTRUCTION (F 41) Construction of buildings (F 42) Civil engineering (F 43) Specialised construction activities Average monthly gross salary, III quarter 2016 CONSTRUCTION (F) Estonia Latvia Lithuania
- 13. 1032 1756 1482 850 753 768 1026 612 744 0 200 400 600 800 1000 1200 1400 1600 1800 2000 (G) WHOLESALE AND RETAIL TRADE; REPAIR OF MOTOR VEHICLES AND MOTORCYCLES (G 45) Wholesale and retail trade and repair of motor vehicles and motorcycles (G 46) Wholesale trade, except of motor vehicles and motorcycles (G 47) Retail trade, except of motor vehicles and motorcycles Average monthly gross salary, III quarter 2016 TRADE (G) Estonia Latvia Lithuania
- 14. 1114 1041 1560 864 839 698 1390 1951 1009 665 766 585 0 200 400 600 800 1000 1200 1400 1600 1800 2000 (H) TRANSPORTATION AND STORAGE (H 49) Land transport and transport via pipelines (H 50) Water transport (H 51) Air transport (H 52) Warehousing and support activities for transportation (H 53) Postal and courier activities Average monthly gross salary, III quarter 2016 TRANSPORTATION AND STORAGE (H) Estonia Latvia Lithuania
- 15. 751 926 801 584 706 552 554 0 200 400 600 800 1000 1200 1400 1600 1800 2000 (I) ACCOMMODATION AND FOOD SERVICE ACTIVITIES (I 55) Accommodation (I 56) Food and beverage service activities Average monthly gross salary, III quarter 2016 ACCOMMODATION AND FOOD SERVICE ACTIVITIES (I) Estonia Latvia Lithuania
- 16. 1889 1414 1027 1611 1709 2455 1706 1336 870 688 1191 1311 1534 1211 1311 0 500 1000 1500 2000 2500 3000 (J) INFORMATION AND COMMUNICATION (J 58) Publishing activities (J 59) Motion picture, video and television programme production, sound recording and music publishing activities (J 60) Programming and broadcasting activities (J 61) Telecommunications (J 62) Computer programming, consultancy and related activities (J 63) Information service activities Average monthly gross salary, III quarter 2016 INFORMATION AND COMMUNICATION (J) Eesti Läti Leedu
- 17. 1772 1878 1901 1978 1105 1773 1896 1658 1288 741 1403 1490 719 0 500 1000 1500 2000 2500 (K) FINANCIAL AND INSURANCE ACTIVITIES (K 64) Financial service activities (K 65) Insurance, reinsurance and pension funding (K 66) Activities auxiliary to financial services and insurance activities (L) REAL ESTATE ACTIVITIES Average monthly gross salary, III quarter 2016 FINANCIAL AND INSURANCE ACTIVITIES AND REAL ESTATE ACTIVITIES (K–L) Estonia Latvia Lithuania
- 18. 1364 1800 1853 1299 1272 1367 946 920 911 1020 909 1133 901 815 1000 966 0 200 400 600 800 1000 1200 1400 1600 1800 2000 (M) PROFESSIONAL, SCIENTIFIC AND TECHNICAL ACTIVITIES (M 69) Legal and accounting activities (M 70) Activities of head offices; management consultancy activities (M 71) Architectural and engineering activities; technical testing and analysis (M 72) Scientific research and development (M 73) Advertising and market research (M 74) Other professional, scientific and technical activities Average monthly gross salary, III quarter 2016 PROFESSIONAL, SCIENTIFIC AND TECHNICAL ACTIVITIES (M) Estonia Latvia Lithuania
- 19. 1079 1450 1243 1543 834 686 1050 768 966 1099 756 546 706 954 675 0 200 400 600 800 1000 1200 1400 1600 1800 2000 (N) ADMINISTRATIVE AND SUPPORT SERVICE ACTIVITIES (N 77) Rental and leasing activities (N 78) Employment activities (N 79) Travel agency, tour operator (N 80) Security and investigation activities (N 81) Services to buildings and landscape activities (N 82) Office administrative Average monthly gross salary, III quarter 2016 ADMINISTRATIVE AND SUPPORT SERVICE ACTIVITIES (N) Estonia Latvia Lithuania
- 20. 1321 816 1192 1075 698 781 952 687 795 0 200 400 600 800 1000 1200 1400 1600 1800 2000 (O) PUBLIC ADMINISTRATION AND DEFENCE; COMPULSORY SOCIAL SECURITY (P) EDUCATION (Q) HUMAN HEALTH AND SOCIAL WORK ACTIVITIES Average monthly gross salary, III quarter 2016 PUBLIK ADMINISTRATION, EDUCATION, HUMAN HEALTH AND SOCIAL WORK (O–Q) Estonia Latvia Lithuania
- 21. 846 903 785 1168 719 824 717 706 681 880 640 1057 643 0 200 400 600 800 1000 1200 1400 1600 1800 2000 (R) ARTS, ENTERTAINMENT AND RECREATION (R 90) Creative, arts and entertainment activities (R 91) Libraries, archives, museums and other cultural activities (R 92) Gambling and betting activities (R 93) Sports activities and amusement and recreation activities (S 94) Activities of membership organisations Average monthly gross salary, III quarter 2016 ARTS, ENTERTAINMENT AND RECREATION, OTHER ACTIVITIES (R–S) Estonia Latvia Lithuania
- 22. For further information and comments please contact: The Salary Information Agency E-mail: palgauuring@palgainfo.ee https://www.palgainfo.ee