
Empfohlen
Weitere ähnliche Inhalte
Was ist angesagt?
Was ist angesagt? (16)
Mehr von jwessels (8)
Kürzlich hochgeladen
Kürzlich hochgeladen (20)
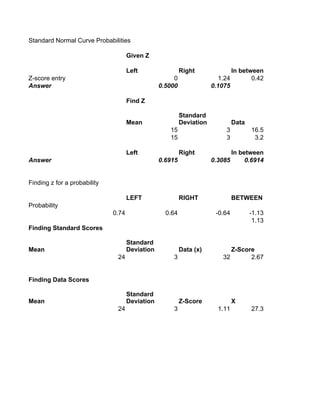
Chapter 5
- 1. Standard Normal Curve Probabilities Given Z Left Right In between Z-score entry 0 1.24 0.42 Answer 0.5000 0.1075 Find Z Standard Mean Deviation Data 15 3 16.5 15 3 3.2 Left Right In between Answer 0.6915 0.3085 0.6914 Finding z for a probability LEFT RIGHT BETWEEN Probability 0.74 0.64 -0.64 -1.13 1.13 Finding Standard Scores Standard Mean Deviation Data (x) Z-Score 24 3 32 2.67 Finding Data Scores Standard Mean Deviation Z-Score X 24 3 1.11 27.3
- 2. n between 3.15 0.3364 Zscore 0.50 -3.93 n between
- 3. Find Z Sample Size (n) Mean Standard Deviation tandard Error S Data Zscore 36 1300 250 41.67 1150 -3.60 36 1300 250 41.67 2.2 -31.15 Left Right In between Answer 0.0002 0.9998 0.0002
- 4. Binomial to Normal np nq 4 16 Standar d New Data Deviatio w/correctio n p q Mean n n Z-score 20 0.2 0.8 4 1.7889 97.5 52.27 20 0.2 0.8 4 1.79 200.5 109.85 Answers Less than Greater than In Between 1.0000 0.0000000000 0.0000000