The World Food Crisis: Political and Economic Consequences and Needed Actions
•
2 gefällt mir•2,106 views

Ministry of Foreign Affairs, Stockholm September 22, 2008
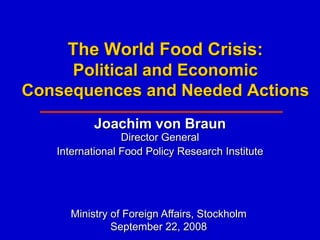
![The situation: Surge in prices
[As of August 2008]
800 140
Corn
120
600 Wheat
100
US$/barrel
Rice
US$/ton
80
400 Oil (right scale)
60
200 40
20
0 0
Joachim von Braun, IFPRI, September 2008 Source: Data from FAO 2008 and IMF 2008.](data:image/gif;base64,R0lGODlhAQABAIAAAAAAAP///yH5BAEAAAAALAAAAAABAAEAAAIBRAA7)
Empfohlen
Empfohlen
Weitere ähnliche Inhalte
Mehr von Joachim von Braun
Mehr von Joachim von Braun (20)
The World Food Crisis: Political and Economic Consequences and Needed Actions
- 1. The World Food Crisis: Political and Economic Consequences and Needed Actions Joachim von Braun Director General International Food Policy Research Institute Ministry of Foreign Affairs, Stockholm September 22, 2008
- 2. The situation: Surge in prices [As of August 2008] 800 140 Corn 120 600 Wheat 100 US$/barrel Rice US$/ton 80 400 Oil (right scale) 60 200 40 20 0 0 Joachim von Braun, IFPRI, September 2008 Source: Data from FAO 2008 and IMF 2008.
- 3. Production and Price Developments 2004/5 2005/6 2006/7 2007/8 2008/9 World grain 1.646 1.604 1.585 1.685 1.718 Prod. Mill. (July est.) Ton (excl. rice) Maize price* 97 104 163 183 186 (Sept) $/ton (Dec.) *U.S. Yellow No. 2 Corn (at the Gulf of Mexico) Joachim von Braun, IFPRI, September 2008
- 4. IFPRI’s scenarios [Models for changes in structural supply and demand factors (2000-05 and 2006-15)] US$/ton Joachim von Braun, IFPRI, September 2008 Source: M. Rosegrant (prelim. results with IMPACT-WATER).
- 5. What Food Crisis? • Political destabilization • Macro-economic / inflation • Poverty and hunger • …its causes • and what needs to be done Joachim von Braun, IFPRI, September 2008
- 6. 2007-08 timeline of food protests 30 29 25 Violent 21 20 Non-violent 15 10 8 5 4 4 2 2 2 1 1 0 Joachim von Braun, IFPRI, September 2008 Source: News reports.
- 7. Number of food protests by type and income group 20 Violent 15 Non-violent 11 7 10 5 2 9 8 8 4 0 Low income Low-middle Upper-middle High income income income Source: Protests – news reports; Joachim von Braun, IFPRI, September 2008 Income group classification – World Bank 2007.
- 8. Government effectiveness 2007 & food protests = Food protest Joachim von Braun, IFPRI, September 2008 Source: Kaufmann, Kraay, and Mastruzzi 2008.
- 9. Number of food protests by type and gov. effectiveness 18 Violent 15 Non-violent 12 8 9 7 3 1 6 8 8 8 3 6 0 0-25th 25-50th 50-75th 75-100th From low to high Source: Protests – news reports; Joachim von Braun, IFPRI, September 2008 Gov. effectiveness classification – Kaufmann et al. 2008.
- 10. What Food Crisis? • Political destabilization • Macro-economic / inflation • Poverty and hunger • …its causes • and what needs to be done Joachim von Braun, IFPRI, September 2008
- 11. Economic policy actions taken • Trade policy (restrictions, and liberalization) • Consumer subsidies • Social protection • Increased investment for supply • Monetary policy Joachim von Braun, IFPRI, September 2008
- 12. Variety of government policy responses Trade Trade Consumer Social Increase restriction liberaliz. subsidy protection supply Asia Bangladesh X X X X China X X X X India X X X X X Indonesia X X X Malaysia X X X Thailand X X X Latin America Argentina X X X X Brazil X X X Mexico X X X Peru X X X Venezuela X X X X Africa Egypt X X X X Ethiopia X X X X Ghana X X Kenya X Nigeria X X X Tanzania X X X Joachim von Braun, IFPRI, September 2008 Source: IMF, FAO, and news reports, 2007-08.
- 13. Food putting pressure on overall inflation China, y-o-y India, wholesale 25 4 Overall Overall 20 Food Food 2 15 10 0 5 0 -2 Jan-05 Jan-06 Jan-07 Jan-08 Jan-05 Jan-06 Jan-07 Jan-08 Ethiopia Mexico 6 Overall 4 Overall 4 Food Food 2 2 0 0 -2 -2 Jan-05 Jan-06 Jan-07 Jan-08 Jan-05 Jan-06 Jan-07 Jan-08 Joachim von Braun, IFPRI, September 2008 Source: Data from government statistics.
- 14. Diversity in the change of food and non- food prices inflation Corr. in 2007-08 compared to 2005 No change Increase High Ethiopia, India, Madagascar, Corr. in 2007-08 Indonesia Uganda Medium Mexico China, Vietnam Low Nigeria Joachim von Braun, IFPRI, September 2008 Source: Data from government statistics.
- 15. What Food Crisis? • Political destabilization • Macro-economic / inflation • Poverty and hunger • …its causes • and what needs to be done Joachim von Braun, IFPRI, September 2008
- 16. Beneath the $1 a day poverty line (2004) Poor ($.75 cents – $1) 485 million people Medial poor ($.50 cents – $.75 cents) 323 million people Ultra poor (less than $.50 cents) 162 million people Joachim von Braun, IFPRI, September 2008 Source: Ahmed et al. 2007.
- 17. Ultra poor mostly in Africa (2004) $0.75 and <$1: $0.50 and <$0.75: <$0.50: 485 mln 323 mln 162 mln ECA LAC ECA 0.4 mln MENA LAC 3 mln MENA LAC ECA 1. 1 mln MENA 0.2 mln 11.5 mln 19 mln 3.3 mln 16 . 6 mln 0 . 9 mln EAP SSA 8.8 mln EAP 87.0 EAP SSA 109.3 mln 5 1 mln 9 0 . 2 mln SA mln 19.7 mln SSA SA SA 121 mln 263.6 16 2 . 9 mln mln Source: Ahmed et al. 2007. Joachim von Braun, IFPRI, September 2008
- 18. The growing number of the poorest in SSA Living below US$.50/day (1990-2004) 29 30 15 5 Million 0 -15 -30 -27 -31 -45 -38 Developing World East Asia & Pacific South Asia L America & Caribb. Sub-Saharan Africa Joachim von Braun, IFPRI, September 2008 Source: Ahmed et al. 2007.
- 19. Global Hunger Index and its components (for identical countries), 1981 - 2004 1981 1990 1992 1997 2003 2004 Proportion of undernourished (%) 28.3 19.9 19.9 17.4 16.3 16.5 Underweight in children (%) 36.6 32.8 32.0 27.1 26.3 26.0 Under-five mortality rate (%) 13.0 9.9 9.6 8.9 8.0 7.9 Global Hunger Index 26.0 20.9 20.5 17.8 16.9 16.8 Joachim von Braun, IFPRI, September 2008 Source: Wiesmann, IFPRI.
- 20. New hunger estimates of FAO 2007 • undernourished people in 2007 increased by 75 million, over and above 2003-05 (to 923 million in 2007) • Asia / Pacific 41 million • Latin America / Caribbean 6 million • Near East / North Africa 4 million • Sub-Saharan Africa 24 million Joachim von Braun, IFPRI, September 2008
- 21. What Food Crisis? • Political destabilization • Macro-economic / inflation • Poverty and hunger • …its causes • and what needs to be done Joachim von Braun, IFPRI, September 2008
- 22. Sources and features of price increases 1. Energy and biofuels 2. Income and population growth 3. Slow agricultural response 4. Market and trade policy 5. Speculation and market fundamentals Joachim von Braun, IFPRI, September 2008
- 23. (1) Biofuels: Fundamental change in world food price determination Energy prices now affect not just agric. input prices, but also output prices strongly via biofuel-land competition Elastic energy demand creates price bands for agricultural commodities Increased biofuel demand in 2000-07 contributed to 30% of weighted average increase of grain prices Joachim von Braun, IFPRI, September 2008
- 24. (2) Rising consumption • Income growth (2005-07 per annum) - 9% in Asia, 6% in Africa - 2% in industrialized countries - that force is slowing down 2008/9 • Since 2000, global cereal use for: • Food 5%, feed 8% • Industrial purposes 38% Future grain consumption is driven by income growth, population growth, and feed for meat and dairy production, biofuels Joachim von Braun, IFPRI, September 2008 Sources: FAO 2003 and 2008; IMF 2008.
- 25. (3) Productivity growth is declining 6 maize Average annual growth rate (%) 5 rice wheat 4 3 2 1 0 1963 1967 1971 1975 1979 1983 1987 1991 1995 1999 2003 Joachim von Braun, IFPRI, September 2008 Source: World Development Report 2008.
- 26. (3c) Grain stocks: The world eats more than it produces Million tons 700 600 500 400 Total cereal stocks 300 200 100 China 0 2000 2001 2002 2003 2004 2005 2006 2007 2008* Source: Data from FAO 2003, 2005-08. Joachim von Braun, IFPRI, September 2008 * Forecast.
- 27. (4) Ad hoc trade measures add up to policy failures • Export bans/restrictions: - Reduce global market size, increase volatility, and harm import-dependent trading partners - Stimulate cartel formation, undermine trust, and encourage protectionism • Price controls: - Reduce farmers’ incentives to produce more food - Divert resources away from those who need them most Joachim von Braun, IFPRI, September 2008
- 28. (5) Speculation plays a role, but is mainly a symptom • 3 main categories of speculators: - Governments, farmers, households, small traders - Commercial traders - Non-commercial traders • Low stock levels and ill-designed policies promote speculation • In Q1 of 2008, volume of globally traded grain futures & options by 32% (Chicago Board of Trade) Joachim von Braun, IFPRI, September 2008
- 29. What Food Crisis? • Political destabilization • Macro-economic / inflation • Poverty and hunger • …its causes • and what needs to be done Joachim von Braun, IFPRI, September 2008
- 30. The Food Crisis Tradeoffs and Effects Energy security Political security risks risks Food security risks + Mass protests in more than 50 countries + Inflation and macro-economic imbalances + Environmental sustainability consequences Joachim von Braun, IFPRI, September 2008
- 31. IFPRI’s proposed policy actions • Emergency package: for immediate food assistance and availability needs [Implement immediately] • Resilience package: to meet ongoing and future challenges in the food system [Phase in now for future impact] Joachim von Braun, IFPRI, September 2008
- 32. Policy actions: Emergency package 1. Expand emergency and humanitarian assistance - international (price indexed) and national 2. Eliminate agricultural export restrictions - reduces price levels by up to 30% 3. Fast-impact production programs in key areas - Poorest 50% of farmers in Africa - partly publicly funded = US$2.3 billion per annum 4. Change grain and oil seeds bio-fuel policies - reduces maize price 20%, wheat 10% Joachim von Braun, IFPRI, September 2008
- 33. Policy actions: Resilience package 5. Calm markets with: - market-oriented regulation of speculation - establish global (virtual) grain bank 6. Invest in social protection - focus on child nutrition, women, and poorest 7. Investments for sustained agric. growth - global incremental public agric. investment for MDG1 = US$14 billion, Africa: US$4-5 billion per annum; with R&D in agriculture 8. Multi-lateral trade regime (WTO+) - strengthen rule based trade Joachim von Braun, IFPRI, September 2008
- 34. Implementation of actions must be sound • Country-driven and -owned programs – with prioritization and sequencing • Costs: Face the high investment needed; the benefits for people, growth, security are huge • New international governance architecture of agriculture, food, and nutrition needed • Accountability at international and national levels: independent monitoring and assessment Joachim von Braun, IFPRI, September 2008