Weitere ähnliche Inhalte
Ähnlich wie Daily livestock report dec 21 2012
Ähnlich wie Daily livestock report dec 21 2012 (15)
Mehr von joseleorcasita (20)
Daily livestock report dec 21 2012
- 1. Vol. 10, No. 246 December 21, 2012
The holiday schedule for The Daily Livestock Report is OMAHA CORN BASIS, WEEKLY
MUCH simpler than the one shown yesterday for CME Group. $/bushel
There will be no DLR on Tuesday, December 25. Otherwise, look for 0.80
us in your inbox. Monday’s DLR will be a bit abbreviated but it will con- 2010
tain the key takeaways from Friday’s USDA Cattle on Feed and Cold 0.60 Avg. '02-'11
Storage reports. Both of those reports will be released at 3:00 p.m 0.40
2011
Eastern time. Two other reports of interest will be released on Friday as 2012
well — Livestock Slaughter at 8:30 a.m. and Chickens and Eggs at 0.20
3:00 p.m. All of these can be easily accessed using the links at
0.00
www.dailylivestockreport.com.
What will corn basis look like in the year to come? That -0.20
question is likely far more widely discussed in the corn business, and
-0.40
rightfully so. But it is very important to corn users as well, especially as
they develop or refine financial plans for the coming year. As with most -0.60
questions, the trick lies in answering it!
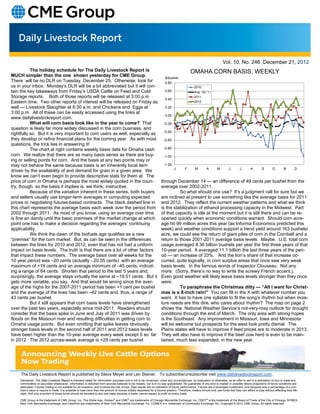
The chart at right contains weekly basis data for Omaha cash -0.80
corn. We realize that there are as many basis series as there are buy- -1.00
ing or selling points for corn. And the basis at any two points may or
may not behave the same because basis is an inherently local item -1.20
J F M A M J J A S O N D
driven by the availability of and demand for grain in a given area. We
know we can’t even begin to provide descriptive stats for them al. The
price of corn in Omaha is perhaps the most widely quoted in the coun- through December 14 — an difference of 49 cents per bushel from the
try, though, so the basis it implies is, we think, instructive. average over 2002-2011.
Because of the variation inherent in these series, both buyers So what should one use? It’s a judgment call for sure but we
and sellers usually use longer-term averages in computing expected are inclined at present to use something like the average basis for 2011
prices or negotiating futures-based contracts. The black dashed line in and 2012. They reflect the current weather patterns and what we think
this chart represents the average basis each week over the period from is the stabilization of ethanol processing capacity in the Midwest. Part
2002 through 2011. As most of you know, using an average over time of that capacity is idle at the moment but it is still there and can be re-
is fine an dandy until the basic premises of the market change at which opened quickly when economic conditions warrant. Should corn acre-
point one has to make a decision regarding the averages’ continuing age hit 99 million acres this year (as Informa Economics predicted this
applicability. week) and weather conditions support a trend yield around 163 bushels/
We think the dawn of the biofuels age qualifies as a new acre, we could see the return of giant piles of corn in the Cornbelt and a
“premise” for the corn market. But, as can be seen in the differences return to those 2001-2011 average basis levels. Maybe. U.S. total corn
between the lines for 2010 and 2012, even that has not had a uniform usage averaged 8.36 billion bushels per year the first three years of that
impact on basis levels. The truth is that there are a lot of other factors 10-year period. It averaged 11.1 billion the last three years of the peri-
that impact these numbers. The average basis over all weeks for the od — an increase of 33%. And the lion’s share of that increase oc-
10 year period was –20 cents (actually -.20.05 cents) with an average curred, quite logically, in corn surplus areas that once saw very weak
maximum of +19 cents and an average minimum of –45 cents, indicat- basis levels. In the famous words of Inspector Clouseau: Not any
ing a range of 64 cents. Shorten that period to the last 5 years and, more. (Sorry, there’s no way to write the screwy French accent.).
surprisingly, the average stays virtually the same at –19.51 cents. But it Even good weather will likely leave basis levels stronger than they once
gets more variable, you say. And that would be wrong since the aver- were.
age of the highs for the 2007-2011 period has been +1 cent per bushel To paraphrase the Christmas ditty — “All I want for Christ-
and the average of the lows has been –42 cents and, thus, a range of mas is a X-inch rain!” You can fill in the X with whatever number you
43 cents per bushel. want. It has to have one syllable to fit the song’s rhythm but when mois-
But it still appears that corn basis levels have strengthened ture needs are this dire, who cares about rhythm? The map on page 2
over the past two years, especially since mid-2011. Readers should shows the National Weather Service’s not-very-rosy outlook for drought
consider that the basis spike in June and July of 2011 was driven by conditions through the end of March. The only area with strong hopes
floods on the Missouri river and resulting difficulties in getting corn to is the Southeast. Any improvement in Missouri, Iowa and Minnesota
Omaha usage points. But even omitting that spike leaves obviously will be welcome but prospects for the west look pretty dismal. The
stronger basis levels in the second half of 2011 and 2012 basis levels Plains states will have to improve if feed prices are to moderate in 2013.
have been higher than the 10-year average every week except 5 so far They will also have to improve if the beef cow herd is even to be main-
in 2012. The 2012 across-week average is +29 cents per bushel tained, much less expanded, in the new year.
The Daily Livestock Report is published by Steve Meyer and Len Steiner. To subscribe/unsubscribe visit www.dailylivestockreport.com.
Disclaimer: The Daily Livestock Report is intended solely for information purposes and is not to be construed, under any circumstances, by implication or otherwise, as an offer to sell or a solicitation to buy or trade any
commodities or securities whatsoever. Information is obtained from sources believed to be reliable, but is in no way guaranteed. No guarantee of any kind is implied or possible where projections of future conditions are
attempted. Futures trading is not suitable for all investors, and involves the risk of loss. Past results are no indication of future performance. Futures are a leveraged investment, and because only a percentage of a con-
tract’s value is require to trade, it is possible to lose more than the amount of money initially deposited for a futures position. Therefore, traders should only use funds that they can afford to lose without affecting their life-
style. And only a portion of those funds should be devoted to any one trade because a trader cannot expect to profit on every trade.
CME Group is the trademark of CME Group, Inc. The Globe logo, Globex® and CME® are trademarks of Chicago Mercantile Exchange, Inc. CBOT® is the trademark of the Board of Trade of the City of Chicago. NYMEX,
New York Mercantile Exchange, and ClearPort are trademarks of New York Mercantile Exchange. Inc. COMEX is a trademark of Commodity Exchange, Inc. Copyright © 2012 CME Group. All rights reserved.
- 2. Vol. 10, No. 246 December 21, 2012
The Daily Livestock Report is published by Steve Meyer and Len Steiner. To subscribe/unsubscribe visit www.dailylivestockreport.com.
Disclaimer: The Daily Livestock Report is intended solely for information purposes and is not to be construed, under any circumstances, by implication or otherwise, as an offer to sell or a solicitation to buy or trade any
commodities or securities whatsoever. Information is obtained from sources believed to be reliable, but is in no way guaranteed. No guarantee of any kind is implied or possible where projections of future conditions are
attempted. Futures trading is not suitable for all investors, and involves the risk of loss. Past results are no indication of future performance. Futures are a leveraged investment, and because only a percentage of a con-
tract’s value is require to trade, it is possible to lose more than the amount of money initially deposited for a futures position. Therefore, traders should only use funds that they can afford to lose without affecting their life-
style. And only a portion of those funds should be devoted to any one trade because a trader cannot expect to profit on every trade.
CME Group is the trademark of CME Group, Inc. The Globe logo, Globex® and CME® are trademarks of Chicago Mercantile Exchange, Inc. CBOT® is the trademark of the Board of Trade of the City of Chicago. NYMEX,
New York Mercantile Exchange, and ClearPort are trademarks of New York Mercantile Exchange. Inc. COMEX is a trademark of Commodity Exchange, Inc. Copyright © 2012 CME Group. All rights reserved.