Network analysis in public health (2)
•
1 gefällt mir•1,047 views

This document provides an overview of the history and development of network analysis. It discusses how network analysis has its roots in fields like mathematics, sociology, anthropology and draws upon ideas from the 18th century. Important developments include Moreno establishing sociograms in the 1930s, Granovetter proposing weak ties in the 1970s, and the rise of social network analysis as a distinct field in the late 20th century. The document also provides a brief methodological overview of network analysis techniques.

Empfohlen
Weitere ähnliche Inhalte
Was ist angesagt?
Was ist angesagt? (20)
Andere mochten auch
Andere mochten auch (12)
Ähnlich wie Network analysis in public health (2)
Ähnlich wie Network analysis in public health (2) (20)
Mehr von Jorge Pacheco
Mehr von Jorge Pacheco (20)
Network analysis in public health (2)
- 1. ANRV305-PU28-05 ARI 6 March 2007 17:8 Network Analysis in Public Health: History, Methods, and Applications Annu. Rev. Public. Health. 2007.28:69-93. Downloaded from arjournals.annualreviews.org Douglas A. Luke and Jenine K. Harris Department of Community Health, School of Public Health, Saint Louis University, St. Louis, Missouri 63104; email: dluke@slu.edu by Dr. Douglas Luke on 05/26/07. For personal use only. Annu. Rev. Public Health 2007. 28:69–93 Key Words The Annual Review of Public Health is online at social networks, disease transmission, diffusion of innovations, http://publhealth.annualreviews.org social support, social capital This article’s doi: 10.1146/annurev.publhealth.28.021406.144132 Abstract Copyright c 2007 by Annual Reviews. Network analysis is an approach to research that is uniquely suited All rights reserved to describing, exploring, and understanding structural and relational 0163-7525/07/0421-0069$20.00 aspects of health. It is both a methodological tool and a theoretical First published online as a Review in Advance on paradigm that allows us to pose and answer important ecological January 12, 2007 questions in public health. In this review we trace the history of network analysis, provide a methodological overview of network techniques, and discuss where and how network analysis has been used in public health. We show how network analysis has its roots in mathematics, statistics, sociology, anthropology, psychology, biol- ogy, physics, and computer science. In public health, network anal- ysis has been used to study primarily disease transmission, especially for HIV/AIDS and other sexually transmitted diseases; information transmission, particularly for diffusion of innovations; the role of social support and social capital; the influence of personal and social networks on health behavior; and the interorganizational structure of health systems. We conclude with future directions for network analysis in public health. 69
- 2. ANRV305-PU28-05 ARI 6 March 2007 17:8 INTRODUCTION Network analysis, then, is the field that concerns itself with relational data and re- Over the past several decades researchers search questions. More specifically, the net- have placed increasing emphasis on using eco- work paradigm has four important features logical models and methods in the health (51): and social sciences in general, and public health in particular. The 2001 National In- 1. Network analysis is a structural ap- stitutes of Health report “Toward Higher proach that focuses in part on patterns Levels of Analysis: Progress and Promise of linkages between actors; in Research on Social and Cultural Dimen- 2. it is grounded in empirical data; sions of Health” (110) lays out an ecologi- 3. it makes frequent use of mathematical cal and multilevel national research agenda, and computational models; and and its recommendations include support for 4. it is highly graphical. Annu. Rev. Public. Health. 2007.28:69-93. Downloaded from arjournals.annualreviews.org increased use of measurement at the “group, network, neighborhood, and community lev- HISTORY AND DEVELOPMENT els” (p. 3). This recommendation recognizes OF NETWORK ANALYSIS an important gap: Although ecological think- ing is part of the mainstream in the health Network analysis has a long and complex his- by Dr. Douglas Luke on 05/26/07. For personal use only. sciences (59), we lag behind in having a vari- tory drawing on traditions in many different ety of ecological methods and tools that are research disciplines. In some cases its develop- routinely used in studies of health (95). In ment was stepwise, with new ideas building on public health, much of what we study is in- existing work; other times concurrent devel- herently relational: disease transmission, dif- opment was occurring in different fields. The fusion of innovations, coalitions, peer influ- following brief overview highlights some of ence on risky behavior, etc. Network analysis the major milestones in the development of is a research approach that is uniquely suited social network analysis. For a more detailed to describing, exploring, and understanding treatment of the history of network analysis, these types of structural and relational aspects see Freeman (51). of health. This review outlines the history of Eighteenth-century European math- network analysis, provides a brief overview ematician Leonhard Euler used a visual of network methods, and shows where and representation of a network of bridges and how network analysis has been used in public ¨ rivers to solve the now famous Konigsberg health. bridge problem (30). The problem asked A network consists of actors that represent if it was possible to walk around the town individuals, organizations, programs, or other ¨ of Konigsberg, crossing each of its seven entities. As this review shows, a network can bridges only once, and returning to the be four different things: a conceptual model, point of origin. By portraying the bridges a description of an existing real-world struc- and land as points with lines between them, ture or system, a mathematical model, or a Euler determined that no such path existed simulation. We typically depict a network as owing to the number of nodes and links. a set of actors connected by lines or arrows In doing so, Euler invented graph theory, which show some relationship between which provides one of the mathematical them. For example, Figure 1 shows tobacco foundations for network analysis. Figure 2 control agencies in Oregon. The color and ¨ shows a version of the Konigsberg map size of the nodes show the type of agency and the network developed to explore the and its role within the network; the links problem. between nodes represent contact between Throughout the 1800s and early 1900s agencies. social scientists posed questions about social 70 Luke · Harris
- 3. ANRV305-PU28-05 ARI 6 March 2007 17:8 ties and developed theories and terminol- From the mid 1950s to the early 1970s, ogy to describe social connections and social fields such as sociology, anthropology, and structure (51). Renowned sociologists such as mathematics contributed conceptual, theo- Comte and Simmel are often credited with retical, and methodological advances that many of the early ideas providing a foundation helped to solidify the foundation of modern for social network analysis. Important contri- social network analysis (11, 61, 144). One butions were also made during this time by of the landmark articles in Sociometry dur- lesser-known social scientists such as ethnol- ing this time was a study examining interper- ogist Eilert Sundt, who studied the forma- sonal communication among physicians and tion of social circles among rurual Norwegian the diffusion of new drugs by Coleman, Katz, farmers (33). and Menzel (39). Coleman, Katz, and Menzel In 1929 a new idea about ties between peo- found that the number and types of social con- ple was proposed in a short story by Hun- nections physicians had influenced their adop- Annu. Rev. Public. Health. 2007.28:69-93. Downloaded from arjournals.annualreviews.org garian writer Frigyes Karinthy. In the story, a tion of a new drug with close professional ties character asserted that he could link anyone in facilitating the earliest adoptions. the world to himself through at most five ac- In 1959, mathematicians Paul Erdos and ˝ quaintances, proposing what may be the first Alfr´ d R´ nyi proposed one of the first for- e e by Dr. Douglas Luke on 05/26/07. For personal use only. mention of the concept of six degrees of sepa- ˝ mal network models. The Erdos-R´ nyi model e ration (109). In Karinthy’s time this assertion portrayed networks as completely random became a popular game, and it remains a part (9). Surprisingly they found with this model of popular culture today. Recent appearances that the larger the size of the network, the of the concept are found on numerous Web fewer connections between network nodes sites and in John Guare’s play, Six Degrees of were needed to have the network be com- Separation. The concept of six degrees of sep- pletely linked. In fact, according to this model, aration was one of the first demonstrations connecting all six billion people in the world that a network approach could be used to dis- would require each person to have only about cover important characteristics of the natural 24 random acquaintances (30). This random world. graph model was an early successful attempt In the 1920s educational psychologists to provide an explanation for how actual net- published a number of studies reporting on works operate and paved the way for modern characteristics of social ties such as influ- mathematical network theory (109). ence, interaction, and companionship (50). In the early 1970s sociologist Mark Although many important network ideas Granovetter proposed a network model that came from this early work, the studies are accounted for some basic truths about human often overshadowed by the major contribu- ˝ social ties (58). Although the Erdos-R´ nyi e tion made in 1934 by psychiatrist Jacob L. network explained why large networks can be Moreno (100). Moreno developed a new way connected with a small number of ties (i.e., of representing relationships on paper, called the “small world” phenomenon), most indi- a “sociogram.” A sociogram was a drawing viduals are not likely to be randomly con- with points representing people connected by nected to 24 others around the world. It is lines representing interpersonal relationships. more reasonable to assume that people know Moreno’s work established network analysis as their neighbors, coworkers, and families. Gra- a unique discipline, and his sociograms were novetter posited that, in addition to strong ties the first specific network analytic tool (141). to families, neighbors, and coworkers, each In 1937 Moreno founded the journal Sociome- person has weak ties to people such as casual try, which published many of the early studies acquaintances and that these weak ties held taking network approaches or developing net- the network together. The acquaintances and work methods. friends of friends reached outside what might www.annualreviews.org • Network Analysis in Public Health 71
- 4. ANRV305-PU28-05 ARI 6 March 2007 17:8 otherwise be closed and segmented networks journals focusing on network analysis ap- of strong ties, allowing a larger network to peared (e.g., Social Networks), and interna- form (58). tional conferences were established (i.e., the Granovetter’s work is important for sev- annual Sunbelt Conference). One critical as- eral reasons. First, it helped develop a so- pect of the success of social network analy- phisticated and realistic model of network sis was the development and availability of structure (58). More importantly for its subse- software packages, including UCINET (25) quent utility for public health, Granovetter’s and Pajek (13). As network analysis grew and work was among the first applications of net- was applied in various mathematical, biologi- work theory, which attempted to explain social cal, behavioral, and organizational contexts, it structure and human behavior. Granovetter’s became clear that it was not simply a new an- theory of weak ties arose out of a simple ques- alytic tool, but a distinctive theoretical disci- tion: “How do people find jobs?” The surpris- pline. In fact, network analysis can be seen as a Annu. Rev. Public. Health. 2007.28:69-93. Downloaded from arjournals.annualreviews.org ing answer that people find jobs through ac- type of “normal” science, using Kuhn’s termi- quaintances rather than through close friends nology (65, 85). Network analysis, thus, pro- led to a deeper understanding of how knowl- vides public health with a new way of framing edge and information can be efficiently passed and answering important health questions. To by Dr. Douglas Luke on 05/26/07. For personal use only. through large social networks. introduce some of the major differences be- In recent years mathematicians and physi- tween network approaches and traditional re- cists have started examining the fundamental search methodology, the next section contains properties of theoretical and real-world net- an overview of network methods. works. Drawing on the work of social sci- entists in measuring network centralization (49, 126) physicists developed models such A BRIEF OVERVIEW OF as the small-world model and the scale-free NETWORK ANALYSIS model, which have been useful in describ- METHODS ing very large networks (9, 143). In particu- The inherently relational quality of network lar, scale-free networks have hubs, or a few methods requires a shift in thinking when it nodes that have an unusually high number comes to research methodology. Network ap- of links, whereas other nodes have a small proaches focus on relationships between sub- and relatively consistent number of links. This jects rather than relationships between sub- structure has since been identified in diverse ject attributes (i.e., variables). Study design, networks such as sexual partners in the early data collection, and data analysis incorporate stages of the AIDS epidemic, the national and this relational perspective, requiring unique international network of airports and flights, approaches to each. and networks of large businesses (9). Social network analysis rapidly developed as a distinct discipline in the decades follow- Study Design and Data Collection ing the 1970s (51). Important contributions Traditional study designs in public health typ- were made from an extremely wide variety ically utilize attribute data at the individual of fields, including sociology, psychology, po- level. For these types of designs, data can be litical science, anthropology, communication, collected from individuals before the entire business, mathematics (especially graph the- sample has been identified, recruited, or in- ory), statistics, computer science, and physics. terviewed. Data collection in network stud- In 1977 the professional association for so- ies works quite differently. For many network cial network analysis was founded: the Inter- studies, the entire network must be identi- national Network for Social Network Analy- fied before data collection starts. For example, sis (INSNA). Shortly thereafter professional in a study of student friendships, students in 72 Luke · Harris
- 5. ANRV305-PU28-05 ARI 6 March 2007 17:8 Table 1 Comparison of attribute data format (top) and network data format (bottom) Attribute data ID Age Gender Educ. # Partners Diagnosed 1 25 M Low 7 Y 2 32 F Low 3 N 3 33 F High 4 N 4 34 M Med. 4 Y 5 40 F Med. 2 N 6 37 M High 5 N Network (friendship) data ID Bob Karen Nancy Peter Roberta Scott Bob 0 0 0 1 0 1 Annu. Rev. Public. Health. 2007.28:69-93. Downloaded from arjournals.annualreviews.org Karen 0 0 1 1 1 0 Nancy 0 1 0 1 1 1 Peter 1 1 1 0 0 1 Roberta 0 1 1 0 0 1 Scott 1 0 1 1 1 0 by Dr. Douglas Luke on 05/26/07. For personal use only. particular classrooms would be identified be- driven sampling (43, 120). This type of sam- fore starting to collect network data. Then, pling falls into the larger category of link- every student in a classroom would be asked tracing designs (128). Here, the researcher about every other student to ascertain the re- starts with a small number of network mem- lationships. Table 1 shows how the resulting bers and asks them who else should be in- data could be organized, comparing data from cluded in the network. These new network a traditional individual-level study design to members are then approached and are in turn relational data obtained in a network study. In asked to nominate network members. Typi- individual attribute studies, the data are orga- cally, after a small number of waves network nized in an N-by-k rectangular matrix, with members start nominating people who have N subjects measured on k attributes. In net- already been nominated. For more informa- work analyses, data are typically organized in tion about network study design see the 2004 an N-by-N square matrix. Thus, the data en- text by Morris (101) and the 1992 article by tries represent a relationship between a pair Doreian & Woodard (43). of actors (in this case, a friendship relation). This type of network data collection is sometimes referred to as complete or bounded Data Analysis because it is based on prior identification of Although many ways exist to analyze net- all network members. In many cases, net- work data, three broad approaches to analysis work identification is straightforward, espe- are generally used. First, network visualiza- cially when boundaries are clear. For exam- tion allows researchers and audiences to view ple, a network analysis of a substance abuse various graphical depictions of networks. Sec- referral network would identify all social ser- ond, descriptive analyses of network proper- vice agencies in a particular county that pro- ties can reveal important details concerning vide or receive referrals for substance abuse the (a) position of network actors, (b) prop- services. However, in many cases, network erties of network subgroups (called a sub- identification may not have clearly defined graph), or (c) characteristics of a complete net- boundaries. One useful network sampling ap- work (Table 2 provides definitions and terms proach is snowball sampling or respondent- used at each level). Third, recent work in www.annualreviews.org • Network Analysis in Public Health 73
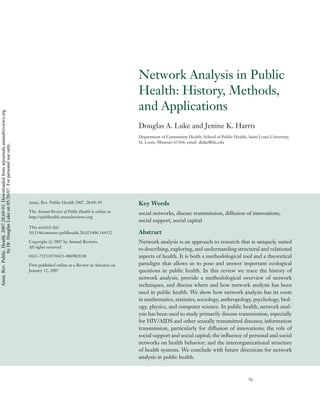
- 6. ANRV305-PU28-05 ARI 6 March 2007 17:8 Table 2 Network levels of analysis with descriptions and network measures Level Definition and purpose Standard network measures Individual A single actor or node Degree Connectivity of a given actor or node given by the number of lines that are incident (connected) to the node Identification of the Centrality Importance or prominence of a given actor or node position or location and Following are several types of centrality: characteristics of an actor Betweenness: extent to which an actor lies between two within a network nodes that would not otherwise be connected Closeness: how close an actor is to all other actors on the basis of distance between nodes Degree: extent to which an actor is connected to others; the simplest of the centrality measures Prestige: specifically for directed networks; extent to Annu. Rev. Public. Health. 2007.28:69-93. Downloaded from arjournals.annualreviews.org which other members choose a given actor or node Structural Extent to which actors play similar roles within a network equivalence by having the same patterns of connections to other actors by Dr. Douglas Luke on 05/26/07. For personal use only. Subgraph A subset of the graph Dyad A pair of actors and the possible tie between them based on certain nodes or Triad Three actors and the ties between them links Examination of k-core All nodes in a network with degree ≥k characteristics of a group Clique Three or more actors connected by all possible connections Network The entire system of Density Ratio of observed ties to possible ties nodes and links Diameter Longest of all geodesics (shortest path between two nodes) Description or inference Centralization Extent to which the graph shows a hierarchical or based on the structure of centralized structure the entire network stochastic and longitudinal network methods two ways of displaying the same tobacco con- allows investigators to build and test inferen- trol network. On top is a ring network, where tial and longitudinal network models. all the nodes are arranged in an oval. This configuration is limited in that it becomes Network visualization. Network visualiza- hard to determine which nodes are more (or tion consists of presenting network informa- less) connected to others. In comparison, the tion in graphic format and is a major part of bottom figure uses an energy or spring em- social network analysis. Figure 3, for exam- bedding algorithm to position more central ple, depicts the friendship network based on nodes (those with more connections) toward data from Table 2. Graphic representation al- the center of the network (54), making it eas- lows researchers to ask and answer questions ier to see the structure. Modern visualization about the network that might not be statis- techniques have been developed to display tically obvious. Modern network software in- large and complicated networks in two- and corporates layout and presentation algorithms three-dimensional space (68). that facilitate efficient and accurate interpre- tation of network graphs. This is important Network description. As Table 2 suggests, because networks can be displayed in a va- network description can focus on the role of riety of ways. For example, Figure 4 shows individual actors in the network, identification 74 Luke · Harris
- 7. ANRV305-PU28-05 ARI 6 March 2007 17:8 Peter Bob Figure 3 Karen This network graphic depicts the friendship ties between six Nancy individuals. This was developed by the Scott authors for the purpose of demonstrating how Annu. Rev. Public. Health. 2007.28:69-93. Downloaded from arjournals.annualreviews.org network data is visualized. The data underlying the network can be Roberta found in Table 2. by Dr. Douglas Luke on 05/26/07. For personal use only. and interpretation of subgroups (called a sub- Subgraph analysis consists of identifying graph), and analysis of overall network struc- and analyzing a subset of links and nodes from ture. For a more formal and complete treat- a network. This approach is used to under- ment of network methods, see the Wasserman stand cohesion in groups and to identify char- & Faust text (141). Analysis at the individ- acteristics of dyads, triads, and other subsets ual level typically consists of identifying the (Table 2). For example, in an article about position or location of an actor within a net- risk potential for HIV infection (53) Fried- work. Traditionally, researchers have paid at- man et al. used subgraph analysis to find all the tention particularly to actors who play central components comprised of individuals in the roles, for example, those who are chosen more network that had two or more drug-injecting frequently by other network members (high or sexual links. They determined that this sub- prestige) or who act as brokers in communica- set of individuals was an appropriate target tion or transmission networks (high between- for HIV prevention efforts because they were ness). For example, in a study of adolescent more likely to be HIV positive or engage in smoking, Ennett & Bauman (45) identified high-risk behaviors. three positions in social networks associated Finally, network description can focus with transmission of health behaviors: isolate, on the overall structure of the network. bridge, and clique member. These positions Network-level statistics provide insight into were defined by the number and types of links how connected a network is or how flat individuals had to others in the network, and or hierarchical the relationship structure is. each position was associated with a different Analyses of public health systems often re- probability of adopting a particular health be- port network-level results because they are havior. Ennett & Bauman found that isolates, typically examining collaboration in a group or adolescents with few or no links to others, of agencies (84, 115). For example, in an ar- were more likely to be smokers than were ado- ticle about a health policy network address- lescents in bridge or clique positions. A later ing diabetes along the U.S.-Mexican border study determined that, among middle school (115), Provan et al. compared the density of students, popular students with many links to a network of agencies for four different rela- others were more likely to become smokers tions: sharing information, sharing resources, (139). working together on projects, and sharing www.annualreviews.org • Network Analysis in Public Health 75
- 8. ANRV305-PU28-05 ARI 6 March 2007 17:8 referrals. They found that the information- Transmission Networks sharing network had the highest density, sug- Analysis of transmission networks represents gesting that information was passed between STD: sexually a common use of network analysis in public transmitted disease agencies more frequently than were resources health. Transmission networks are social sys- or referrals. tems that structure the flow of some tangi- ble element. Here the emphasis is on what Stochastic and longitudinal networks. flows between actors in a network. There One limitation of the preceding methods are two major types of transmission networks is that they are fundamentally descriptive. studied in public health: disease transmis- Network data is, by definition, nonindepen- sion networks and information transmission dent, and thus traditional parametric mod- networks. els, that require independence of observa- Annu. Rev. Public. Health. 2007.28:69-93. Downloaded from arjournals.annualreviews.org tions cannot be applied. In the past decade, Disease transmission networks. Friedman however, researchers have developed stochas- & Aral (52) defined disease transmission net- tic network modeling methods, which can works as risk potential networks, which are be used to test network hypotheses (142). networks of individuals connected by ties that Also, new methods have been developed by Dr. Douglas Luke on 05/26/07. For personal use only. can spread infection. As Eames & Keeling that allow analysis of longitudinal network pointed out (44), “A wide range of com- data (127). To date, only a handful of pub- municable human diseases can be consid- lic health studies have utilized stochastic ered as spreading through a network of pos- (102, 103) or longitudinal (111, 133, 134) sible transmission routes. The implied net- methods. work structure is vital in determining disease dynamics. . .” (p. 13,330). These ties include behaviors such as nee- THE USE OF NETWORK dle sharing or risky sexual activity, as well as ANALYSIS IN PUBLIC HEALTH seemingly less risky connections such as liv- Public health has long recognized the im- ing in the same household or belonging to portance of relational characteristics in un- the same friendship group. In terms of risk derstanding disease and health. The role of potential, network analysis has been used pri- close physical contact in communicable dis- marily to look at the spread of HIV/AIDS, ease outbreaks and the influence of peers on other sexually transmitted diseases (STDs), adolescent smoking and substance use are two and other infectious diseases. Much of this notable examples. However, although public research has highlighted differences between health has often adopted an ecological frame- network approaches and traditional epidemi- work that recognized the importance of re- ological models of STDs and HIV. lational information, only relatively recently Traditional disease outbreak models ex- have scholars utilized a more explicit network amining person-to-person spread of infection analytic approach. Our review suggests that typically consist of the frequency of cases over the use of network analysis in public health time (78), whereas network models of trans- falls into three broad categories: transmission mission show relationships among individu- networks, social networks, and organizational als. The difference can be seen in Figure 6 networks (see Figure 5). This organization with an epidemic curve showing the spread of is not based on particular network analytic syphilis on the left (34) and a network graph methods or theory per se; rather, it reflects modeling the spread of syphilis (in a differ- how public health researchers have utilized ent population) on the right (119). The epi- network analytic tools to address public health demiologic model is most useful for identi- problems. fying the course of an outbreak or epidemic, 76 Luke · Harris
- 9. ANRV305-PU28-05 ARI 6 March 2007 17:8 whereas the network model reveals the un- of AIDS risk behaviors and HIV infection derlying transmission structure of the out- rates (41, 53). These studies, based on a pop- break. The network model is useful particu- ulation of 767 injecting drug users (IDU) in IDU: injection (or larly for planning interventions for the disease New York, reported that a higher percentage intravenous) drug in question (147). These figures are included of core and inner periphery members were user to allow the reader to compare traditional HIV positive. Core members were those con- epidemiologic methods with network analytic sidered “regular” members by others in the methods. network, whereas inner-periphery members Network-like diagrams depicting disease were those who had shared drugs with a core transmission appeared in print as early as 1940 member in the past 30 days but were not in (31). More recently, similar diagrams depict- the core. In addition to having a higher rate ing the early spread of HIV/AIDS were pre- of HIV, these core and inner-periphery net- sented as a tool for understanding and ad- work members were involved in risk behav- Annu. Rev. Public. Health. 2007.28:69-93. Downloaded from arjournals.annualreviews.org dressing this emerging health problem. In iors such as sharing syringes more often than 1984, just as the American public became were network members in the outer periph- aware of the AIDS epidemic, Auerbach and ery. Another study of IDUs found that in- colleagues published an article entitled “Clus- dividuals were more likely to share needles by Dr. Douglas Luke on 05/26/07. For personal use only. ter of Cases of the Acquired Immune De- with strongly connected friends than with new ficiency Syndrome” in the American Journal friends or friends who were weakly connected of Medicine (7). The article presented a dia- (140). This factor reduced their short-term gram of 40 AIDS patients in 10 cities linked risk of HIV but not the long-term risk owing by sexual contact. This depiction was among to the high level of turnover in friendships the first evidence that AIDS was an infectious in this population. By examining the social disease and was transmitted through sexual networks of another population of IDUs, re- contact. In 1985 Klovdahl took a network ap- searchers also found that the larger and denser proach to analyzing the data from the Auer- a person’s drug network was, the more likely bach et al. study (80). His conceptualization he/she was to share needles (87). In general, of disease transmission as a social network the more close or strong ties an IDU has, the allowed researchers the opportunity to con- more likely he/she is to share needles and to sider disease in a new way, which marked be at risk for HIV (140). a transition to wider use of network con- In addition to individual network position cepts and methods for studying infectious dis- and composition, structural network prop- eases. Since that time, numerous other stud- erties have been associated with the epi- ies have considered risk potential networks demic stage or level of transmission of HIV and HIV/AIDS transmission. These studies within a population. The amount of assor- have focused primarily on sexual and needle- tative and disassortative mixing within the sharing networks and identified risk factors as- network and the presence of cyclic or den- sociated with network characteristics (41, 53, dritic structures are indicators of how HIV is 87, 104). In addition, characteristics of net- spreading through the population (113, 114). work structure have been associated with the Assortative mixing occurs when people who various stages of HIV epidemics (114). have something in common are connected to Through analysis of HIV/AIDS risk po- each other. That is, a network where “birds of tential networks, researchers have identified a feather flock together” would be considered a number of network-related risk factors for assortative, whereas a network where “oppo- HIV transmission, including network posi- sites attract” would be considered disassorta- tion and composition. In studies of street- tive (102). level drug markets, researchers found that By simulating the spread of HIV through network position was associated with levels networks of sexual relationships, Morris & www.annualreviews.org • Network Analysis in Public Health 77
- 10. ANRV305-PU28-05 ARI 6 March 2007 17:8 Cycles Annu. Rev. Public. Health. 2007.28:69-93. Downloaded from arjournals.annualreviews.org Figure 7 A graph of the four largest chlamydia components in Colorado Springs. by Dr. Douglas Luke on 05/26/07. For personal use only. Adapted from (113). Kretzschmar (102) found that, compared with area has focused on gaps in traditional epi- random mixing, both assortative and disassor- demiologic methods of contact tracing for tative mixing regarding the number of sexual STD prevention and control (6, 67, 82, 119). partners increased the odds of a large epi- The utility of network analysis for under- demic once there had been an outbreak. Fur- standing STDs was strikingly demonstrated ther evidence to support this comes from two to researchers and the public in 1998 when studies that found that it was not just having Rothenberg and colleagues (119) published more partners that was a risk factor for becom- an article on a syphilis outbreak in young ing HIV positive; in fact, it was disassortative teenage girls in an affluent Atlanta suburb. A sexual partnerships between younger men and network of 99 teenagers connected by sexual older men that increased HIV risk (104, 122). contact was identified when six girls, most un- Mixing patterns are not the only factor in- der the age of 16, were diagnosed with syphilis fluencing HIV transmission networks. In a (Figure 6b). Although the high level of sexual study of network structure and STD, Potterat activity among this group of young teenagers and colleagues (113) identified cyclic struc- appeared unique, a 2004 study (15) of the tures, or closed loops, within a network as be- population of students in a Midwestern high ing loci of epidemics that are often present school found a sexual and romantic relations early in an epidemic. Conversely, dendritic, network (Figure 8) that included 288 of the or tree-like, structures appeared indicative of 832 students interviewed. Like the teenagers the later phases of an epidemic where the rate in Atlanta, these students were involved in of new cases is decreasing (see Figure 7). In a single large connected component, putting a later study in the same community, Potterat them at much greater risk for contracting an and colleagues found a mixture of these two STD. structures in an HIV network. They suggested Similar to findings in HIV/AIDS research, that the hybrid network structure was associ- the structure of an STD transmission network ated with the low-to-moderate spread of HIV may be different depending on the stage of observed in the community (114). STD epidemic and the likelihood of assorta- STDs have been another focus of pub- tive or disassortative mixing in various pop- lic health network research. Research in this ulations (89, 113). Laumann and colleagues 78 Luke · Harris