

Empfohlen
Empfohlen
Weitere ähnliche Inhalte
Was ist angesagt?
Was ist angesagt? (20)
Andere mochten auch
Andere mochten auch (20)
Ähnlich wie 俄羅斯零售電商
Ähnlich wie 俄羅斯零售電商 (20)
Mehr von Ying wei (Joe) Chou
Mehr von Ying wei (Joe) Chou (20)
Kürzlich hochgeladen
Kürzlich hochgeladen (20)
俄羅斯零售電商
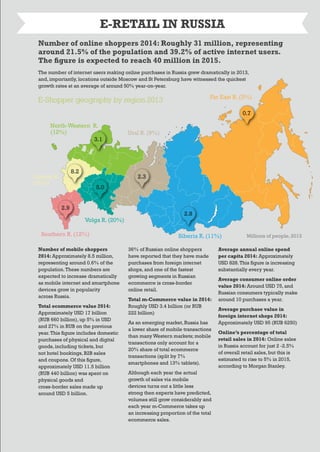
- 1. 22 By far the most popular domain names in Russia are .ru and .com, and where available these will almost certainly be the best choice for your e-Shop in this location. All other zone names will sound exotic and strange to Russian consumers, though .net and .org are certainly acceptable alternatives for IT or non-commercial organizations. The .рф domain is growing in popularity in Russia but its usefulness is limited as it is very inconvenient when it comes to organic search results.The SEO rule-of-thumb is that if you plan to promote your website, don’t use .рф - go for .ru. Administrative control and technical support of the .ru/.рф domain has been assigned to the Coordination Centre for TLD RU/ рф.The Coordination Centre for TLD RU/ рф, does not, however, perform a registrar’s functions. Registration of second-level domain names in .RU/. рф is available only through accredited registrars, a list of which is displayed at http://www.cctld.ru/en/registrators/. All geographical regions of Russia have their own second-level domains, as do many specific sectors, and there are a number of pre-set second-level domains designated for third-level domain registration (some of the most popular of which are included in the previous table).There are currently 133 active second-level domains available for registration in Russia. Domain names are registered for a period of one year.To keep an allocated domain name for an additional year, the registrant must go through a re-registration procedure. Popular search engines: Yandex is the leading search engine in Russia, with Google in second place trailing quite significantly behind in terms of market share.Yandex has long maintained its dominance in this area of the market, and is forecasted to continue to do so into the future. When it comes to broaching the Russian ecommerce market, it is clear that an e-Retailer should not ignoreYandex as a means of establishing a presence amongst Russian consumers.Yandex is a tool that is reputed to be unparalleled when it comes to digital marketing strategies. Other popular search engines in the Russian Federation include Search.Mail.ru (depicted as ‘Mail’, right), Rambler and Bing.The latter two search engines do not play a significant role in Russian search behaviour. Social media: As with search engines, Russian consumers tend to prefer home- grown social media platforms to otherwise popular global alternatives, with domestic social networking site VKontakte the most popular with a 28% penetration rate. Odnoklassniki.ru follows closely behind, and is particularly popular with Russian students that want to connect and share data. In the fourth quarter of 2014, it was reported that 46% of the Russian population had an active account with any social network and 34.5 million Russians were visiting at least one social network every day.These statistics go a long way in explaining why social media platforms are being considered an increasingly important marketing and advertising tool within the Russian Federation. Share of population VK Odnoklassniki 4% 5%0 10% 15% 20% 25% 30% 35% 5% 5% 7% 10% 12% 15% 18% 24% 28% Facebook Google+ Skype Twitter Instagram Viber WhatsApp LinkedIn 29.7% 7.3% 2.5% Yandex Other Google Mail 60.5% 23 Number of mobile shoppers 2014: Approximately 8.5 million, representing around 0.6% of the population.These numbers are expected to increase dramatically as mobile internet and smartphone devices grow in popularity across Russia. Total ecommerce value 2014: Approximately USD 17 billion (RUB 660 billion), up 5% in USD and 27% in RUB on the previous year.This figure includes domestic purchases of physical and digital goods, including tickets, but not hotel bookings, B2B sales and coupons. Of this figure, approximately USD 11.5 billion (RUB 440 billion) was spent on physical goods and cross-border sales made up around USD 5 billion. 36% of Russian online shoppers have reported that they have made purchases from foreign internet shops, and one of the fastest growing segments in Russian ecommerce is cross-border online retail. Total m-Commerce value in 2014: Roughly USD 3.4 billion (or RUB 222 billion) As an emerging market, Russia has a lower share of mobile transactions than many Western markets; mobile transactions only account for a 20% share of total ecommerce transactions (split by 7% smartphones and 13% tablets). Although each year the actual growth of sales via mobile devices turns out a little less strong then experts have predicted, volumes still grow considerably and each year m-Commerce takes up an increasing proportion of the total ecommerce sales. Average annual online spend per capita 2014: Approximately USD 828.This figure is increasing substantially every year. Average consumer online order value 2014: Around USD 75, and Russian consumers typically make around 10 purchases a year. Average purchase value in foreign internet shops 2014: Approximately USD 95 (RUB 6250) Online’s percentage of total retail sales in 2014: Online sales in Russia account for just 2 -2.5% of overall retail sales, but this is estimated to rise to 5% in 2015, according to Morgan Stanley. Number of online shoppers 2014: Roughly 31 million, representing around 21.5% of the population and 39.2% of active internet users. The figure is expected to reach 40 million in 2015. The number of internet users making online purchases in Russia grew dramatically in 2013, and, importantly, locations outside Moscow and St Petersburg have witnessed the quickest growth rates at an average of around 50% year-on-year. E-Shopper geography by region 2013 E-RETAIL IN RUSSIA 2.3 2.8 Siberia R. (11%)Southern R. (12%) Central R. (33%) Volga R. (20%) Ural R. (9%) Far East R. (3%) North-Western R. (12%) 0.7 3.1 8.2 2.9 5.0 Millions of people, 2013
- 2. 24 Peak online shopping days within the Russian Federation include the NewYear on December 31st, the days leading up to Christmas on January the 7th, and International Women’s Day on March 8th. DEC 31st NewYear JAN 7th Christmas Shopping MARCH 8th International Woman’s Day PEAK ONLINE SHOPPING TIMES 25 Pagetrafficbydevicethroughoutatypicalworkday Mobiles brighten the commute PCs Dominate working hours Tablets popular at night Late Night (12am - 7am) Early Morning (7am - 10am) Daytime (10am - 5pm) Early Evening (10am - 5pm) Prime (8pm - 12am) 9:00 PM 10:00 PM 11:00 PM HOW THEY BUY: PC V MOBILE As previously indicated, although mobile internet activity has recently grown dramatically in the Russian Federation, there is still a long way to go before Russia’s m-Commerce sphere will compete with other, more developed digital markets, or indeed sales concluded via desktops, laptops and notebooks within Russian borders. Overall, mobile device traffic only constitutes around 7% of all traffic to Russian websites, and so far only 21% of surveyed smartphone users living in Russian cities with a population of 100,000+ have made purchases via their phones, although the proportion increases in Russia’s largest cities, Moscow and St Petersburg, to 23.6% and 23.9% of smartphone users respectively. Interestingly, at present Russian consumers spend a comparatively small proportion of their mobile browsing time shopping online.TNS in their 2013 research discovered that most people in Russia use their smartphones for social networking, messaging and search, whereas only around 10-15% of surveyed respondents used their smartphones for buying or ordering products online, as indicated in the chart below. It is important to note, however, that almost 40% of Russian respondents surveyed by TNS stated that they researched information about products using a smartphone before buying the products offline or via another device, and so –even without the promise of dramatic future m-Commerce growth – this is a channel that shouldn’t be ignored by a prospective e-Retailer into Russia. A report entitled ‘The Russian m-Commerce Market in 2014’, presented by the marketing agency, has additionally indicated that those Russian consumers who have purchased tablet devices are much more likely to complete the online order process using those devices than those shopping on smartphones.The report stated that around 48% of tablet users made purchases of goods and services via these devices in 2014. Sales of tablet devices are increasing dramatically in Russia, so m-Commerce sales in the territory will certainly increase as a result. Of course, as is the trend across the globe, a main driver of m-Commerce in Russia will be an increase in smartphone and tablet penetration amongst Russian citizens, and we can only expect order numbers to increase as a result. Proportion of RespondentsSocial networking Search 0 30%20%10% 40% 50% 60% 70% 80% Instant messaging Info about products & services Buying products Ordering products The most prolific times of day when it comes online shopping in Russia are depicted below: The device preference of Russian consumers also fluctuates throughout the working day, as demonstrated by the chart below.
- 3. 26 RETAIL CATEGORIES & GROWTH RATES 27 Russian consumers display a clear preference for certain categories of goods when shopping online, and three in particular take up a significant proportion of this online marketplace: consumer electronics and white goods (42%), clothing and footwear (13%), and car parts (10%). Digital sales of clothing and footwear have seen dramatic growth over the past few years, partially due to the fact that consumers are getting used to using the free returns option offered by many e-Retailers in this location. Electronics (42%) Other (18%) Clothing & Footwear (13%) Car Parts (10%) DIY & Furniture (6%) Toys (4%) Beauty & Perfumes (3%) Books, DVDs & CDs (2%) Food & Drink (2%) percentageofonlinesalesincategories 10 20 30 40 50 0 The table below then shows the growth rate of different sectors of the Russian ecommerce marketplace between 2012 and 2013.When comparing the growth rate of specific segments to proportionate ecommerce sector market shares, the category of ‘computer, notebooks and computer parts’ below is subsumed into ‘electronics and white goods’, above. Segments Growth 2012-13 Household appliances & electronics 34% Clothing & footwear 34% Computer, notebooks & computer parts 23% Car parts 43% Mobile phones 32% Children’s goods 29% Home items 97% Furniture 36% B2B equipment 55% Construction materials 40% Sports, tourism & leisure 42% Groceries -1% Office appliances 30% Cosmetics & perfumes 31% Accessories 37% Books 3% Gifts 50% Medicine 63% Pet goods 95% Flowers 31% ECOMMERCE GROWTH It has been well-publicised that the Russian Federation has recently been affected by both international and domestic turmoil; upheaval which has led to the current quasi-stagnation of the Russian economy. Despite these difficulties, however, the Russian ecommerce market continues to show resilience and grow at significant double- digit rates, though this growth rate will slow in coming years. Long-term expectations for this digital market remain high, with the full potential of Russian ecommerce far from realised. Russian ecommerce market growth forecast Within the Russian Federation, impressive ecommerce growth figures are and will continue to be driven by a variety of factors. Aside from continually increasing broadband and internet-connected mobile device penetration throughout the regions, growth is fuelled by the wider use of online payments and the further development of fulfilment infrastructure in the remote areas of Russia, amongst other things. Indeed, online sales more than doubled in December 2014 when compared year-on-year with December 2013, with some Russian e-Retailers such as Wikimart experiencing even more impressive December year-on-year growth figures. Wikimart reported a fourfold increase in one-day online sales revenues for goods purchased on December 17 2014 when compared with the same day the previous year. Impressively, the Russian ecommerce market has been predicted to reach or exceed the USD 100 billion mark within 10 to 15 years. 2010 2011 2012 2013 2014 2015 2016 2017 2018 2019 2020 2021 2022 2023 2024 2025 100 90 80 70 60 50 40 30 20 10 0 2010 $8bn 2013 $16.5bn EFFECT OF THE RUBLE’S FALL for calculations in $ terms 2020 $40bn to $50bn Long Term $100bn & more
- 4. 28 29 Russia’s leading online retailers The following table was compiled using information extracted from Data Insight, Enter Vision and East-West Digital News’ research into Russia’s 2013 sales data. It solely takes a companies’ online revenue into account. Site Segment Net Sales (online sales incl. VAT in million USD) Average monthly traffic (million unique users per month) 1 ulmart.ru Home appliances & Electronics 684 7000 2 svyaznoy.ru Home appliances & Electronics 507 8000 3 wildberries.ru Apparel & Footwear 487 13000 4 citilink.ru Home appliances & Electronics 383 2900 5 exist.ru Autoparts 364 2700 6 ozon.ru Diversified assortment 289 8100 7 quelle.ru Apparel & Footwear 229 1900 8 lamoda.ru Apparel & Footwear 191 5800 9 mvideo.ru Home appliances & Electronics 186 8800 10 bonprix.ru Apparel & Footwear 185 2900 Major Russian Trade Partners 2013 country x-border retail volume exports imports % change from 2012 88842,0 35630,5 53211,5 + 1,7% 75972,0 70126,1 5845,9 - 8,3% 74944,1 37027,8 37916,3 + 2,2% 53868,3 39314,5 14553,8 + 17,8% 33211,9 19648,5 13563,3 + 6,6% 32755,8 25499,7 7256,0 - 4,6% 27916,5 19582,2 8334,3 + 2,0% 27732,9 11196,1 16536,8 - 2,6% 22214,8 9292,9 13011,9 - 8,7% 25182,9 14868,3 10314,6 + 1,5% *This data includes all cross-border retail trade– not just purchases made online. MARKETING & BRANDING When entering the Russian ecommerce market, the considerations associated with building and marketing a brand are very similar to those deliberated when broaching other foreign markets, although the practical steps required, as well as the approaches resonating with Russian consumers, are likely to differ to those successful in other territories. Russia has both a unique language and culture, and both of these factors are key considerations for any online retailer attempting to break into this digital market. Broaching the market – the basics The simplest – though perhaps not most effective - overall method of broaching the Russian ecommerce market is to make use of an online shop’s existing infrastructure; an e-Trader simply needs to make his products purchasable by Russian consumers and put in place logistical mechanisms to facilitate delivery. Marketing strategies are no exception to this approach – no active marketing need be undertaken in the Russian Federation. This route may help an e-Trader gauge whether there is any natural demand in Russia for their particular product(s), but it is unlikely to be very effective unless this retailer has a truly unique, niche offering and/or some brand recognition already established in the Russian market, perhaps through a local distributor. For e-Retailers whose products don’t fit this description, it is better to view this approach as a discretionary ‘stage 1’ of entering the market. Reliable delivery and clearly understandable returns procedures, however, are still vital. The next, more successful, method of penetrating this market necessitates localisation. If your product is not one-of-a-kind, lacks brand presence and it is unlikely that Russian consumers will navigate a website in English to make a transaction (which is often the case), then localisation is an important factor when it comes to attracting potential customers to your website. When localising a webpage for the Russian marketplace, it is of the upmost importance to provide content that is relevant to Russian customers, host this content in the Russian language and present it on platforms familiar to Russian e-Shoppers. The key online marketing platforms in Russia differ from the rest of the world, and it is vital to conduct appropriate market research in advance of expanding your international presence; specialist knowledge about Russia-specific platforms is a must.Taking these steps will dramatically increase an e-Retailer’s visibility to, and therefore success with, Russian customers. Russian search engines also favour local domain names, so to maximize exposure e-Retailers looking to target Russian online shoppers should consider setting up a website with a .ru domain name; the associated visibility will far outweigh that which is received with home market domains.