Eage ior-conference-2013 final
•
1 gefällt mir•1,025 views

The document discusses two offshore oilfield projects in Southeast Asia that are pioneering the use of customized water treatment to improve oil recovery. Both projects require treated seawater to be injected into reservoirs for chemical EOR processes. A pilot study tested a proprietary reverse osmosis and nanofiltration system to treat seawater and produce different water qualities required by the two projects. The pilot demonstrated the system could reliably achieve various water quality targets and respond quickly to changes. This indicates the system may be suitable to meet the unique water treatment needs of chemical EOR applications in offshore environments.

Empfohlen
Empfohlen
Weitere ähnliche Inhalte
Was ist angesagt?
Was ist angesagt? (20)
Andere mochten auch
Andere mochten auch (20)
Ähnlich wie Eage ior-conference-2013 final
Ähnlich wie Eage ior-conference-2013 final (20)
Kürzlich hochgeladen
Kürzlich hochgeladen (20)
Eage ior-conference-2013 final
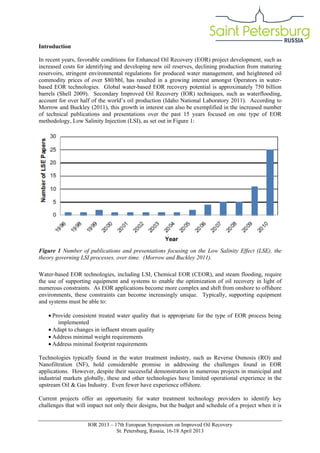
- 1. Introduction In recent years, favorable conditions for Enhanced Oil Recovery (EOR) project development, such as increased costs for identifying and developing new oil reserves, declining production from maturing reservoirs, stringent environmental regulations for produced water management, and heightened oil commodity prices of over $80/bbl, has resulted in a growing interest amongst Operators in waterbased EOR technologies. Global water-based EOR recovery potential is approximately 750 billion barrels (Shell 2009). Secondary Improved Oil Recovery (IOR) techniques, such as waterflooding, account for over half of the world’s oil production (Idaho National Laboratory 2011). According to Morrow and Buckley (2011), this growth in interest can also be exemplified in the increased number of technical publications and presentations over the past 15 years focused on one type of EOR methodology, Low Salinity Injection (LSI), as set out in Figure 1: Figure 1 Number of publications and presentations focusing on the Low Salinity Effect (LSE), the theory governing LSI processes, over time. (Morrow and Buckley 2011). Water-based EOR technologies, including LSI, Chemical EOR (CEOR), and steam flooding, require the use of supporting equipment and systems to enable the optimization of oil recovery in light of numerous constraints. As EOR applications become more complex and shift from onshore to offshore environments, these constraints can become increasingly unique. Typically, supporting equipment and systems must be able to: • Provide consistent treated water quality that is appropriate for the type of EOR process being implemented • Adapt to changes in influent stream quality • Address minimal weight requirements • Address minimal footprint requirements Technologies typically found in the water treatment industry, such as Reverse Osmosis (RO) and Nanofiltration (NF), hold considerable promise in addressing the challenges found in EOR applications. However, despite their successful demonstration in numerous projects in municipal and industrial markets globally, these and other technologies have limited operational experience in the upstream Oil & Gas Industry. Even fewer have experience offshore. Current projects offer an opportunity for water treatment technology providers to identify key challenges that will impact not only their designs, but the budget and schedule of a project when it is IOR 2013 – 17th European Symposium on Improved Oil Recovery St. Petersburg, Russia, 16-18 April 2013
- 2. implemented. In order to leverage water treatment technologies in the upstream Oil & Gas Industry, without detrimentally impacting the project, pilot tests can be designed to address key constraints that will be encountered on real-world applications. Bridging Water Treatment Technologies with EOR Applications In Southeast Asia, two projects are pioneering the use of customized water to improve oil recovery in offshore applications. These projects are described in two cases, as follows: Case 1. In the South China Sea, a sandstone reservoir commenced oil production in 2001. Using conventional water injection to maintain pressure within the reservoir to improve oil recovery efficiency, crude oil production reached its peak in 2005 and declined over the next three years. Two CEOR injection techniques utilizing combinations of Surfactant and Polymer (SP) and Alkaline, Surfactant, and Polymer (ASP) chemistries are currently being studied to determine their potential to enhance oil recovery from the field. Sandstone reservoirs are typically considered favorable candidates for CEOR programs relative to carbonate reservoirs due to their wettability and texture. Numerous pilot and commercial scale technologies have been tested in this lithology as a result (Alvardo 2010). In a CEOR program, alkaline, surfactant, and polymer are mixed in water to create an injectant “cocktail,” whose properties will enhance its ability to sweep Original Oil in Place (OOIP) more efficiently than a water-based flooding technique could alone. Each chemical component serves a different intended purpose. Alkaline is used to catalyse saponification reactions with the organic acids of oils within a reservoir’s formation water, generating natural surfactants that mobilize the oil. The deployment of surfactant chemicals will minimize interfacial tension between oil and water, thereby stimulating oil movement. Polymer will increase the viscosity of the injection fluid, improving its ability to displace oil within a reservoir. When used in combination with one another, the beneficial effects of CEOR injection can be amplified. For example, when alkaline is combined with surfactant chemistry, alkaline will help prevent manufactured surfactants from adhering to reservoir rock, increasing the overall efficiency of the CEOR application (Henthorne 2012). In order for a chemical cocktail to work successfully and honour the specifications required in the Case 1 sandstone field, the injection water source, seawater, must be treated using technology from the water treatment industry to achieve a composition that will enhance its effectiveness in the reservoir. Two programs are being considered in this field. One technique utilizes ASP, and the other SP chemistry. Seawater treatment requirements, prior to chemical mixing within these regimes, are set out in Table 1: Total Dissolved Solids (TDS) Calcium Magnesium Sulphate mg/L mg/L mg/L mg/L Case 1: ASP Injection 5,000 < 10 < 10 < 10 Salinity mg/L - Parameter Units Case 2: SP Injection 15,000 – 25,000 < 100 < 100 < 100 22,000 with or without produced water blend Table 1 Case 1 CEOR project treated water requirements. Besides satisfying the treatment requirements set out in Table 1, water treatment technologies must also address unique, site-specific constraints. Water treatment technologies must be able to: • Provide either water quality in Case 1 or Case 2, using a common set of treatment infrastructure IOR 2013 – 17th European Symposium on Improved Oil Recovery St. Petersburg, Russia, 16-18 April 2013
- 3. • Respond to water quality impacts associated with produced water reinjection facilities currently used on site • Produce consistent water quality, with or without the influence of produced water • Demand minimum weight requirements • Demand minimum footprint requirements Case 2. At another location in the South China Sea, a field comprised of layers of shallow sandstone and shale has been in production for over 30 years. While the field originally utilized gas injection to recover crude oil, waterflooding operations began in 2011 to improve production. Recently, CEOR injection using a combination of ASP chemistry has been under investigation to determine its viability in enabling Operators to maximize recovery from the maturing field. Similar to the Case 1 field, the prevalence of high-permeability sandstone in the Case 2 field renders it a potential candidate for a CEOR program. However, in this project, only one injection scenario is currently under consideration. This scenario entails providing ASP chemistry to the reservoir using treated seawater as the injection fluid. Seawater treatment requirements are set out in Table 2: Parameter Total Dissolved Solids (TDS) Calcium Magnesium Sulphate Units mg/L mg/L mg/L mg/L Case: ASP Injection 20,000 – 30,000 <5 <5 <5 Table 2 Case 2 CEOR project treated water requirements. Despite the favorable permeability of sandstone reservoirs compared to carbonate lithology, oil recoverability can be reduced, if injection fluid chemistry is not properly managed. Injection fluids whose constituents react with ASP or other chemicals found in formation water can catalyse precipitation chemistry. Solid material that forms during this process, or scale, can block pore pathways and the subsequent oil recovery that can be achieved. In the Case 2 project, water treatment equipment must address this constraint, by being able to remove hardness to very low levels, minimizing the potential for scale formation. Overall, water treatment technologies used in this application must be able to: • Provide injection water with ultra-low hardness, to prevent scaling within the reservoir • Provide robust equipment that produces consistent treated water quality from seawater whose quality can vary • Demand minimum weight requirements • Demand minimum footprint requirements Developing and Piloting Water Treatment Technologies for Offshore EOR Projects The Case 1 and Case 2 EOR projects indicate there are numerous unique constraints that water treatment technologies must be able to address, ranging from the ability to provide robust, flexible treatment infrastructure that produces a consistent treated water quality, to requirements for minimal weights and footprints to render technologies suitable for offshore applications. Pilot studies can be designed to investigate the capabilities for which water treatment technologies are known, such as their ability to provide efficient hardness treatment, in tandem with their ability to address other project-specific constraints. Project Background. In 2012, a pilot study was designed and implemented to investigate the potential for a proprietary design that leverages the capabilities of Reverse Osmosis (RO) and IOR 2013 – 17th European Symposium on Improved Oil Recovery St. Petersburg, Russia, 16-18 April 2013
- 4. Nanofiltration (NF) technologies, to achieve unique treatment objectives apparent in the Case 1 and Case 2 EOR projects. These treatment objectives included the ability to produce a range of water quality chemistries, including ultra-low hardness/high salinity, and low salinity injection water. RO and NF are membrane-based technologies accepted in many industries as robust, reliable, and cost-effective water treatment devices. There is over 43 million m3/day of ionic separation capacity, including RO and electrodialysis, and over 19 million m3/day of membrane installation capacity globally (IDA 2011, Furukawa 2008). However, despite this extensive experience, only a small portion of it can be found in oil and gas facilities (Henthorne 2012). Experimental Design. To evaluate the potential for the proprietary RO/NF-based technology to overcome unique challenges apparent in EOR applications, a phase-based pilot study was designed to achieve specific objectives according to Key Performance Indicators (KPI). Phase 1a. The proprietary RO/NF technology was evaluated based on its ability to respond to changing seawater quality and permeate set points, particularly for hardness and TDS. This would be done to portray field conditions in which seawater quality varies and then impacts the permeate quality, as well as to mimic changing membrane performance, over time. Objectives and KPI included: • • Objective 1: Demonstrate the ability to change and control output salinity and hardness levels from the blended permeate of RO and NF test units at various set points KPI: Response to changes in a set point within a specified time; response to a change in seawater quality within a specified time of 20 minutes; stabilization of output salinity within ±150 mg/L of the set point within the specified time Phase 1b. The proprietary RO/NF technology was evaluated based on its ability to produce a wide range of treated effluent qualities using the same baseline water treatment infrastructure. This would be done to portray project conditions in which treated injection water quality requirements change over the lifetime of EOR program, such as that under consideration in the Case 1 field. Objectives and KPI included: • • Objective 2: Demonstrate the ability to operate with various types of RO and NF elements to produce different water qualities suitable for different injection purposes KPI: Ability to achieve new blend permeate quality set points; ability to achieve projected salt rejection of new RO and NF membranes; ability to achieve projected flows of new RO and NF membranes Phase 2. The need for ion selective NF products for the upcoming water-based EOR projects required verification these products were suitable for duty. • • Objective 3: Demonstrate and assess the performance of a specialized NF technology in various pass configurations KPI: Ability to reject calcium, magnesium, sulphate, sodium, and chloride at the permeate streams of various passes; ability to respond to different feed pressure requirements; ability to recover water in various passes Methods. The pilot study was conducted at the Bureau of Reclamation’s Brackish Groundwater National Desalination Research Facility (BGNDRF) in Alamogordo, New Mexico, USA. A customized, containerized RO/NF system was designed and delivered to the site. The pilot system operated in a feed recirculation loop, in which permeate and concentrate lines were recombined in an external tank and re-fed through the two independent systems. Seawater was simulated by adding conventional salts to high-purity RO permeate according to the Brumewicz artificial seawater recipe IOR 2013 – 17th European Symposium on Improved Oil Recovery St. Petersburg, Russia, 16-18 April 2013
- 5. (Brumewicz 1970). A comparison of this water quality with that anticipated in the Case 1 field is set out in Table 3: Constituent Units Simulated Seawater Temperature pH Turbidity °C NTU Total Hardness as Ca and Mg Case 1 Field Measured Balanced 20 - 35 7.5-8.5 <1 22 - 31 8.2 - 22 - 31 8.2 - mg/L 1,628 1,514 1,514 Chlorides mg/L 18,938 - - Total Dissolved Solids mg/L 34,099 33,830 34,618 Total Suspended Solids mg/L <1 10 10 Sulphate mg/L 2,436 2,950 2,500 Calcium mg/L 387 352 352 Magnesium mg/L 1,241 1,162 1,162 Sodium mg/L 10,505 10,240 10,796 Potassium mg/L 380 485 485 Carbonate mg/L function of pH 24.3 24.3 Bicarbonate mg/L 147 at pH 8.3 143 143 Table 3 Comparison of simulated seawater quality and expected seawater quality in the Case 1 field. A five micron cartridge filter was provided to remove any potential solids or debris in the feed water, prior to downstream RO and NF treatment. The biocide 2,2-dibromo-3-nitrilopropionamide (DBNPA) and phosphonate-based antiscalent were utilized to limit biological fouling and scaling potential, respectively. In addition, the pilot unit was equipped with a Clean in Place (CIP) system for membrane cleaning, in case it was required. The membrane treatment equipment was outfitted with a proprietary controls system that would modify the operating set points of the RO and NF systems in response to water quality. Water quality was monitored using online instrumentation and verified through laboratory testing utilizing standard testing procedures developed specifically for each analyte. Results and Discussion. Pilot testing revealed the proprietary RO/NF-based system was able to achieve its objectives according to its KPI. During Phase 1a, the proprietary controls system successfully demonstrated its ability to stabilize system performance rapidly in response to a conductivity step point step change. The RO/NF system was able to be stabilized to within ±150 mg/L of this set point in several minutes, a significant improvement from the 20-minute timeframe designated in the KPI. The equipment response to a 10% change in seawater salinity, over time, is set out in Figure 2: IOR 2013 – 17th European Symposium on Improved Oil Recovery St. Petersburg, Russia, 16-18 April 2013
- 6. Figure 2 Equipment response to a 10% change in salinity set point. During Phase 1b, RO and NF membrane elements successfully demonstrated the ability to produce water qualities required for different types of CEOR programs. The ability of the membranes to mimic expected performance from manufacturer projections is an indicator of this, as illustrated in Figure 3: Figure 3 Proprietary NF membrane performance compared to manufacturer projections. The NF equipment aligned with performance expectations within several percentage points. IOR 2013 – 17th European Symposium on Improved Oil Recovery St. Petersburg, Russia, 16-18 April 2013
- 7. Phase 2 of pilot testing demonstrated the ability of the membrane technology to reliably recover water within various passes, amongst other capabilities. Membrane performance trends are given in Figure 4: 10.00 50 Temperature Flux 45 9.00 Specific Flux 10 2.00 5 1.00 0 0.00 Specific Flux** (LMH/BAR) 3.00 4/6/12 4.00 4/1/12 20 3/27/12 5.00 3/22/12 25 3/17/12 6.00 3/12/12 30 3/7/12 7.00 3/2/12 35 2/26/12 8.00 15 Flux (LMH) and Temperature (C) 40 Figure 4 Proprietary NF performance trends over time. As Figure 4 suggests, the proprietary NF membrane was able to achieve consistent performance within various passes of its design, over time. This condition would be required to enable water quality requirements to be achieved in CEOR projects, such as those in the Case 1 and Case 2 fields. Conclusions Growing interest in EOR development provides an opportunity for water treatment equipment providers, whose designs are uniquely positioned to address a range of challenges apparent in both onshore and offshore projects. While many water treatment technologies have limited operational experience in the Oil & Gas Industry, designing and implementing pilot studies that address specific constraints apparent in real-world projects will enable the capabilities of these systems to be leveraged to enhance their applicability to these projects. Successful testing of a proprietary RO/NF design that addressed constraints apparent in the Case 1 and Case 2 CEOR projects confirmed new technologies can be designed to address challenging issues that arise in offshore EOR applications. Acknowledgements The authors would like to acknowledge and thank the Staff at BGNDRF for their assistance during pilot testing at their facility, as well as Buddy Boysen, Steve Van Pelt, Carter Brown, Valentina Llano, and other Water Standard Staff for their assistance during this project. Collaborators at PETRONAS are also appreciated for their support, guidance and permission to publish this paper. IOR 2013 – 17th European Symposium on Improved Oil Recovery St. Petersburg, Russia, 16-18 April 2013
- 8. References Alvardo, V. and E. Manrique. [2010] Enhanced Oil Recovery: An Updated Review. Energies, 3(9), 1529-1575. August 2010. Brumewicz. [1970] Molecular Composition of Artificial Seawater. Office of Saline Water 2.0, Report 1121. Furukawa, D. [2008] Global Perspective of Low Pressure Membranes. National Water Research Institute. Henthorne, L. and Wodehouse, J. [2012] The Science of Membrane Technology to Further Enhance Oil Recovery. SPE Paper 154281. Presented at the SPE Improved Oil Symposium, April 2012. Idaho National Laboratory [2011] Oil Reservoir & Environmental Technologies – Improved Waterflooding and Wettability. https://inlportal.inl.gov/portal/server.pt/community/oil_reservoir___ environmental_technologies/439/improved_waterflooding_and_wettability/5204. International Desalination Association. [2011] The State of Desalination. Presented at the IDA World Congress on Desalinataion and Water Reuse. Morrow, N. and Buckley, J. [2011] Improved Oil Recovery by Low-Salinity Waterflooding. JPT. May 2011. Shell. [2009]Presentation at Westhollow Technology Day. IOR 2013 – 17th European Symposium on Improved Oil Recovery St. Petersburg, Russia, 16-18 April 2013