CCS335 _ Neural Networks and Deep Learning Laboratory_Lab Complete Record
Reporte del monitoreo de recurso de agua subterránea en la isla de Utila, Honduras y plan de manejo
1. Consultant:
Sub-Consultant:
Prepared for:
Jewel Cay
Pigeon Cay
East Harbor
Pumpkin
Hill
Stuart
Hill
United States Agency for
International Development
GROUNDWATER RESOURCES
MONITORING REPORT AND
MANAGEMENT PLAN
Island of Utila, Republic of Honduras, C. A.
June 2002
2. 2701 Prospect Park Drive
Rancho Cordova, California 95670
Tel: (916) 444-0123
Fax: (916) 635-8805
www.brownandcaldwell.com
P:2100021143ReportUtila ReportFinal Cover Letter.doc
July 25, 2002
Ing. Mauricio Cruz
Chief Technical Officer
Agencia de los Estados Unidos para el Desarrollo Internacional
Frente a la Embajada Americana
Avenida La Paz, Post Office Box 3453
Tegucigalpa, M.D.C., Honduras
Subject: Groundwater Resources Monitoring Report and Management Plan,
Utila, Honduras, Contract No. 522-C-00-01-00287-00
Dear Ing. Cruz:
In accordance with the above referenced contract, Brown and Caldwell is pleased
to forward two copies of the English version of the Groundwater Resources
Monitoring Report and Management Plan for Utila, Honduras. The Spanish
language version of this report is being submitted separately. Each report includes
the electronic file of the report and the Water Resources Management System on
two separate compact disks.
The submittal of this report and the reports for Limón de la Cerca, Choloma,
Villanueva, and La Lima complete our work under this contract.
We appreciate the opportunity to have been of service to USAID. If you have any
questions, please do not hesitate to give me a call at (925) 210-2278.
Sincerely,
BROWN AND CALDWELL
Jeff Nelson, P.E.
Project Director
JN:PS:ap
Enclosure
3. Signatures of principal personnel responsible for development and execution of this report.
P:2100021143ReportUtila ReportFINAL GW Report-Utila.doc
Jeff Nelson, P.E.
Project Director
Horacio Juarez, P.E.
Project Manager
Paul Selsky, P.E.
Phase 5 Report Preparation Manager
Gregory L. Christians, P.G.
Florida Professional Geologist #2219
Principle Geologist
Julie Wright, R.G.
Arizona Registered Geologist #37120
Groundwater Modeling
Milton Sagastume
Local Project Coordinator - Honduras
4. P:2100021143ReportUtila ReportFINAL GW Report-Utila.doc
PROJECT PARTICIPANTS
U.S. Agency for International Development (USAID)
Ing. Mauricio Cruz, Tegucigalpa, Honduras
Ing. Carlos Flores (Retired September 2001), Tegucigalpa, Honduras
Ing. Carlos Verdial, Tegucigalpa, Honduras
United States Geological Survey (USGS)
Wes Meehan, Tuscon, AZ
Fondo Hondureño de Inversión Social (FHIS)
Jorge Flores, Honduras
Municipality of Utila
Alton Cooper, New Mayor of Utila (Elected November 2001)
Monty Cardenas, Former Mayor of Utila
Brown and Caldwell, Lead Consultant
Voytek Bajsarowicz, Walnut Creek, CA, Principal-in-Charge
Harry Brenton, Phoenix, AZ, Field Geologist
Greg Christians, Nashville, TN, Groundwater Modeling
Dana Downs, Phoenix, AZ, Report Preparation
Bob Grace, Walnut Creek, CA, Project Advisor
Jason Grant, Walnut Creek, CA, Field Engineer
Melanie Holton, Sacramento, CA, Water System Engineer
Horacio Juarez, El Paso, TX, Project Manager
Jay Lucas, Sacramento, CA, Phase 2 Field Investigation Manager
Shalom Marquardt, Sacramento, CA, Database Preparation
Jeff Nelson, Walnut Creek, CA, Project Director
Jim Oliver, Phoenix, AZ, Phase 3 Groundwater Modeling Manager
Ah’lai Phelps, Sacramento, CA, Report Preparation
Allan Scott, Sacramento, CA, Phase 4 Database Manager
Paul Selsky, Sacramento, CA, Phase 5 Report Preparation Manager
Julie Wright, Phoenix, AZ, Groundwater Modeling
Asesores Técnicos en Ingenieria y Ciencias Abmientales (ATICA) – Hydrogeology
Subconsultant, San Pedro Sula, Honduras
Milton Sagastume, Local Project Coordinator
Marlon Pineda, Field Engineer
Servicios de Perforación, S. de R. L. de C. V. (SERPE) – Well Drilling Subcontractor,
Tegucigalpa, Honduras
Terra-Dynamics Consulting, Inc. (TDC) – Electromagnetic Survey Subconsultant,
Lewiston, New York, United States
David Slaine, Hydrogeologist, Lewiston, New York, United States
5. i
P:2100021143ReportUtila ReportFINAL GW Report-Utila.doc
TABLE OF CONTENTS
LIST OF APPENDICES................................................................................................................. ii
LIST OF TABLES.......................................................................................................................... iii
LIST OF FIGURES........................................................................................................................ iii
LIST OF ABBREVIATIONS......................................................................................................... iv
GLOSSARY OF TERMS................................................................................................................ v
REFERENCES .............................................................................................................................. vi
EXECUTIVE SUMMARY........................................................................................................ ES-1
Background.................................................................................................................... ES-1
Description of Existing Water System and Water Demands........................................... ES-1
Groundwater Resources Evaluation............................................................................... ES-2
Water Resources Management System............................................................................ ES-3
Recommended Groundwater Resources Management Plan............................................ ES-4
1.0 INTRODUCTION .......................................................................................................... 1-1
1.1 Project History and Objectives.............................................................................. 1-1
1.2 Contract and Scope of Work................................................................................. 1-3
1.3 Report Organization.............................................................................................. 1-3
2.0 BACKGROUND ............................................................................................................. 2-1
2.1 Geographical Setting............................................................................................. 2-1
2.2 Climate.................................................................................................................. 2-1
2.3 Geology and Soils................................................................................................. 2-2
2.4 Hydrogeology........................................................................................................ 2-4
2.5 Land Use............................................................................................................... 2-5
2.6 Summary of Past Studies....................................................................................... 2-5
2.7 Wastewater Management....................................................................................... 2-6
2.8 Regulatory Setting................................................................................................. 2-6
3.0 DESCRIPTION OF EXISTING WATER SYSTEM AND WATER DEMANDS......... 3-1
3.1 Municipal Water Supply and Distribution System.................................................. 3-1
3.1.1 Service Area.............................................................................................. 3-1
3.1.2 Water Supply Wells................................................................................... 3-1
3.1.2.1 Municipal Water Supply Wells....................................................... 3-1
3.1.2.2 Private Water Supply Wells........................................................... 3-4
3.1.3 Other Water Sources................................................................................. 3-5
3.1.4 Water Storage Facilities............................................................................. 3-5
3.1.5 Piping System............................................................................................ 3-5
3.2 Historical and Projected Water Demands.............................................................. 3-5
3.2.1 Demographics........................................................................................... 3-5
3.2.1.1 Population and Housing................................................................ 3-6
3.2.1.2 Tourism ........................................................................................ 3-7
3.2.1.3 Commercial Establishments.......................................................... 3-8
3.2.1.4 Connections.................................................................................. 3-9
3.2.2 Historical Water Use................................................................................. 3-9
3.2.3 Unit Water Use....................................................................................... 3-10
3.2.4 Projected Water Demands....................................................................... 3-10
6. ii
P:2100021143ReportUtila ReportFINAL GW Report-Utila.doc
TABLE OF CONTENTS (continued)
4.0 GROUNDWATER RESOURCE EVALUATION......................................................... 4-1
4.1 Conceptual Hydrogeologic Model......................................................................... 4-1
4.2 Field Investigation Program.................................................................................. 4-1
4.2.1 Geophysical Survey................................................................................... 4-1
4.2.2 Fracture Trace Analysis............................................................................. 4-2
4.2.3 Well Installation........................................................................................ 4-4
4.2.4 Aquifer Testing......................................................................................... 4-7
4.2.5 Water Quality Survey................................................................................. 4-7
4.2.6 Other Investigation Activities.................................................................... 4-8
4.2.7 Field Investigation Results......................................................................... 4-8
4.3 Results of Numeric Groundwater Model............................................................. 4-10
4.4 Potential Contamination Sources......................................................................... 4-11
4.5 Summary of Findings.......................................................................................... 4-11
5.0 WATER RESOURCES MANAGEMENT SYSTEM...................................................... 5-1
5.1 Benefits of the WRMS .......................................................................................... 5-2
5.2 Use and Management............................................................................................ 5-2
5.3 Utila Data.............................................................................................................. 5-3
6.0 RECOMMENDED GROUNDWATER RESOURCES MANAGEMENT PLAN........ 6-1
6.1 Implementation of a Groundwater Monitoring Program....................................... 6-1
6.2 Development of a Wellhead Protection Plan......................................................... 6-2
6.3 Utilization of the Water Resources Management System....................................... 6-2
6.4 Water Utility Management..................................................................................... 6-3
6.5 Recommended Additional Studies......................................................................... 6-4
6.5.1 Rainfall Capture from Roof Top Systems.................................................. 6-4
6.5.2 Aquifer Storage and Recovery................................................................... 6-4
6.5.3 Desalinization of Water............................................................................. 6-5
6.5.4 Low Flow Gallery Pumping ...................................................................... 6-5
6.5.5 Low Flow Wells. ....................................................................................... 6-5
6.5.6 Shipping Water from Mainland................................................................. 6-5
6.6 Control of Groundwater Pumping and Recharge Area Land Use.......................... 6-5
6.7 Regulate Population Growth................................................................................. 6-5
LIST OF APPENDICES
Appendix A Conceptual Model and Rationale for Phase II Field Investigation (Revised: Feb. 2002)
Conceptual Model Update
Appendix B Geophysical Survey Results
Appendix C Phase II Field Investigation Results
Appendix D East Harbor Groundwater Flow Model
Appendix E Water Resources Management System Users Guide
Appendix F Brown and Caldwell’s Trip Reports
Appendix G Groundwater Level and Monitoring Program - Field Manual
Appendix H Wellhead Protection Plan
Appendix I Training and Workshops
7. iii
P:2100021143ReportUtila ReportFINAL GW Report-Utila.doc
TABLE OF CONTENTS (continued)
LIST OF TABLES
Table 2-1. Precipitation and Temperature, 1977-2000............................................................... 2-2
Table 3-1. Municipal Well Information..................................................................................... 3-1
Table 3-2. Private Well Information.......................................................................................... 3-4
Table 3-3. Population by Neighborhood from 1999 through 2009............................................ 3-6
Table 3-4. East Harbor Households by Neighborhood and People per Household in 1999...... 3-6
Table 3-5. Historical and Projected Visitors.............................................................................. 3-7
Table 3-6. Total Projected Population....................................................................................... 3-7
Table 3-7. Commercial Establishments..................................................................................... 3-8
Table 3-8. Active Municipal Connections in 2000 by Neighborhood ........................................ 3-9
Table 3-9. Projected Water Demands...................................................................................... 3-10
Table 4-1. Summary of Well Construction Specifications.......................................................... 4-4
Table 4-2. Summary of Well Analytical Results......................................................................... 4-7
Table 5-1. Utila GIS Data Dictionary........................................................................................ 5-3
Table 6-1. WRMS Reports and Maps........................................................................................ 6-2
LIST OF FIGURES
Figure ES-1. Groundwater Resources Planning Map..................................................................ES-5
Figure ES-2. Cross Section A-A”................................................................................................ES-6
Figure ES-3. Cross Section B-B”................................................................................................ES-7
Figure 1-1. Site Location............................................................................................................ 1-2
Figure 2-1. Village Situated on Pigeon Cay................................................................................. 2-1
Figure 2-2. View from Stuart Hill looking Northwest towards Pumpkin Hill and
the New Airport....................................................................................................... 2-2
Figure 2-3. Bay Island of Utila.................................................................................................... 2-3
Figure 3-1. Existing Water System.............................................................................................. 3-2
Figure 3-2. Utila Municipal Wells – MW 1, MW 2, and MW 3.................................................... 3-3
Figure 3-3. Old Indian Well....................................................................................................... 3-3
Figure 3-4. MW Cay................................................................................................................... 3-3
Figure 3-5. Utila Water Distribution System.............................................................................. 3-5
Figure 3-6. Historical and Projected Total Water Service Population.......................................... 3-8
Figure 3-7. East Harbor Projected Water Demands................................................................. 3-11
Figure 4-1. Stuart Hill and Surrounding Area............................................................................. 4-3
Figure 4-2. Well Installation....................................................................................................... 4-4
Figure 4-3. Cross-Section A-A’................................................................................................... 4-5
Figure 4-4. Cross-Section B-B’................................................................................................... 4-6
Figure 4-5. Conductivity Map..................................................................................................... 4-9
8. iv
P:2100021143ReportUtila ReportFINAL GW Report-Utila.doc
LIST OF ABBREVIATIONS
bgs below ground surface
ft feet
GIS geographic information system
gpcd gallons per capita per day
gpd gallons per day
gpm gallons per minute
in inch
km kilometer
lpcd liters per capita per day
lps liters per second
m meter
mg/L milligrams per liter
mgd million gallons per day
mi mile
mld million liters per day
mm millimeter
TDS total dissolved solids
USAID United States Agency for International Development
VOC volatile organic chemicals
WHO World Health Organization
WRMS Water Resources Management System
ZIP zoned industrial park
9. v
P:2100021143ReportUtila ReportFINAL GW Report-Utila.doc
GLOSSARY OF TERMS
Aquifer: A formation, group of formations, or part of a formation that contains sufficient saturated
permeable material to yield economical quantities of water to wells and springs.
Aquifer Test: A test involving the withdrawal of measured quantities of water from or addition of
water to, a well and the measurement of resulting changes in head in the aquifer both during and
after the period of discharge or addition.
Archipelago: Any cluster of islands.
Breccias: Rock composed of sharp-angled fragments embedded in a fine-grained matrix.
Cays: Small low islands.
Conductivity: Quality or capability of transmitting and receiving. Normally used with respect to
electrical conductivity.
Ephemeral: Anything short-lived.
Fault: A fracture in the continuity of a rock formation caused by a shifting or dislodging of the
earth's crust, in which adjacent surfaces are displaced relative to one another and parallel to the plane
of fracture.
Fracture Trace: Natural linear features less than 1.6 kilometers (1 mile) long that can be identified
by aerial photographs.
Groundwater: The body of water that is retained in the saturated zone that tends to move by
hydraulic gradient to lower levels.
Infiltration: The entrance of applied water in the soil through the soil-water interface.
Irrigation: Application of water to the land to meet the growth needs of plants.
Karst: An area of limestone terrain characterized by sinks, ravines, and underground streams.
Lithology: The study of rocks; primarily mineral composition.
Metamorphic Rocks: Pertaining to, produced by, or exhibiting, certain changes which minerals or
rocks may have undergone since their original deposition; -- especially applied to the recrystallization
which sedimentary rocks have undergone through the influence of heat and pressure, after which
they are called metamorphic rocks.
Normal Faults: When the fault plane is so inclined that the mass on its upper side has moved up
relatively.
Pyroclastic Flows: Composed chiefly of fragments of volcanic origin, as agglomerate, tuff, and
certain other rocks; volcaniclastic. (definition for pyroclastic)
Surface Geophysical Survey: The study of specific information on the stratigraphy and structure
of the local geologic environment as well as aquifer properties.
10. vi
P:2100021143ReportUtila ReportFINAL GW Report-Utila.doc
REFERENCES
Bond, Steven. 1998. Hydrogeology of Roatan, Utila, and Guanaja, a Synoptic Survey with Recommendations for
the Terms of Reference, The Bay Islands, Honduras, C.A. Prepared for Water For People, in Support of the
Bay Islands Environmental Project.
Hemmett. 1998. 2nd
Ed. Mapa Geologico de Honduras, Utila, Instituto Geografico Nacional de la Secretaria de
Comunicaciónes Obras Publicas y Transporte.
Fundacion Para el Desarrollo Municipal (FUNDEMUN), Municipalidad de Utila, USAID. 2000.
Estrategia Participativa de Desarrollo Integral de Utila, Islas de la Bahia.
Instituto Geografico Nacional, Servicio Autonomo Nacional de Acueductos y Alcantarillados,
Organizacion para el Desarrollo de Ultramar, and Oficina Regional de Ciencia y Tecnologia para
America Latina y el Caribe. Mapa Hidrogeologico de la Republica de Honduras, Escala 1:500,000.
SANAA. 1993. Informe Tecnico No. 28. Condiciones Hidrogeológicas y la explotación de aguas subterraneas en
Utila, Islas de la Bahia.
USAID. 1999. Terms of Reference for the Rehabilitation and Expansion of the Water Supply System and the
Upgrade of the Sewerage System, Utila, Islas de la Bahia, Honduras.
USAID. 2000. Results Review and Resource Request, USAID/Honduras.
U.S. Army Topographic Engineering Center. 1996. Water Resources Areal Appraisal, Honduras.
11. P:2100021143ReportUtila ReportFINAL GW Report-Utila.doc
EXECUTIVE SUMMARY
Groundwater Resources Monitoring Report and Management Plan
Utila, Honduras
June 2002
The United States Agency for International Development (USAID) contracted Brown and Caldwell
to perform groundwater monitoring studies for the Island of Utila (Utila) and the municipalities of
Villanueva, Choloma, La Lima, and the resettlement community of Limón de la Cerca near
Choluteca. This Groundwater Resources Monitoring Report and Management Plan presents the
results of the groundwater monitoring study and includes a groundwater resource management plan
to help ensure the sustainable management of the groundwater resources for Utila, Honduras.
Background
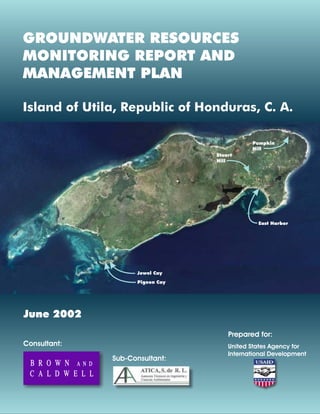
Utila is one of the three main islands of the Bay Islands archipelago located about 30 kilometers
(km) (19 miles) north of the coast of mainland Honduras in the Caribbean Sea. Almost all of Utila’s
population lives on the eastern one-third of the island, in an area called East Harbor, also known as
Utila Town. Also, a small number of residents live in a fishing village, known as Los Cayitos, off of
Utila’s southwestern coastline and inhabits two cays, or small islands, known as Pigeon (Lower) Cay
and Jewel (Upper) Cay.
Utila is a low relief island. Geologically, the western two-thirds of the island consists of a cap of
coralline limestone and carbonate sediments that is underlain by metamorphic rocks. This part of
the island is characterized by low-lying areas that contain mangrove swamps and savannas with
brackish surface water. The eastern third of the island consists of Holocene volcanics characterized
by two hills, or relief cones. Stuart Hill (elevation 51 meters (m) (167 feet (ft))) is located
approximately 2 km (1.2 miles) inland from the center of East Harbor, and Pumpkin Hill (elevation
74 m (243 ft)) is located on the northeastern coast about 6 km (3.7 miles) from East Harbor. The
land between these two landmarks contains rolling hills covered in dense vegetation. The entire
island is surrounded by an extensive coral reef. The climate of Utila is considered tropical, with
annual precipitation ranging between 2,200 millimeters (mm) (87 inches (in)) and 2,600 mm (102 in)
per year.
Description of Existing Water System and Water Demands
Four municipal wells provide the municipal water supply for East Harbor. Three of the wells pump
directly into the distribution system with a combined capacity of 4 liters per second (lps) (60 gallons
per minute (gpm)). Water is available from the fourth well by hand bailing. Another manual access
well provides water supply for the community of Pigeon Cay. Some of the residents of Utila have
constructed their own private wells to supplement the municipal water distribution system. In
addition, some Utila residents use rainwater collected in cisterns for water supplies.
12. Groundwater Resources Monitoring Report and Management Plan
Utila, Honduras
ES-2
P:2100021143ReportUtila ReportFINAL GW Report-Utila.doc
The East Harbor distribution system consists of one 94,635 liter (25,000 gallon) water storage tank,
with one pressure zone that is gravity fed from the tank. The Utila piping system consists of
approximately 3.7 km (2.3 miles) of 102 mm and 152 mm (4 in and 6 in) diameter polyvinyl chloride
piping. There is no filtration or disinfection of the water before it enters the distribution system.
East Harbor had a population of approximately 6,100 residents in 2001. Based on a FUNDEMUN
Study, it is estimated that the East Harbor population will increase to 12,221 by 2009 and 19,612 by
2020. The Los Cayitos community had a population of about 1,700 people in 2001. It is estimated
that the Los Cayitos population will increase to 3,255 by 2009 and 4,944 by 2020. In the year 2001,
there were approximately 45,177 visitors to Utila, with the average length of stay per visitor
estimated to be approximately 7.4 days. Tourism is expected to increase to 106,264 visitors by 2009
and 241,150 visitors by 2020.
Brown and Caldwell’s field investigations conducted for this study indicates that the municipal water
system has an average annual daily water production of about 246,000 lpd (65,000 gpd). This results
in a current per capita water use of 34.8 liters per capita per day) (9.2 gallons per capita per day),
which includes tourists but excludes water use from private wells and rainfall harvesting. Water
demands to serve East Harbor by 2020 are expected to increase to 927,000 liters per day (245,000
gallons per day) (274 acre-feet per year).
Groundwater Resources Evaluation
The groundwater resources evaluation consisted of the development of a conceptual hydrogeologic
model, field investigations, the development of a numeric groundwater model, and the identification
of potential groundwater contamination sources.
The initial conceptual hydrogeologic model stated that infiltrating precipitation could develop a
fresh water lens within the coral limestone extending into the underlying volcanic units. This
infiltrated precipitation is less dense than the seawater and creates a zone or lens of freshwater laying
on top of the saltwater. Recharge of precipitation would flow in a radial pattern from the higher
elevation areas, such as Stuart Hill, displacing seawater and potentially forming a usable potable
water resource.
Based on the conceptual hydrogeologic model, the Stuart Hill area was identified as having the
greatest probability of providing sustainable groundwater supplies, and thus, the field investigation
was focused in this area. The primary objective of the field investigation was to evaluate if a
significant lens of fresh water exists in the Stuart Hill area. The field investigation in this area
consisted of conducting a surface geophysical survey, a fracture trace analysis, installation and testing
of five wells, and a water quality survey.
The surface geophysical survey consisted of an electromagnetic survey to evaluate subsurface
resistivity to identify the presence of fresh water. The fracture trace analysis consists of using aerial
photos, maps, and field reconnaissance to identify visible fractures and faults that may provide
13. Groundwater Resources Monitoring Report and Management Plan
Utila, Honduras
ES-3
P:2100021143ReportUtila ReportFINAL GW Report-Utila.doc
conduits for fresh water infiltration. The results of the geophysical investigation combined with the
results of the fracture trace analysis delineated a potential fresh water zone in the vicinity of Stuart
Hill. Drilling locations were selected based on these findings.
From August through October 2001, Brown and Caldwell conducted a subsurface investigation that
consisted of drilling five test wells. Short-term (2- to 4-hour pumping) and long-term (48-hour
pumping) aquifer tests were performed on some of the test wells to evaluate the groundwater
resource development potential. A small, localized zone of freshwater northeast of Stuart Hill was
identified surrounding well BCUT-4. A numerical groundwater flow model was prepared to
simulate limited groundwater production of this water source. Evaluation of the model results
suggest that limited water production of this zone of 1.5 lps (24 gpm) is available for short-term
water supply demands for less than one year of continuous pumping after which increasing salinity
would make the supply unacceptable for potable water use.
Water quality surveys of the existing wells and test wells, performed by Brown and Caldwell, found
that water quality on the island is generally poor with few wells producing significant quantities of
water with estimated total dissolved solids concentrations of less than 1,000 milligrams per liter.
There are several potential sources of contamination to the shallow fresh water aquifer in the vicinity
of Stuart Hill. These sources include cattle grazing areas and private wastewater disposal facilities.
Results of the field investigation indicate that a significant fresh water lens is not present beneath the
island. The absence of a well-developed freshwater lens is believed to be due to the volcanic clay
soils that inhibit the vertical recharge of precipitation. Of the 2.4 m (7.9 ft) of precipitation that Utila
receives annually, it is estimated that only 2.5 percent recharges the fresh groundwater aquifer
system in the vicinity of the Stuart Hill recharge area. The results of the field investigation did
indicate the presence of fresh water in the coralline limestone northeast of Stuart Hill. However, the
extent of this fresh water is limited and will not support substantial groundwater development above
a total average annual extraction of 1 to 2 lps (20 to 30 gpm). Current annual water use by the
municipal wells is estimated to be 3 lps (45 gpm). Therefore, it appears that the safe yield of the
aquifer is currently exceeded, which indicates that groundwater quality may be deteriorating over
time. Water quality and well yield potential for the remaining portion of the island has a very low
potential for further groundwater development and would not likely support high water quality well
yields greater than 0.3 to 0.6 lps (5 to 10 gpm).
Water Resources Management System
The Water Resources Management System is a desktop computer application developed to store,
manage, and analyze technical information gathered and generated for this project. The application
is a management tool that can be used by the municipality and other decision-makers to sustainably
manage Utila’s groundwater resources. The system is composed of both a data management system
and a geographic information system linked together as one application.
14. Groundwater Resources Monitoring Report and Management Plan
Utila, Honduras
ES-4
P:2100021143ReportUtila ReportFINAL GW Report-Utila.doc
Recommended Groundwater Resources Management Plan
Figure ES-1 presents a groundwater resources planning map that depicts the locations of the
existing wells, test wells, and other key information. Geologic cross sections are presented in
Figures ES-2 and ES-3. The following recommendations are made in order to address Utila’s water
supply:
1. Conduct a regular groundwater monitoring program consisting of monitoring groundwater
levels, groundwater useage, and water quality in selected wells. For Utila, it is particularly
important to establish if groundwater quality is deteriorating over time in relation to
groundwater extraction rates. Collected groundwater data should be input into the database.
2. Establish a wellhead protection program to reduce the chance of groundwater
contamination impacting water supply wells.
3. Use the database, also known as the Water Resources Management System, to input data
regarding new wells and from the monitoring program.
3. Ensure a functioning water utility that is financially self-sufficient by:
a. developing a customer inventory;
b. developing a financial plan and charge customers for water useage;
c. having a governance structure and appropriate staff;
d. addressing water loss from the distribution system; and
e. investigating potential sources for grants and loans.
4. Given the restricted water supply conditions in Utila, conduct a study to evaluate water
supply alternatives.
5. Since the potable groundwater resource in Utila is limited, it is recommended that the
municipality limit, by municipal regulation, any increase in pumping and the construction of
new wells and protect the upland recharge areas. New development should be required to
utilize alternative water supply sources such as rainfall collection/cistern systems.
15. &-
&- &-
&-
&-
&- &-
&-
#6
#6#6
#6
East Harbor Utila
Stuart
Hill
Big
Bight
Pond
s
s
sss
ss
s
ss
ss
s
s
sss
s
sss
s
s
s
s
ss
s
s
ss
s
.
..
.
PROJECT TITLE
FIGURE
ES-1
DATE
21143
6-12-02
SITE
Groundwater Resources Planning Map
Utila Bay Islands, Honduras
A Line of Geologic
Cross-Section
A’
0 200 400
Meters
. Test Wells
6 Municipal Wells
s Private Wells
EXPLANATION
A
UT-4
UT-3
UT-2
UT-1/UT-1A
A’
B’
B
16. PROJECT TITLE
Utila Bay Islands, Honduras FIGURE
ES-2
DATE
21143
6-12-02
SITE
Cross-Section A-A’
17. PROJECT TITLE
Utila Bay Islands, Honduras FIGURE
ES-3
DATE
21143
6-12-02
SITE
Cross-Section B-B’
18. P:2100021143ReportUtila ReportFINAL GW Report-Utila.doc
1.0 INTRODUCTION
The United States Agency for International Development (USAID) retained Brown and Caldwell to
provide architecture and engineering services as part of the Honduras Hurricane Reconstruction
Program to assure the sustainability of permanent repairs and expansions of selected water supply
systems damaged by Hurricane Mitch. Specifically, this project consists of performing groundwater
monitoring studies for the Island of Utila, the Sula Valley (La Lima, Villanueva, and Choloma), and
the resettlement community of Nuevo Limón de la Cerca near Choluteca.
This Groundwater Resources Monitoring Report and Management Plan (Report) presents the
results of the groundwater monitoring study and presents a groundwater resource management plan
to help ensure the sustainable management of the groundwater resources of the Island of Utila
(Utila), Honduras.
This chapter provides a description of the project objectives, scope of work, project background,
and the report organization.
1.1 Project History and Objectives
Utila is one of the three main islands of the Bay Islands archipelago located about 30 km (18 miles)
north of the coast of mainland Honduras in the Caribbean Sea, as depicted on Figure 1-1. Utila
depends on groundwater as its primary source of municipal water supply. Rainfall harvesting is
practiced by some residents to supplement groundwater supplies. It is anticipated that reliance on
groundwater for the municipal water supply will increase as population growth continues in the
future. Past studies have suggested that there is a limited fresh groundwater resource on Utila. This
project was initiated by USAID due to the increasing population on Utila, the need to quantify the
available groundwater resources for sustainable development in this area, the need to develop the
groundwater resources while avoiding damage due to contamination and floods, and to identify and
manage a sustainable water supply capable of supporting the current and future populations of Utila.
This project is an important element in meeting overall USAID objectives in Honduras. Two
USAID objectives that are addressed best by this project are the sustainable improvements in family
health and more responsive and effective municipal government services, as described below
(USAID, March 2000).
Sustainable improvements in family health. This objectives desired result is the rehabilitation of
existing water system facilities, given that access to potable water reduces child diarrheal deaths,
especially in rural areas. The USAID performance indicator for this result is represented by the
percentage of rural water systems operating at the “A” level. This is defined as a system where a)
water is disinfected, b) there is a water board that meets at least every three months, c) there is a
water fee paid by users, d) there is a maintenance employee, and e) water is available from the system
on a daily basis.
19. Groundwater Resources Monitoring Report and Management Plan
Utila, Honduras
Page 1-2
P:2100021143ReportUtila ReportFINAL GW Report-Utila.doc
Figure 1-1. Site Location
More responsive and effective municipal government services. This objective includes a
desired result of increased coverage of public services, including potable water supply, as measured
by the percent of inhabitants receiving public utility services.
To help meet the above objectives, this project evaluated the sustainable yield of the groundwater
resources in the Utila area and developed a groundwater resources management plan to help ensure
a sustainable municipal water supply for the urban area of Utila. Key components of the project
include the following:
• identification of groundwater resources available to provide residents with a safe and
sustainable water supply;
• development of a groundwater resource management plan and related tools that can be
implemented and maintained by the municipality and its staff;
• training of local individuals in groundwater monitoring techniques, data collection, and
database management for the sustainable management of the groundwater resource; and
• project completion meetings with municipalities to discuss study results, present reports, and
describe recommendations to help ensure sustainable water supplies.
20. Groundwater Resources Monitoring Report and Management Plan
Utila, Honduras
Page 1-3
P:2100021143ReportUtila ReportFINAL GW Report-Utila.doc
1.2 Contract and Scope of Work
This study was conducted by Brown and Caldwell for USAID under contract No. 522-C-00-01-
00287-00, dated March 21, 2001. The scope of work for this project defines five phases for the
conduct of the study. These five phases are described below.
Phase I – Analysis of Existing Information/Development of Conceptual Hydrogeological Model. This phase
consisted of establishing consensus on the projects goals and objectives, data collection, preliminary
conceptual hydrogeologic model development, and the identification of additional data needs.
Phase II – Field Investigation. This phase consisted of a field investigation that included well drilling,
aquifer testing, and water quality monitoring to fill data gaps and help provide data for refining the
preliminary conceptual model. In addition, training was provided to local personnel in groundwater
monitoring techniques.
Phase III – Hydrogeologic Modeling and Analysis. This phase consisted of refining the conceptual
hydrogeologic model through quantitative groundwater modeling and analysis and development of
estimates of the long-term sustainable yield of water resources in the study area.
Phase IV - Database and Training in Monitoring and Database Management. This phase consisted of
groundwater database development, database training of local municipal staff, and preparation of
training manuals for both the database and monitoring methods. This phase was executed
concurrently with the other four phases.
Phase V – Final Report. This phase consisted of the development of a final project report that
summarizes project data, activities, study results, and recommendations for sustainable management
of the water resource in the area. The development of a groundwater resource management plan
that includes appropriate measures for the development of the groundwater resources was also
completed under this phase. This report represents the Phase V work product for the Utila urban
area.
1.3 Report Organization
This report is organized into six chapters and associated appendices. The contents of each of the
remaining chapters is briefly described below:
Chapter 2 – Background: This chapter provides a description of the community, climate, geology
and soils, hydrogeology, wastewater management, and the regulatory setting.
Chapter 3 - Existing Water System and Water Demands: This chapter describes the existing water
system and summarizes the historical demographics and projects future population and water use.
21. Groundwater Resources Monitoring Report and Management Plan
Utila, Honduras
Page 1-4
P:2100021143ReportUtila ReportFINAL GW Report-Utila.doc
Chapter 4 - Groundwater Resources Evaluation: This chapter summarizes the methods, procedures,
and results of the field investigation program. This chapter also presents a conceptual hydrogeologic
model and a numeric groundwater model, recommends and numerically simulates well fields, and
identifies potential sources of contamination to the groundwater resource. The training conducted
on groundwater monitoring techniques is described in Appendix I.
Chapter 5 - Water Resources Management System: This chapter provides an overview of the water
resource database and management tool developed for Utila and presents instructions for using this
tool to assist in the management of Utila’s water resource. The training on the use of the database is
described in Appendix I.
Chapter 6 – Conclusions and Recommendations: This chapter presents the conclusions and
groundwater resources management recommendations. This chapter also describes the scope for
recommended additional studies, if needed. Finally, this chapter presents a recommended
groundwater resource management plan and includes policy and institutional recommendations for
sustainable management of the resource.
22. P:2100021143ReportUtila ReportFINAL GW Report-Utila.doc
2.0 BACKGROUND
This chapter presents a description of the geographic setting for Utila, as well as the climate, geology
and soils, hydrogeology, land use, wastewater management, and regulatory setting.
2.1 Geographical Setting
Utila belongs to the Bay Islands archipelago, which consists of three major islands (Utila, Roatan,
and Guanaja) and 65 lesser islands or cays. The archipelago extends over an area of 500 square
kilometers (km) (193 square miles (mi)) and is located north of the Honduran coast in the Caribbean
Sea.
Utila is roughly 13 km (8.1 miles (mi)) in length and varies between 2 and 5 km (1.2 and 3.1 mi) in
width, with a land area of approximately 42 square km. Almost all of Utila’s population lives on the
eastern third of the island in an area called East Harbor, also known as Utila Town. Most of this
population has historically resided by the coast. At present, new houses are being built inland. It is
anticipated that there will be new development along the new road to the new airport.
A fishing village is located off Utila’s southwestern coastline on two cays, or small islands, known as
Pigeon (Lower) Cay and Jewel (Upper) Cay; this village is also known as Los Cayitos. Figure 2-1
depicts a view of the village.
2.2 Climate
The climate of Utila is considered tropical, with abundant rainfall. Utila receives between 2,200 and
2,600 millimeters (mm) (87 and 102 in) of precipitation per year, with nearly 70 percent of the
rainfall occurring from September through December. Due to the project’s short time frame and
availability of historical precipitation data, Brown and Caldwell did not collect supplemental rainfall
data. Southerly winds prevail
during most of the year, but
strong winds at times reverse this
condition, especially during
February and March. Average
monthly temperatures vary
between 24.5º to 28.5º Celsius
(76º to 83º Fahrenheit).
Table 2-1 presents monthly
precipitation and temperature
data for Utila, collected at the
Iguana Research Station near
Stuart Hill.
Figure 2-1. Village Situated on Pigeon Cay
23. Groundwater Resources Monitoring Report and Management Plan
Utila, Honduras
Page 2-2
P:2100021143ReportUtila ReportFINAL GW Report-Utila.doc
Table 2-1. Precipitation and Temperature, 1977-2000
Precipitation Tem perature
in m m ºF ºC
January 8.6 219 76.3 24.6
February 5.8 147 77.5 25.3
M arch 3.5 88 79.6 26.4
April 1.2 31 80.9 27.2
M ay 1.6 40 81.7 27.6
June 2.0 52 82.5 28.1
July 2.4 60 81.9 27.7
August 3.1 79 82.7 28.2
Septem ber 6.0 152 83.0 28.3
O ctober 17.2 436 80.7 27.1
Novem ber 24.2 614 79.0 26.1
Decem ber 11.6 296 76.5 24.7
Total 87.2 2,214 -- --
Source: Data gathered by James Gaborel at the Iguana Station, Utila, Honduras.
2.3 Geology and Soils
Geologically, the Bay Islands are located on the Caribbean plate near its boundary with the North
American plate. The boundary between these plates form the Motagua Fault Zone. The Bay
Islands are on the emergent crest of a narrow ridge on the south side of the Bartlett Trough formed
by the tectonic movement of the plates. Utila, quite different in appearance and relief from the
other Bay Islands, is a low relief island.
The geology of Utila consists primarily of
Quaternary terrace deposits and swamp
sediments and Quaternary volcanic material
overlying Quaternary coralline limestone. The
western two-thirds of the island is composed of
low-lying areas that contain mangrove swamps,
savannas, and brackish water. The eastern third
of the island is characterized by two extinct
volcanic cones, Stuart Hill located approximately
2 km (1.2 mi) inland from the center of East
Harbor, and Pumpkin Hill located on the
northeastern coast about 6 km (3.7 mi) from
East Harbor. Pumpkin Hill is the highest point
on the island at 74 meters (m) (243 feet (ft))
above sea level, and Stuart Hill is the next
highest at 51 m (167 ft) above sea level. The
land between these two landmarks contains
rolling hills covered by dense natural vegetation,
as shown in Figure 2-2. Figure 2-3 depicts an
aerial view of Utila.
Figure 2-2. View from Stuart Hill looking
Northwest towards Pumpkin Hill and the
New Airport
25. Groundwater Resources Monitoring Report and Management Plan
Utila, Honduras
Page 2-4
P:2100021143ReportUtila ReportFINAL GW Report-Utila.doc
Generally, the volcanic deposits of Stuart Hill and Pumpkin Hill are composed of highly weathered,
alkali basaltic lavas altered to clay, breccias, and pyroclastic flows. In outcrop at Stuart Hill, the
volcanics are characterized as relatively massive, fine-grained basaltic lava and semi-welded tuff.
Locally, within the Stuart Hill study area, the tuff is intensely weathered and altered to clay, with
thicknesses that range from 6 to 26 m (20 to 85 ft). At Pumpkin Hill, the volcanic deposits consist
of well-stratified basaltic breccias that form the remnants of a caldera. Outcropping on the lower
flanks of both Stuart Hill and Pumpkin Hill are coral limestone deposits that are believed to have
been uplifted during volcanic activity (Hemmett, 1988).
The underlying coral limestone typically ranges from having dissolution cavities of varying sizes, to a
massive and crystalline, fossiliferous limestone. In some areas along the eastern Utila coast, and in
road cuts along the new airport road, intense dissolution cavities and karst terrain with ancient soil
horizons are evident to a depth of approximately 7.6 m (25 ft) below grade. Below the karst zone,
the limestone becomes massive and crystallized with abundant calcite crystals.
The island does not have any well-defined watershed basins, and there are no significant year round
surface stream flows (although a few minor ephemeral streams flow during the wet season).
However, some drainage areas can be delineated that drain towards the sea. These drainage areas
are limited in extent and have low gradients with an average elevation of 16.0 m (52.5 ft) above sea
level. The most important drainage area is by Stuart Hill, along the road that leads to the municipal
dumping site.
A hand-dug canal, varying in depth from 0.6 to 3.7 m (2 to 12 ft) and in width from 1.5 to 4.6 m (5
to 15 ft), transects the island from the northwest to the southeast. According to local residents, the
canal is approximately 50 years old, and was constructed to provide fishermen a shorter route to the
northern coastal waters.
2.4 Hydrogeology
Fresh groundwater occurs beneath the island surface as a lens, which is recharged entirely by rainfall
and constrained at its lower and lateral boundaries by saline water. The rainfall infiltrates through the
soil and rock and accumulates above the denser seawater. As with many islands, the occurrence,
movement, and configuration of the freshwater lenses are affected largely by the permeability of
soils, fractured rock, topography, and the surrounding saline water. The upper land areas located in
the eastern portion of the island are believed to have the best potential to recharge precipitation
resulting in building groundwater storage and developing a freshwater lens. One of the objectives of
this study is to gain a better understanding of Utila’s hydrogeology. More detailed information
regarding Utila’s hydrogeology is presented in Chapter 4.
26. Groundwater Resources Monitoring Report and Management Plan
Utila, Honduras
Page 2-5
P:2100021143ReportUtila ReportFINAL GW Report-Utila.doc
2.5 Land Use
Land uses on Utila consist of residential, commercial, and agricultural (some small farms with cattle,
sheep, and pigs). There are no significant industrial facilities on the island. Most commercial
facilities service Utila’s tourism (diving) industry. Almost all of Utila’s land is privately owned. Non-
inhabitated areas consist of mangrove swamps, fresh water savannahs, and dense tropical forests. A
new airport with a 1,500 m (4,921 ft) long paved runway was recently built in the northeast corner of
the island. More detailed land use information can be found in Fundación para el Desarrollo
Municipal’s (FUNDEMUN) Estrategia Participativa de Desarrollo Integral de Utila, Islas de la Bahia
Report (FUNDEMUN, 2000).
2.6 Summary of Past Studies
Several past studies have addressed the need to investigate Utila’s groundwater resources. This
section briefly summarizes these past studies.
In October 1993, Servicio Autonomo Nacional de Acueductos y Alcantarillados (SANAA)
conducted a hydrogeologic study of Utila. SANAA estimated that the aquifer's recharge potential
was between 25 and 40 percent of the total annual precipitation.
A water resources appraisal conducted by the United States Army Topographic Engineering Center
in 1996, identified Utila as “having fresh water that was scarce or lacking” and “the groundwater on
Utila occurs as a lens above the saline water” (US Army, 1996).
A hydrogeologic map of Honduras prepared in 1996 states that aquifer production on the Honduran
islands is poor due to the small recharge areas. The study states that Utila is the smallest island in
the sector and fresh water surface flows do not exist in the summer. Groundwater production is
limited to 4 liters per second (lps) (1.1 gallons per second(gps)) (Instituto Geografico Nacional,
1996).
A 1998 study by Steven Bond for Water For People provided recommendations to conduct a water
budget study for the Bay Islands. The study states that Utila’s water supply is scarce and poorly
understood. Long-time residents report that the water quality varies throughout the year and has
steadily decreased over the past two decades (Bond, 1998).
A 2000 study conducted by FUNDEMUN presents population and tourism projections and
provides a brief description of the existing water system.
A water supply improvement design prepared by Black and Veatch, an engineering firm, in 2000
located potential sites for production wells and made assumptions regarding well flow rates. This
project has not yet been constructed. As discussed later in this report, there is not adequate
groundwater supply to implement this design.
27. Groundwater Resources Monitoring Report and Management Plan
Utila, Honduras
Page 2-6
P:2100021143ReportUtila ReportFINAL GW Report-Utila.doc
There is currently an ongoing program called the Environmental Management Program of the Bay
Islands, known as PMAIB, that is being conducted by the Honduran government. This program is
designed to the environmental quality that provides the basis for sustainable development of the Bay
Islands.
2.7 Wastewater Management
An understanding of wastewater management is important because certain disposal practices can
impact groundwater quality. There is no central wastewater collection and treatment system in Utila.
All wastewater is discharged directly to the sea or into non-engineered, private septic systems that
discharge directly into the subsurface soils. In addition, some residences and commercial
establishments discharge washwater directly onto the ground, which drains along streets.
2.8 Regulatory Setting
The water system in Utila is owned by the muncipality. SANAA is an autonomous Honduran
governmental entity that operates the urban water and waste water systems for Tegucigalpa and 15
other municipalities. SANAA currently provides technical support to Utila, but does not have any
jurisdiction over Utila’s water system.
The water systems in Honduras are regulated by the Honduran Ministry of Health. The drinking
water standards in Honduras are equivalent to standards defined by the World Health Organization
(WHO). Currently, drinking water standards are not enforced and water compliance monitoring and
reporting are not required in Honduras.
The Pan-American Health Organization (PAHO) provides technical support through the Ministry
of Health. Some other regional organizations have been formed in Central America to share
experiences in water and sanitation management.
28. P:2100021143ReportUtila ReportFINAL GW Report-Utila.doc
3.0 DESCRIPTION OF EXISTING WATER SYSTEM AND WATER DEMANDS
This chapter describes the existing water supply system and municipal water demands in Utila. The
information was obtained from reports prepared by others, discussions with municipal
representatives, and our field reconnaissance.
3.1 Municipal Water Supply and Distribution System
Utila’s primary water system is owned and operated by the municipality of Utila. The water system
is supplied completely by groundwater. Some residents in East Harbor use private wells and collect
rainfall as a supplementary water supply. Features and capacities of municipal and private wells,
reservoirs, and the distribution system are also described in this section. Figure 3-1 depicts the
locations of the main water system facilities.
3.1.1 Service Area. There are two communities located on Utila. The primary water system
provides water to the community of East Harbor. The community of Los Cayitos, located on
Pigeon and Jewel Cays, currently does not have a municipal water system. A well is located near
Pigeon Cay on the main island.
3.1.2 Water Supply Wells. Groundwater is the only source of municipal water supply. The
municipal wells and private wells are described in this section. Details on the water supply wells can
be found in the Water Resources Management System included with this report and described in
Section 5.0.
3.1.2.1 Municipal Water Supply Wells. Four municipal wells (MW) provide the municipal water
supply for East Harbor. Three of the wells are located by the soccer/baseball field and are drilled
wells equipped with submersible pumps. These three wells pump to the nearby elevated storage
tank that is connected to the distribution system, and they pump with a combined capacity of
approximately 238.5 liters per minute (lpm) (63 gpm). A fourth well is an old hand-dug well where
water is withdrawn by hand. There is no treatment including no disinfection of the well water prior
to distribution. Most residents use bottled water from local private treatment plants for drinking
purposes. Table 3-1 summarizes pertinent information about the existing wells. Well locations are
shown on Figure 3-1, photographs of the municipal wells are shown on Figure 3-2, and the fourth
municipal well is pictured on Figure 3-3.
Table 3-1. Municipal Well Information
Capacity W elldepth Depth to water Drawdown Rem arks
Nam e lpm gpm m bgs ftbgs m bgs ftbgs m ft
M W 1 83.3 22 16.1 53.0 13.4 44.1 0.02 0.07 Serves EastHarbor
M W 2 79.5 21 16.6 54.6 14.8 48.5 0.08 0.26 Serves EastHarbor
M W 3 75.7 20 17.4 57.0 14.9 48.9 0.02 0.06 Serves EastHarbor
Old Indian W ell 2.5 8.3 2.2 7.2 M anualaccesswellnotconnected to
distribution system . Hand-dugwell.
M W Cay 0.8 2.5 0.4 1.4 M anualaccesswelllocated in Pigeon
Cay. Is notconnected to distribution
system .
Total 238.5 63 -- -- -- -- -- --
lpm = liters perm inute m bgs = m eters below ground surface
gpm = gallons perm inute ftbgs= feetbelow ground surface
29. DATE
PROJECT
SITE
TITLE
FIGURE
3-1
11/5/01
21143
Utila, Bay Islands, Honduras
Existing Water System
$T
$T $T
$T
$T $T$T$T$T$T$T
$T$T
$T
$T$T$T
$T
$T
$T
$T$T
$T
$T$T $T$T
$T
$T
$T$T
$T$T
#S
#S#S
#S
Ë
MW 3
Old Indian Well
MW 2
MW 1
$T#S
MW Cay
N
$T
#S
Ë
Private Water Wells
Municipal Water Wells
Municipal Distribution Pipeline, 4 inch
Municipal Storage Tank
Municipal Distribution Pipeline, 6 inch
N
Los Cayos
400 0 400 Meters
300 0 300 Meters
30. Groundwater Resources Monitoring Report and Management Plan
Utila, Honduras
Page 3-3
P:2100021143ReportUtila ReportFINAL GW Report-Utila.doc
The three municipal supply wells located by the soccer/baseball field are situated within 46 m
(150 ft) of each other. It is estimated that the wells are at an elevation of approximately 17 m (55 ft)
above sea level. Each well consists of a 305 m (12 in) diameter outer polyvinyl chloride (PVC)
casing and a 31.8 mm (1¼ in) diameter inner PVC casing. The 305 m (12-in) diameter upper PVC
casings are not sealed. Water is pumped from each well by an electric, one-horsepower, submersible
pump. Electrical power for these pumps is provided by the island’s power plant, which consists of
three diesel generators that operate from 6:00 a.m. to 12:00 p.m. Water is pumped through a 31.8
mm (1¼ in) diameter PVC discharge line from each well. These three pipes converge into a 31.8
mm (1¼ in) diameter PVC well transmission line that discharges over the top of the tank’s sidewall.
The wellhead for MW 1 is covered by a 0.6 m by 0.6 m (2 ft by 2
ft) wooden slab, and the wellheads for MW 2 and MW 3 are
covered by a removable 0.6 m by 0.6 m (2 ft by 2 ft) square
concrete slab. Inside the wellheads, the 305 mm (12-in) diameter
PVC casings are not sealed, or lined, offering no protection from
contaminants that could percolate from the surface.
Old Indian Well, a hand-dug manual access well, also serves East
Harbor. This well does not have a pump and is not connected to
the distribution system, as shown in Figure 3-3. Old Indian Well
is a brick lined vault 1.5 m by 1.5 m (5 ft by 5 ft) in length and
width, and 2.5 m (8.3 ft) deep. Residents collect water by
dropping buckets into the well and then transferring the water
into other containers to be carried home.
MW Cay, another manual access well, provides water for the
community of Pigeon Cay, and is located on the southwestern
side of the island. Residents typically come to the well by boat
and fill containers with water by hand. Figure 3-4 depicts MW
Cay.
Figure 3-2. Utila Municipal Wells – MW 1, MW 2, and MW 3.
Figure 3-3. Old Indian Well
Figure 3-4. MW Cay
31. Groundwater Resources Monitoring Report and Management Plan
Utila, Honduras
Page 3-4
P:2100021143ReportUtila ReportFINAL GW Report-Utila.doc
3.1.2.2 Private Water Supply Wells. Many of the residents of Utila have constructed their own
private wells to supplement the municipal water distribution system. It is estimated that over 100
private water supply wells provide supplemental water to residences and businesses. These wells do
not pump into the municipal distribution system. No filtration or disinfection occurs prior to using
the water from most private wells. Some of these wells supply water to small private treatment
plants prior to being bottled to sell locally. Table 3-2 summarizes the thirty-four private wells
accessible to Brown and Caldwell for monitoring. The yields of these private wells is not known.
Table 3-2. Private Well Information
W elldepth Depth to water
N am e m bgs ftbgs m bgs ftbgs W ellowner
PW 1 8.5 28
a
7.0 23
a
Jernigan Cooper
PW 2 11.7 38.5 10.8 35.4 Eric Rose
PW 3 8.9 29.1 8.3 27.3 M argaretBodden
PW 4 5.5 18
a b
Austen Bodden
PW 5 8.5 28
a b
W alterJam es
PW 6 9.8 32
a b
Julie Bernard
PW 7 8.8 29
a b
Dolores Cardona
PW 8 7.9 26
a
7.3 24
a
Cleygorn Angus
PW 9 6.7 22
a b
Charlie Ruby
PW 10 9.1 30
a b
M odesto Cooper
PW 11 3.7 12.1 2.2 7.1 G eorge G abourel
PW 12 7.0 23
a b
G eorge G abourel
PW 13 9.1 30
a b
W illHinds
PW 14 5.5 18
a b
TonyJam es
PW 15 5.5 18
a b
Dona W oods
PW 16 6.1 20
a b
Lealond W ilson Howell
PW 17 7.3 24
a b
AudleyBanks
PW 18 6.1 20
a b
W iney Banks
PW 19 16.3 53.5 16.0 52.6 Don Kerns
PW 20 1.2 4.0 0.8 2.5 ----
PW 21
b b
Johnnie Bodden
PW 22
b b
W ilfield Coburn
PW 23
b b
W ilfield Coburn
PW 24
b b
Rosalee Lions
PW 25
b b
M itchellRose
PW 26
b b
Henry Hill
PW 27
b b
Felix Ponce
PW 28
b b
M ango Inn
PW 29
b b
JohnyHinds
PW 30
b b
Frank SpencerM organ
PW 31
b b
LarryThom pson
PW 32
b b
CJW oods
PW 33
b b
Selvin Bodden
PW 34
b b
Danny Hill
m bgs = m eters below ground surface
ftbgs= feetbelow ground surface
a
Notm easured.O wnersupplied inform ation.
b
Notknown
32. Groundwater Resources Monitoring Report and Management Plan
Utila, Honduras
Page 3-5
P:2100021143ReportUtila ReportFINAL GW Report-Utila.doc
3.1.3 Other Water Sources. Some Utila residents use rainwater collected in cisterns that are
constructed adjacent to their homes. In addition, some Utilian homes pump seawater for use in
toilets. Bottled water is often purchased for drinking purposes. Owners of newer houses located in
the higher areas have built cisterns to collect water from the municipal distribution system.
3.1.4 Water Storage Facilities. The municipal water system currently consists of one
94,640 liter (l) (25,000 gallon (gal)) water storage tank located on a hill near the three municipal water
supply wells at the soccer/baseball field. Water is pumped from the three municipal wells directly to
the tank through a manifolded 31.7 mm (1 ¼-in) diameter PVC pipeline. The location of the
storage tank is depicted on Figure 3-1.
In addition to the municipal water supply tank, an abandoned 136,270 to 151,420 l (36,000 to 40,000
gal) water tank is situated on Stuart Hill. This inactive tank is approximately 10 years old and is in a
state of disrepair. According to local residents, the buried PVC pipeline that connected this inactive
tank to the municipal system is still in place, however, Brown and Caldwell was not able to confirm
the presence of this line.
3.1.5 Piping System. The East Harbor distribution system consists of one pressure zone. Water
is gravity fed to the distribution system from the tank through a 102 mm (4 in) diameter PVC pipe.
The Utila piping system consists of approximately 3,775 m (12,385 ft) of 102 mm and 152 mm (4 in
and 6 in) diameter PVC piping. The majority of this pipe was
installed less than four years ago. Most distribution pipes and
house connections are uncovered and vulnerable to breakage, as
depicted in Figure 3-5. System pressures range from 6.4 and
10.6 kilograms per square inch (14.2 and 23.4 pounds per square
inch). The system is divided into three geographic service areas,
which are manually rotated on and off throughout the day by
the municipality.
3.2 Historical and Projected Water Demands
Water demand projections provide the basis for sizing and
staging future water facilities. Water use and production
records, combined with projections of residential population
and tourism, provide the basis for estimating future water
requirements. This section presents a summary of demographic
information, water use data, and the resulting projections of
future water needs for Utila.
3.2.1 Demographics. Demographic information consisting of population, housing, tourism,
commercial establishments, and water system connections are described in this section.
Figure 3-5. Utila Water
Distribution System
33. Groundwater Resources Monitoring Report and Management Plan
Utila, Honduras
Page 3-6
P:2100021143ReportUtila ReportFINAL GW Report-Utila.doc
3.2.1.1 Population and Housing. The majority of the island’s population lives on the east side of
the island in East Harbor, which has a 2001 population of approximately 6,100 residents distributed
throughout eleven neighborhoods. It is estimated that the population will increase to 12,221 by 2009
(FUNDEMUN). This growth represents an 8.6 percent average annual growth rate. It is assumed
this high growth rate will not be maintained over the long term. Assuming for this study that
growth is at only 50 percent of the projected rate, that being 4.3 percent per year after 2009, it is
estimated that the East Harbor population will increase to 19,612 by 2020.
Los Cayitos has a 2001 population of about 1,695 people. It is estimated that the Los Cayitos
population will increase to 3,255 in 2009 (FUNDEMUN). This growth represents a 7.6 percent
growth rate. Again, assuming that growth is at only 50 percent of the projected rate or at 3.8
percent per year after 2009, it is estimated that the Los Cayitos population will increase to 4,944 by
2020. The historical and projected population by neighborhood through 2009 is shown in
Table 3-3. The number of households within East Harbor and the average number of people per
household in 1999 are shown in Table 3-4. This table correlates well with Table 3-3.
Table 3-3. Population by Neighborhood from 1999 through 2009
Neighborhood 1999 2000 2001 2005 2009
La Punta 1,300 1,464 1,649 2,416 3,117
Sandy Bay 706 795 895 1,312 1,725
Colam ico 511 576 649 950 1,250
M am ey Lane 342 387 438 639 840
Barrio ElCentro 671 755 850 1,246 1,638
Holland 114 128 144 211 278
Cam ponado (North
and South)a
269 303 341 500 658
Lozano 529 596 671 983 1,293
La Lom a 558 628 707 1,036 1,363
Blue Bayou -- -- -- -- --
Los Cayitos
b
1,500 1,500 1,695 2,475 3,255
Total 6,500 7,132 7,825 11,768 15,476
1.Source: FUNDEM UN Para elDesarrollo M unicipal,M unicipalidad de Utila,USAID. Estrategia Participativa de Desarrollo
Integralde Utila,Islas de la Bahia,(Page 54,Table 7).
a
The neighborhoods ofCam ponado South and Cam ponado North are com bined in this table.
b
LosCayitosisnotcurrentlyconnected to the EastHarborm unicipalwatersystem .
Table 3-4. East Harbor Households by Neighborhood and
People per Household in 1999
Neighborhood Households People perhousehold Population
La Punta 189 6.9 1,304
SandyBay 105 6.7 704
Cola de M ico 152 3.4 517
M am ey Lane 75 4.6 345
Barrio ElCentro 77 8.7 670
Holland 95 1.2 114
Cam ponado 68 4.0 272
Lozano 194 2.7 524
La Lom a 27 20.7 559
Blue Bayou -- -- --
Total 982 5.1 5,009
1. Source: FUNDEM UN Para elDesarrollo M unicipal,M unicipalidad de Utila,USAID. Estrategia
Participativa de Desarrollo Integralde Utila,Islas de la Bahia.(Page 54,Table 7)
2. Los Cayitos is notincluded.
34. Groundwater Resources Monitoring Report and Management Plan
Utila, Honduras
Page 3-7
P:2100021143ReportUtila ReportFINAL GW Report-Utila.doc
3.2.1.2 Tourism. Tourism plays a moderate role in water demands in Utila. In the year 2001, there
were approximately 45,177 visitors to Utila (FUNDEMUN). The average length of stay per visitor is
estimated to be approximately 7.4 days. Visitor-days represents the number of visitors each year
multiplied by the average length of visit. Equivalent visitors is the number of permanent population
that would be equivalent to the number of visitors. This number is generated by dividing visitor-
days by 365 days per visitor. As shown in Table 3-5, tourism is expected to increase from 13,199
tourists in 1995 to 106,264 tourists by 2009 (FUNDEMUN). This represents an average annual
growth rate of 15 percent per year. For this study, it is assumed that tourism will grow at a slower
rate of 7.4 percent per year after 2009, and will reach 241,150 visitors by 2020. This equates to 4,889
equivalent visitors by 2020.
Table 3-5. Historical and Projected Visitors
Year Visitors
Average length
ofvisit,days per
visitor
Visitordaysa
,
days
Equivalent
visitorsb
1995 13,199 7.4 97,673 268
1996 15,179 7.4 112,325 308
1997 17,456 7.4 129,174 354
1998 20,075 7.4 148,555 407
1999 23,086 7.4 170,836 468
2000 37,541 7.4 277,803 761
2001 45,177 7.4 334,310 916
2005 75,720 7.4 560,328 1,535
2009 106,264 7.4 786,354 2,154
1. Source forvisitorsand length ofvisit: FUNDEM UN Para elDesarrollo M unicipal,M unicipalidad de
Utila,USAID. Estrategia Participativa de Desarrollo Integralde Utila,Islas de la Bahia.(Page 63,
Table 11)
2. a
Visitordaysrepresentsvisitorsperyearm ultiplied byaverage length ofvisitpervisitor.
3. b
Equivalentvisitorsrepresentsthe perm anentpopulation thatisequivalentto the num berofvisitors.
Calculated by dividing visitordays by 365 days/visitor.
The total actual and projected Utila population, which includes both residential population and
equivalent visitors is summarized in Table 3-6 and illustrated on Figure 3-6.
Table 3-6. Total Projected Population
Residentialpopulation
Year EastHarbor Los Cayitos Equivalenttourists Totalpopulation
1999 5,000 1,500 468 6,968
2000 5,632 1,500 761 7,893
2001 6,130 1,695 916 8,741
2005 9,293 2,475 1,535 13,303
2009 12,221 3,255 2,154 17,630
2015 15,818 4,089 3,368 23,275
2020 19,612 4,944 4,889 29,445
Note:Based on FUNDEM UN estim atesthrough 2009 and Brown and Caldwellestim ated growth rate from
2009 to 2020.
35. Groundwater Resources Monitoring Report and Management Plan
Utila, Honduras
Page 3-8
P:2100021143ReportUtila ReportFINAL GW Report-Utila.doc
0
5,000
10,000
15,000
20,000
25,000
30,000
35,000
1995 2000 2005 2010 2015 2020 2025
Year
Population
Figure 3-6. Historical and Projected Total Water Service Population
3.2.1.3 Commercial Establishments. An inventory of the number of commercial establishments
by business type that are located in the urban area of the East Harbor are shown in Table 3-7. The
majority of commercial and governmental activities are located in the El Centro neighborhood. The
remaining neighborhoods are predominantly residential with few commercial establishments
(FUNDEMUN).
Table 3-7. Commercial Establishments
Type Q uantity Type Q uantity
Travelagency 2 Dive schools 11
Bars 10 Stores (Ferreterias) 3
Realestate agency 3 G asstations 2
Boutiques 4 Hotels 23
Rentalhom es 26 Fruitstands 19
Cafeterias 3 Resorts 2
M ovie theaters 2 Restaurants 26
Dining room restaurants 4 SolaresBaldios 12
Cuarterias 14 Stores 6
Dance clubs 2 O thers 18
Fish M arket 1 Total 193
Source: FUNDEM UN Para elDesarrollo M unicipal,M unicipalidad de Utila,
USAID. Estrategia Participativa de Desarrollo Integralde Utila,Islas de la Bahia
(Page 19,Table 1).
36. Groundwater Resources Monitoring Report and Management Plan
Utila, Honduras
Page 3-9
P:2100021143ReportUtila ReportFINAL GW Report-Utila.doc
3.2.1.4 Connections. There are 160 active connections in the East Harbor municipal water system
(FUNDEMUN). The number of active connections by neighborhood is shown in Table 3-8. The
number of water system connections is less than the number of commercial establishments and
households in Utila. It has not been confirmed, but it is assumed that the number of registered
active connections is less than the total number of establishments and households due to the lack of
a strict municipal control on making connections to the system.
Table 3-8. Active Municipal Connections in 2000 by Neighborhood
Type Q uantity
La Punta 36
Sandy Bay 32
Colam ico --
M am ey Lane 13
Barrio elCentro 18
Holland 9
Cam ponado 4
Lozano 11
La Lom a 16
Blue Bayou --
Cola de M ico 21
Total 160
Source: FUNDEM UN Para elDesarrollo M unicipal,
M unicipalidad de Utila,USAID. Estrategia Participativa de
Desarrollo Integralde Utila,Islas de la Bahia.(Page 39,
Table 5)
3.2.2 Historical Water Use. Water production is the volume of water measured at the source,
which includes all water delivered to customers, as well as unaccounted-for water. This section
describes daily water production, maximum day demand, and unaccounted-for water.
Daily water production at MW 1, 2, and 3 is not known because water flow from the wellhead is not
metered. Daily water production is estimated to be 246,050 liters per day (lpd) (65,000 gallons per
day (gpd)), as described in Section 3.2.3.
Daily demand fluctuates throughout the year based primarily on seasonal climate changes. Water
demands are higher in the dry seasons and less in the wet season. System water production facilities
should be sized to meet the demand on the maximum day of the year, not just for the average day.
The maximum day peaking factor, which is defined as the one day of the highest water use during a
1-year period, divided by the annual average water use, is estimated to be 1.5 for the purposes of this
study. Since water production is not metered, the actual maximum day demand is not known.
Unaccounted-for water use includes lost water due to system leaks and unauthorized connections.
Since Utila’s system is not metered, data are unavailable for determining the percent of unaccounted-
for water.
37. Groundwater Resources Monitoring Report and Management Plan
Utila, Honduras
Page 3-10
P:2100021143ReportUtila ReportFINAL GW Report-Utila.doc
3.2.3 Unit Water Use. Unit water use factors expressed as liters per capita (or person) per day
(lpcd) (gallons per capita per day (gpcd)) are developed to estimate future water needs based on the
residential population and tourism projections discussed previously. The projected residential
population is combined with equivalent visitors and coupled with a unit water use factor per person
to estimate future water needs.
The FUNDEMUN report states that per capita water use in Utila is 83 lpcd (22 gpcd). Brown and
Caldwell’s field investigations conducted for this study indicate a per capita water use of 35 lpd
(9.2 gpcd). This is based on three wells pumping 75 liters per minute (lpm) (20 gallons per minute
(gpm)) each for 18 hours (245,295 lpd (64,800 gpd)/7,046 people) and factors in the East Harbor
population and tourists. This does not factor in the water pumped by private wells, which would
slightly increase the per capita water use. The Terms of Reference (TOR) for a separate USAID
project in Utila assumed a unit water use factor of 227 lpcd (60 gpcd) and recommends “four wells
producing 9 lps (144 gpm) each would be needed to support the Utila island area and two wells
producing 3 lps (50 gpm) would be needed to support the Cayos area” (USAID, 1999) for a total of
43 lps (676 gpm). Brown and Caldwell believes the TOR’s estimate to be high. For the purposes of
this study, it is assumed that per capita water use is 38 lpcd (10 gpcd).
3.2.4 Projected Water Demands. Water demands through the year 2020 were estimated based
on a unit water use factor of 38 lpcd (10 gpcd) and the residential population and equivalent tourist
projections (see Table 3-6). These water demand projections for East Harbor are shown in
Table 3-9 and illustrated on Figure 3-7. Annual water demands are expected to increase from
246,000 lpd (65,000 gpd) (73 acre-feet per year (ac-ft/yr)) in 2001 to 927,000 lpd (245,000 gpd)
(274 ac-ft/yr) in 2020. Impacts to water use due to any conservation measures implemented in the
future are not reflected in the projected water demands shown below.
Table 3-9. Projected Water Demands
Annualaverage M axim um daya
Year ac-ft/yr lpd gpd lpd gpd
2000 73 246,000 65,000 371,000 98,000
2005 121 409,000 108,000 613,000 162,000
2009 161 545,000 144,000 818,000 216,000
2015 215 727,000 192,000 1,080,000 288,000
2020 274 927,000 245,000 1,393,000 368,000
a
M axim um dayprojected waterdem and based on assum ed 1.5 m axim um daypeaking factor.
Note:Dem ands forEastHarboronly.
38. Groundwater Resources Monitoring Report and Management Plan
Utila, Honduras
Page 3-11
P:2100021143ReportUtila ReportFINAL GW Report-Utila.doc
0
50,000
100,000
150,000
200,000
250,000
300,000
350,000
400,000
2000 2005 2010 2015 2020 2025
Year
AverageDay Dem and M axim um Day Dem and
Figure 3-7. East Harbor Projected Water Demands
39. P:2100021143ReportUtila ReportFINAL GW Report-Utila.doc
4.0 GROUNDWATER RESOURCE EVALUATION
The groundwater resource evaluation for Utila consisted of the review and analysis of existing
geologic, hydrogeologic and groundwater resource information for the area. Following the initial
records review, a site reconnaissance of the area was conducted, followed by the development of a
conceptual model, and the performance of a field investigation which included drilling and testing of
three wells to explore deep hydrogeologic conditions in the valley. Following data collection and
interpretation, a numeric groundwater flow model was developed using data obtained during this
evaluation. This chapter presents the results of the groundwater evaluation at Utila. Training in
groundwater monitoring techniques was conducted for local staff, as described in Appendix G.
4.1 Conceptual Hydrogeologic Model
The initial conceptual model of Utila was developed as part of this study with the understanding that
infiltrating precipitation could develop a fresh water lens within the coral limestone extending into
the underlying volcanic units. This infiltrating precipitation would be less dense than the seawater
and create a zone or lens of freshwater on top of the underlying seawater. Recharge of precipitation
through the surface soils to the coral limestone would flow in a radial pattern from areas of higher
elevation on the island (i.e., Stuart Hill and Pumpkin Hill) displacing seawater and potentially
forming a usable potable water resource. The key driving force to maintain the zone of freshwater
would be the continual flux of water through the groundwater system from areas of recharge in the
hills to areas of discharge along the beaches. The sustainability of using this groundwater would be
dependent on the proper management of the groundwater withdrawals to minimize disruption of
the freshwater/seawater interface. The initial conceptual model is presented in Appendix A.
4.2 Field Investigation Program
Based on the conceptual model, the Stuart Hill area was selected as having the greatest probability of
providing sustainable groundwater supplies, and thus, the field investigation was focused in this area.
This area is characterized, as broad rolling hills comprised of breccia basalt, which is vegetated as
pasture land and dense vegetation. These factors give rise to the potential for significant recharge
and thus the possibility of sustainable groundwater supplies. As a result, the primary objective of
the field investigation was to determine whether a significant lens of fresh water exists beneath the
Stuart Hill area. The field investigation in this area consisted of the performance of a geophysical
survey, a fracture trace analysis, installation and testing of five wells, a water quality survey, and a
field reconnaissance of the island. This section summarizes the findings of these field investigations.
Appendix C presents the field investigation results in greater detail.
4.2.1 Geophysical Survey. Based on a review of island hydrogeology, the area with the highest
likelihood of identifying a significant fresh water lens was in the region of Stuart Hill where land is
mainly used for pasture. To evaluate this potential, a large-scale geophysical survey to help identify
fresh water was performed. The geophysical survey consisted of an electromagnetic (EM) survey to
evaluate subsurface resistivity. In general, because the electrical conductivity of fresh water is lower
than saline water, the reciprocal (resistivity) should be higher in areas where fresh water is present in
40. Groundwater Resources Monitoring Report and Management Plan
Utila, Honduras
Page 4-2
P:2100021143ReportUtila ReportFINAL GW Report-Utila.doc
the shallow aquifer system. However, the EM survey is limited to identifying the presence of fresh
water and does not quantify the volume of freshwater, or the long-term sustainability.
Multiple EM resistivity measurements were made around the Stuart Hill area and were evaluated to
produce resistivity contours. The results of the geophysical survey indicated a topographically high
ridge, which trends in a west-to-east direction across the study area. The enlarged vadose zone
associated with the ridge will contribute to lower terrain conductivity observed in this area. Also, a
possible zone of low specific conductance groundwater. During data acquisition, it was observed
that there was an absence of expressions of surface water runoff (stream beds, gullies, etc.) on both
the north and south sides of the ridge and associated down-slope regions. The absence of such
features may indicate a zone of more porous soil/rock. Finally, a contrast in rock type that may
exhibit lower terrain conductivity than the surrounding rock-type.
The results of the geophysical investigation identified a potential fresh water zone in the vicinity of
Stuart Hill and drilling locations were selected to correlate with these findings. The geophysical
survey report is included in Appendix B.
Once the geophysical survey was made, it was decided to locate the test wells within this area. Since
this land is privately owned, well location was limited to areas where landowners were willing to give
permission. In addition, the access for a drilling rig was limited. Taking into account all these
aspects, BCUT-1 and BCUT-2 were located in Morgan’s property by the road which goes to Jerico,
in the central part of the target area.
4.2.2 Fracture Trace Analysis. In the upland areas, Brown and Caldwell performed an
additional geologic evaluation to assess the potential for identifying areas of where the secondary
permeability of the coral limestone aquifer may be enhanced due to an increased fracture density.
To identify fracture sets and faults that may provide hydrologic conduits for fresh water infiltration
and migration, a lineation survey was conducted using air photos and topographic maps of the
eastern third of the island. Because Utila is covered by dense jungle flora, only a limited field
reconnaissance mapping survey was conducted to identify the surface representations of suspected
fracture locations.
In general, fracture sets were noted trending northeast (040°) and southwest (300°) and are believed
to be the surface trace of high angle normal faults within the coralline limestone, with vertical
displacement between 10- and 30-m, as depicted on Figure 4-1.
By comparison of the results of the fracture trace analysis with the geophysical survey, it was
believed proposed well locations (BCUT-3 and BCUT-4) would have the best opportunity to locate
a significant fresh water lens within the coral limestone. The combination of upland areas that
receive increased precipitation and high secondary permeability of the coral limestone would
promote the development of a freshwater lens. In addition, BCUT-3 and BCUT-4 were located
along the same fracture lineament to evaluate the interconnectedness of the fracture network. For a
long-term sustainable supply, it is necessary for the limestone fractures to be interconnected to
develop a larger water resource.
41. PROJECT TITLE
Utila Bay Islands, Honduras FIGURE
4-1
DATE
21143
2-12-02
SITE
Stuart Hill and Surrounding Area
42. Groundwater Resources Monitoring Report and Management Plan
Utila, Honduras
Page 4-4
P:2100021143ReportUtila ReportFINAL GW Report-Utila.doc
4.2.3 Well Installation. From August through October 2001, Brown and Caldwell conducted the
Phase II drilling investigation. The Phase II field investigation included the drilling of five test wells
(BCUT-1, BCUT-1A, BCUT-2, BCUT-3, and BCUT-4) in the Stuart Hill study area to determine
the presence, thickness, and quality of fresh water. The wells were located based on the results of
the geophysical survey and fracture trace analysis. The well locations are depicted in Figure 4-1.
Figure 4-2 depicts the drilling of one of the test wells. All wells were designed to be keyed
approximately 1.5 m (5 ft) into competent bedrock, and completed with PVC surface casing and
grouted with cement to the surface. These borings were located to provide a good lithological
description to understand the geological setting and to allow for aquifer testing. In addition, a
topographical survey was performed to determine the elevations of the test wells. Appendix C
describes each of the wells in greater detail.
All boreholes were drilled using reverse circulation
air/water/mud rotary methods by Servicios de
Perforación, S. de R. L. de C. Y. (SERPE), of
Tegucigalpa, Honduras, C.A. Drill cuttings in each
borehole were collected every 3 m (10 ft) for lithologic
control. A summary of the well construction
specifications is presented in Table 4-1. A copy of the
lithologic logs and well schematic diagrams are presented
in Appendix C. Figure 4-3 and Figure 4-4 depict the
geologic cross-sections through the area.
With the exception of well BCUT-1A, all boreholes were
completed with PVC surface conductor casing extending
through the volcanic clay, with open borehole to depth in
the underlying coral limestone. BCUT-1A was
completed as a monitoring well.
Table 4-1. Summary of Well Construction Specifications
W ellID
Total
depth,m
W ell
diam eter,cm
Blank casing
interval,m
Uncased
interval,m
Depth to
water,
m
Surface
elevation,
m
Date
com pleted
BCUT-1 32.0 15.24 0-26 26-32 17.84 17.30 9-3-01
BCUT-1A 21.3 7.62 0-1.5* 1.5-21.3* 16.75 17.30 9-20-01
BCUT-2 26.8 15.24 0-7.6 10.6-26.8 24.21 23.90 9-10-01
BCUT-3 36.3 15.24 0-10.6 10.6-36.3 26.64 26.14 10-4-01
BCUT-4 36.3 15.24 0-16.7 16.7-36.3 26.72 25.3 9-28-01
*= 3-inch PVC casing and screen,0.020”slot
Figure 4-2. Well Installation
43. PROJECT TITLE
Utila Bay Islands, Honduras FIGURE
4-3
DATE
21143
2-12-02
SITE
Cross-Section A-A’
44. PROJECT TITLE
Utila Bay Islands, Honduras FIGURE
4-4
DATE
21143
2-12-02
SITE
Cross-Section B-B’
45. Groundwater Resources Monitoring Report and Management Plan
Utila, Honduras
Page 4-7
P:2100021143ReportUtila ReportFINAL GW Report-Utila.doc
Water quality profiles were completed on each well using a YSI 650 XLS water parameter to
determine conductivity (microSiemens per centimeter (µS/cm)), pH, temperature (ºC), and,
dissolved oxygen (mg/L) of the water column. The results of this task are shown in Appendix C.
4.2.4 Aquifer Testing. Short term and long-term aquifer tests were performed on selected
monitoring wells to evaluate the water resource development potential. Very limited tests were
performed in Wells BCUT-1 and BCUT-2 because water quality deteriorated very rapidly after the
onset of pumping. A bailer test of BCUT-1A indicated that freshwater was present within the
surficial volcanic clay; however, well yields would likely be less than 18.9 lpm (5 gpm). Additionally,
the well yield of BCUT-3 was estimated to be too low for further testing based on similar bailer
draw down testing.
A 48-hour aquifer test was performed on Well BCUT-4. BCUT-4 was selected for the long-term
pumping test because information regarding the geology of this area indicated the potential for
significant well yield and total dissolved solids (TDS) concentrations were generally below 500
mg/L. During the test, the well maintained a flow rate of 151 lpm (40 gpm) for 48 hours with TDS
less than 1,000 mg/L. Less than 0.15 m (0.5 ft) of drawdown was noted in BCUT-4 during
pumping, however, TDS concentrations slowly increased during the test. A summary of the aquifer
tests is presented in Appendix C.
4.2.5 Water Quality Survey. A water quality survey was conducted for some existing wells and
the test wells installed for this study. Table 4-2 presents a summary of the water quality data. Only
some of the constituents with drinking water standards were included in the survey.
Table 4-2. Summary of Well Analytical Results
Analytical
constituent
Drinking water
standard
b
BC U T-1 BC U T-1A BC UT –2 BC UT -3 BC UT -4
Conductivity us/cm
e
11,330-11,590 415-1,202 782-1,024 810-8,467 772-1,454
pH -- 6.55-6.8 6.18-6.77 6.89-6.92 6.83-6.96 6.88-7.04
Arsenic 0.01 m g/l(P)
d
--
c
--
c
--
c
--
c
<0.005
Zinc 3 m g/l --
c
--
c
--
c
--
c
0.0773
Pesticides (range)
a
m g/l --
c
--
c
--
c
--
c
None detected
Herbicides (range)
a
m g/l --
c
--
c
--
c
--
c
None detected
Volatile
O rganics
(range)
a
ug/l --
c
--
c
--
c
--
c
None detected
Source: SPL Houston Laboratory and Jordanlab Laboratorio de Analysis Industrial laboratory results. Test dates vary.
Note: Numbers in bold are those over the drinking water standard.
UFC – must not be detectable in any 100 ml sample.
a Drinking water standard varies by individual constituent.
b World Health Organization, 1996. Guidelines for Drinking Water Quality, 2nd ed. Vol 2 Health criteria and other supporting information and
Addendum to Vol. 2, 1998.
c Lab reports not available/not tested for this constituent.
d(P) – provisional guidance value for constituents for which there is some evidence of a potential hazard but where the available information on health
effects is limited; or where an uncertainty factor greater than 1000 has been used in the derivation of the tolerable daily intake.
eNo drinking water standard.
Water quality surveys of existing wells performed by Brown and Caldwell found that water quality
on the island is generally poor with few wells producing significant quantities of water with
46. Groundwater Resources Monitoring Report and Management Plan
Utila, Honduras
Page 4-8
P:2100021143ReportUtila ReportFINAL GW Report-Utila.doc
estimated TDS concentrations less than 1,000 mg/L. The existing wells (MW 1, MW 2, and MW 3)
producing the higher quality water are likely deriving water from limited perched aquifer zones
within the surficial volcanic clays above the coral limestone. The average TDS concentration from
the existing municipal water supply wells is approximately 1,100 mg/L. Conductivity measurements
from wells in the Pumpkin Hill area found that TDS concentrations ranged from 1,300 mg/L to
9,152 mg/L. The lowest TDS values were measured in the Stuart Hill area and correlated well with
the results of the geophysical survey. Figure 4-5 depicts a map of the conductivity measurements.
Normal drinking water has a TDS range of 300 to 800 mg/L. Seawater has a TDS of approximately
32,000 mg/L. The recommended limit for TDS by the WHO is 500 mg/L, with a maximum of
1,500 mg/L. The degree of saltwater intrusion or salinity can be measured in terms of electrical
conductance or TDS. TDS is proportional to electrical conductance and conductance is
approximately 1.6 times greater than TDS concentration.
A water quality survey of existing hand-dug wells and springs outside the East Harbor area indicated
relatively poor groundwater, with few wells indicated conductivity measurements less than 1,000
µS/cm. Generally, the hand-dug wells are 1.2 to 1.5 m (4 to 5 ft) square with varying depth of 1.2 to
2.7 m (4 to 9 ft). Most of the wells visited are currently being used for livestock watering and
agricultural irrigation on a low scale. Four springs were identified, with conductivity measurements
ranging from 1,200 to >5,000 µS/cm. A summary of the water parameter measurements is
presented in Appendix C.
One groundwater sample was collected from well BCUT-4 and submitted to SPL Laboratories, in
Houston Texas, for analyses for several selected volatile organic compounds, chlorinated herbicides,
organochlorine pesticides, and metals. Analytical results indicate that no volatile organic
compounds, herbicides, or pesticides were detected. Other than zinc reported at a concentration of
0.0773 mg/L, no other metals were detected at concentrations above laboratory reporting limits or
above drinking water standards. The water quality test results are included in Appendix C.
4.2.6 Other Investigation Activities. Additionally, Big Bight Pond and the major canal were
investigated for the potential of fresh groundwater water recharging to these surface water bodies,
which would provide evidence of a potential freshwater lens in the vicinity of these areas. There
was no evidence of fresh surface or groundwater water entering either of these locations, nor was
there any change in vegetation from a mangrove swamp, which could indicate a change in water
quality. Nine locations throughout the canal, CA 1 through CA 9, and several within Big Bight
Pond, primarily on the western shoreline, were sampled for conductivity. The readings at each of
the locations were greater than the maximum scale of the meter, indicating that fresh water was not
contributing to canal flow.
4.2.7 Field Investigation Results. In summary, the well investigation indicates that the shallow
subsurface is comprised of a low permeability, volcanic clay-dominated soil that overlies a coralline
limestone. This low permeability volcanic clay, which is visually pervasive on the majority of the
island, is believed to limit vertical infiltration of precipitation. Beneath the clay soil is a coral
limestone unit that possesses highly variable permeability, depending on the degree of fracturing or
47. PROJECT TITLE
Utila Bay Islands, Honduras FIGURE
4-5
DATE
21143
2-12-02
SITE
Conductivity Map
48. Groundwater Resources Monitoring Report and Management Plan
Utila, Honduras
Page 4-10
P:2100021143ReportUtila ReportFINAL GW Report-Utila.doc
solution cavities. The results of a hydrogeologic study conducted by SANAA in 1993 indicated that
the recharge potential of the aquifer in Utila was between 25 to 40 percent of total annual
precipitation. The results of this field investigation indicate the weathered volcanic clay soils impede
percolation of precipitation to the freshwater lens much more than previously thought. Of the
2.4 m (7.9 ft) of precipitation that falls on the island of Utila each year, it is estimated that only 2.5
percent recharges the fresh groundwater aquifer system.
Fresh groundwater beneath Utila occurs as lenses bounded by saline intrusive from the surrounding
Caribbean Sea, and is recharged from annual precipitation during the wet season from October
through January. The occurrence and movement of groundwater and the limits of the fresh water
lens, is constrained by topography and subsurface geology. The water level elevations in BCUT-1
through BCUT-4 were calculated to be comparable to mean sea level elevation. These elevations
correspond to 26 m (85 ft) below grade in the vicinity of BCUT-4 and to 16 m (52 ft) below grade in
the lower lying areas in the vicinity of wells BCUT-1 and 1A.
Two basin areas that collect water during the rainy season were identified by local residents. One
basin is located in the Stuart Hill study area and the other near Pumpkin Hill (Figure 4-1). However,
the volcanic clay impedes significant infiltration in these areas into the underlying aquifer, most
being lost to evaporation. Throughout the field investigation, field water quality parameter
measurements were collected at various times to determine tidal influences to groundwater levels
and conductivity values. Hydrographs indicate a slight variation with water levels and quality over
time, however there does not appear to be a significant influence from tidal forces (Appendix C).
In general, field conductivity measurements collected from the test wells and existing water supply
wells show decreasing water quality with depth. The evaluation of the lithology, water level
elevations, and water quality measurements support that the amount of precipitation recharge is
limited, that fracture flow within the limestone is likely inhibited by the presence of clays, and that a
significant fresh water lens is not likely present in the lower elevation portions of the island.
4.3 Results of Numeric Groundwater Model
The objective of the numerical groundwater model for the island was to assess the sustainability of
future groundwater supply development to meet the needs of forecasted population growth. The
numerical model was developed from information derived from previous studies performed on the
island and recent field investigations. Results of the field investigation conducted for this project
show that saline water underlies a thin lens of freshwater beneath the eastern portion of the island.
A small-localized zone of freshwater northeast of Stuart Hill was identified surrounding well
BCUT-4. A numerical groundwater flow model was prepared to simulate limited groundwater
production of this water source. The development of the groundwater flow model focused on
evaluating the sustainability of the limited area of fresh water as a means to meet short-term water
supply demands. The model simulated pumping from one well at a rate of 90 lpm (24 gpm) for one
year.