SlideShare ist ein Scribd-Unternehmen logo
1 von 4
Downloaden Sie, um offline zu lesen
AP Statistics                                                Name

                        Why Should np and n(1-p) Be ≥ 10?

A mayoral candidate is interested in what proportion (p) of a large city’s population is planning to
vote for him. Consider our population to be all registered voters in the city. A statistically minded
member of his staff plans to take a simple random sample of all registered voters in the city and get
an estimate of this population proportion.
Once a sample proportion of those who favor the candidate is obtained, performing a One-
Proportion Z-Interval would be a common statistical method to use. This handout examines one
of the conditions required for using that interval and what goes wrong when that condition is
violated.
The condition this handout will examine is the following (n represents the sample size and p
represents the proportion of the population with the desired characteristic).

                      When constructing a One-Proportion Z-Interval,
                            np and n (1- p) should each be ≥ 10.

Of course, if you are constructing an interval, then you do not know p (if you knew p, there would
be no reason to construct the interval). Our best check of this condition, then, is to use the sample
            ˆ
proportion, p , to check this condition.

What happens when the above condition is violated? What exactly goes wrong? We will simulate
to find out.

VIOLATE THE CONDITION…BUT STILL CONSTRUCT THE INTERVAL

Assume that only 10% of all registered voters in the city plan to vote for the mayoral candidate,
and his staff takes a simple random sample of 20 voters. Thus, n = 20 and p = 0.1 (and np = 2).
You will simulate the process of sampling from this population, then you will make a confidence
interval, and then determine if your interval captures the value of p assumed.

   1. In your StatsApp, run the program SAMPLING. Using the
      values n = 20 and p = 0.1, simulate a sample and write down
      how many successes (voters who favor the candidate) you
      obtained. One result of running this program is given at
      right. (When the program ends, press ENTER to access a
      menu of options.)


   2. Use 1- Pr o pZ Int on your calculator (found by going to
      STA T : TE S TS - A : 1 - Pr o pZint ) to construct a 95%
      confidence interval based on the number of voters in the
      sample who favor the candidate. The 95% confidence
      interval for having 4 successes out of 20 voters is given at
      right. This interval captures p = 0.1 Does yours?
Since p = 0.1 was assumed to be the population proportion, we would hope that all our intervals
would capture 0.1. However, we constructed a 95% confidence interval, which means that we
would expect that in the long run 95% of all intervals constructed in the same manner to capture
0.1 and 5% to not capture 0.1. The thrust of this handout is the following:

               Suppose the np ≥ 10 and n (1- p) ≥ 10 conditions are violated.
                Do 95% confidence intervals still perform as advertised?

One way to determine if in fact the long run proportion of 95% confidence intervals that capture
p = 0.1 is actually 95% is to simulate more intervals.

SIMULATING MORE INTERVALS

   3. Run program SAMPLING again. Use n = 20 and p = 0.1 and generate the results for 10
      different samples. Record the number of voters who favor the candidate in the table below.

                Sample          1     2     3     4     5      6     7    8     9    10
          Number of Voters
          Favoring Candidate
           Does the interval
             capture 0.1?

   4. For each of the 10 samples above, make a 95% confidence interval using 1- Pr o pZ Int .
      Check whether or not each interval captures 0.1 and fill in the above table.

   5. Combine your results with your classmates. What percentage of all the computed 95%
      confidence intervals captured p = 0.1? Comment on how this percentage compares to the
      method’s stated 95% confidence level.


SIMULATING MANY MORE INTERVALS

Of course, simulating even more intervals would give us a better
estimate of the actual “capture rate” for 95% confidence intervals
when n = 20 and p = 0.1.

In your StatsApp, run the program CONFSIML and simulate 100
confidence intervals with n = 20 and p = 0.1. A picture of the
program in progress is given at right.

   6. What percentage of your 100 intervals captured p = 0.1? Combine your results with your
      classmates. How do your results compare to the stated 95% confidence level?
CONSEQUENCES OF VIOLATING THE CONDITION

On the previous page, you most likely found that the percentage of your 100 intervals that captured
p = 0.1 was less than 95%. In fact, the actual capture rate for 95% confidence intervals when
n = 20 and p = 0.1 is only 87.6%. Thus, for this particular combination of n and p, the 95%
confidence interval method will not perform as advertised!

This is why we check the conditions np ≥ 10 and n(1- p) ≥ 10. If either of these conditions is not
true, we run the severe risk of constructing a confidence interval that does not match the method’s
stated confidence level.

   7. The table below lists actual confidence interval capture percentages for various
      combinations of n and p. Circle the values for which the conditions np ≥ 10 and
      n(1- p) ≥ 10 are met.

                                      95% Confidence Interval Capture Percentages
                                         for different combinations of n and p

       0.9      65.0%         87.6%            80.9%          91.4%         87.9%     …   94.3%


       0.8      88.6%         92.1%            94.6%          90.5%         93.8%     …   94.9%


       0.7      84.0%         94.7%            95.3%          93.0%         93.5%     …   94.9%


       0.6      89.9%         92.8%            93.5%          94.6%         94.1%     …   95.0%


  p    0.5      89.1%         95.9%            95.7%          91.9%         93.5%     …   94.6%


       0.4      89.9%         92.8%            93.5%          94.6%         94.1%     …   95.0%


       0.3      84.0%         94.7%            95.3%          93.0%         93.5%     …   94.9%


       0.2      88.6%         92.1%            94.6%          90.5%         93.8%     …   94.9%


       0.1      65.0%         87.6%            80.9%          91.4%         87.9%     …   94.3%


                  10            20              30             40                50   …   500

                                                          n

   8. Comment on how the confidence interval capture rate varies for various values of n and p.
ARE THERE OTHER OPTIONS?

As you have seen, the traditional One-Proportion Z-Interval usually does not perform as promised
when the conditions np ≥ 10 and n(1- p) ≥ 10 are violated. In fact, there are times when the
interval does not perform as advertised even when the conditions are satisfied – you may have
noticed some of these instances in the table you just examined.
Statisticians are well aware of the deficiencies of the traditional One-Proportion Z-Interval and
have come up with alternative interval making procedures to more closely match the claimed
confidence level. One method adds 2 to the number of successes in the sample and 2 to the
number of failures in the sample to obtain an adjusted value for the sample proportion that is given
                     x+2
by the formula p =!                                                             !
                           where x is the number of successes. This value of p is then used instead
                     n+4
    ˆ
of p in the traditional One-Proportion Z-Interval. Using this adjusted sample proportion gives
capture percentages that more closely match the advertised confidence level.

The table at right gives the                               USING THE ADJUSTED SAMPLE PROPORTION

coverage percentages for                                    95% Confidence Interval Capture Percentages
                                                               for different combinations of n and p
various combinations of n
and p using the adjusted         0.9    93.0%      95.7%            97.4%           95.8%              97.0%   …   95.6%

sample proportion.
                                 0.8    96.7%      95.6%            96.4%           94.9%              95.1%   …   95.0%


9. Circle the capture            0.7    95.3%      97.5%            95.1%           94.4%              95.7%   …   95.5%
   percentages that are
   greater than or equal to      0.6    98.2%      96.3%            96.2%           96.6%              94.1%   …   95.0%

   95%.
                                 0.5    97.9%      95.9%            95.7%           96.2%              93.5%   …   94.6%


   (Note this method is still    0.4    98.2%      96.3%            96.2%           96.6%              94.1%   …   95.0%

   not perfect…but it is an
   improvement.)                 0.3    95.3%      97.5%            95.1%           94.4%              95.7%   …   95.5%


                                 0.2    96.7%      95.6%            96.4%           94.9%              95.1%   …   95.0%


                                 0.1    93.0%      95.7%            97.4%           95.8%              97.0%   …   95.6%


                                         10         20               30              40                 50     …   500
                                                                                n


There is an applet, written by statisticians Beth Chance and Allan Rossman, which simulates the
making of confidence intervals for any confidence level and any combination of n and p. It is ideal
for further exploration of this issue and can be found at the following address:

                  http://www.rossmanchance.com/applets/Confsim/Confsim.html

The traditional One-Proportion Z-Interval is named the “Wald” interval in the applet. The method
       !
using p is named the “Adjusted Wald” interval. It is interesting to experiment with different
values of n and p for each type of interval.

Weitere ähnliche Inhalte

Was ist angesagt?

Mca admission in india
Mca admission in indiaMca admission in india
Mca admission in indiaEdhole.com
 
Confidence Level and Sample Size
Confidence Level and Sample SizeConfidence Level and Sample Size
Confidence Level and Sample SizeEmilio Fer Villa
 
05 confidence interval & probability statements
05 confidence interval & probability statements05 confidence interval & probability statements
05 confidence interval & probability statementsDrZahid Khan
 
Bca admission in india
Bca admission in indiaBca admission in india
Bca admission in indiaEdhole.com
 
Chapter 06
Chapter 06Chapter 06
Chapter 06bmcfad01
 
Odds ratio and confidence interval
Odds ratio and confidence intervalOdds ratio and confidence interval
Odds ratio and confidence intervalUttamaTungkhang
 
RSS Hypothessis testing
RSS Hypothessis testingRSS Hypothessis testing
RSS Hypothessis testingKaimrc_Rss_Jd
 
Estimation&ci (assignebt )
Estimation&ci (assignebt )Estimation&ci (assignebt )
Estimation&ci (assignebt )Mmedsc Hahm
 
04 performance metrics v2
04 performance metrics v204 performance metrics v2
04 performance metrics v2Anne Starr
 
Chapter 7 – Confidence Intervals And Sample Size
Chapter 7 – Confidence Intervals And Sample SizeChapter 7 – Confidence Intervals And Sample Size
Chapter 7 – Confidence Intervals And Sample Sizeguest3720ca
 
Probability distribution in R
Probability distribution in RProbability distribution in R
Probability distribution in RAlichy Sowmya
 
Chapter 07
Chapter 07Chapter 07
Chapter 07bmcfad01
 
RSS probability theory
RSS probability theoryRSS probability theory
RSS probability theoryKaimrc_Rss_Jd
 
Chapter 10
Chapter 10Chapter 10
Chapter 10bmcfad01
 

Was ist angesagt? (20)

Mca admission in india
Mca admission in indiaMca admission in india
Mca admission in india
 
Stats chapter 9
Stats chapter 9Stats chapter 9
Stats chapter 9
 
Confidence Level and Sample Size
Confidence Level and Sample SizeConfidence Level and Sample Size
Confidence Level and Sample Size
 
Stats chapter 10
Stats chapter 10Stats chapter 10
Stats chapter 10
 
Inferential statistics-estimation
Inferential statistics-estimationInferential statistics-estimation
Inferential statistics-estimation
 
05 confidence interval & probability statements
05 confidence interval & probability statements05 confidence interval & probability statements
05 confidence interval & probability statements
 
Bca admission in india
Bca admission in indiaBca admission in india
Bca admission in india
 
Chapter 06
Chapter 06Chapter 06
Chapter 06
 
Stats chapter 11
Stats chapter 11Stats chapter 11
Stats chapter 11
 
Odds ratio and confidence interval
Odds ratio and confidence intervalOdds ratio and confidence interval
Odds ratio and confidence interval
 
RSS Hypothessis testing
RSS Hypothessis testingRSS Hypothessis testing
RSS Hypothessis testing
 
Estimation&ci (assignebt )
Estimation&ci (assignebt )Estimation&ci (assignebt )
Estimation&ci (assignebt )
 
Z test
Z testZ test
Z test
 
04 performance metrics v2
04 performance metrics v204 performance metrics v2
04 performance metrics v2
 
Chapter 7 – Confidence Intervals And Sample Size
Chapter 7 – Confidence Intervals And Sample SizeChapter 7 – Confidence Intervals And Sample Size
Chapter 7 – Confidence Intervals And Sample Size
 
Probability distribution in R
Probability distribution in RProbability distribution in R
Probability distribution in R
 
Stats chapter 12
Stats chapter 12Stats chapter 12
Stats chapter 12
 
Chapter 07
Chapter 07Chapter 07
Chapter 07
 
RSS probability theory
RSS probability theoryRSS probability theory
RSS probability theory
 
Chapter 10
Chapter 10Chapter 10
Chapter 10
 

Ähnlich wie Why confidence intervals fail when sample sizes are too small

Lecture 5: Interval Estimation
Lecture 5: Interval Estimation Lecture 5: Interval Estimation
Lecture 5: Interval Estimation Marina Santini
 
Confidence Interval ModuleOne of the key concepts of statist.docx
Confidence Interval ModuleOne of the key concepts of statist.docxConfidence Interval ModuleOne of the key concepts of statist.docx
Confidence Interval ModuleOne of the key concepts of statist.docxmaxinesmith73660
 
- Aow-Aowf--,d--Tto o4prnbAuSDUJ_ pya.docx
- Aow-Aowf--,d--Tto o4prnbAuSDUJ_ pya.docx- Aow-Aowf--,d--Tto o4prnbAuSDUJ_ pya.docx
- Aow-Aowf--,d--Tto o4prnbAuSDUJ_ pya.docxmercysuttle
 
Normal and standard normal distribution
Normal and standard normal distributionNormal and standard normal distribution
Normal and standard normal distributionAvjinder (Avi) Kaler
 
lecture13MWF.pdflecture13MWF.pdflecture13MWF.pdf
lecture13MWF.pdflecture13MWF.pdflecture13MWF.pdflecture13MWF.pdflecture13MWF.pdflecture13MWF.pdf
lecture13MWF.pdflecture13MWF.pdflecture13MWF.pdfEmersonRosal1
 
Sampling methods theory and practice
Sampling methods theory and practice Sampling methods theory and practice
Sampling methods theory and practice Ravindra Sharma
 
Six Sigma Confidence Interval Analysis (CIA) Training Module
Six Sigma Confidence Interval Analysis (CIA) Training ModuleSix Sigma Confidence Interval Analysis (CIA) Training Module
Six Sigma Confidence Interval Analysis (CIA) Training ModuleFrank-G. Adler
 
Point and Interval Estimation
Point and Interval EstimationPoint and Interval Estimation
Point and Interval EstimationShubham Mehta
 
Sample Size Estimation
Sample Size EstimationSample Size Estimation
Sample Size EstimationNayyar Kazmi
 
Section 7 Analyzing our Marketing Test, Survey Results .docx
Section 7 Analyzing our Marketing Test, Survey Results .docxSection 7 Analyzing our Marketing Test, Survey Results .docx
Section 7 Analyzing our Marketing Test, Survey Results .docxkenjordan97598
 
Module 7 Interval estimatorsMaster for Business Statistics.docx
Module 7 Interval estimatorsMaster for Business Statistics.docxModule 7 Interval estimatorsMaster for Business Statistics.docx
Module 7 Interval estimatorsMaster for Business Statistics.docxgilpinleeanna
 
Lecture5 Applied Econometrics and Economic Modeling
Lecture5 Applied Econometrics and Economic ModelingLecture5 Applied Econometrics and Economic Modeling
Lecture5 Applied Econometrics and Economic Modelingstone55
 
How to compute for sample size.pptx
How to compute for sample size.pptxHow to compute for sample size.pptx
How to compute for sample size.pptxnoelmartinez003
 
Estimating population values ppt @ bec doms
Estimating population values ppt @ bec domsEstimating population values ppt @ bec doms
Estimating population values ppt @ bec domsBabasab Patil
 

Ähnlich wie Why confidence intervals fail when sample sizes are too small (20)

Chapter10 Revised
Chapter10 RevisedChapter10 Revised
Chapter10 Revised
 
Chapter10 Revised
Chapter10 RevisedChapter10 Revised
Chapter10 Revised
 
Lecture 5: Interval Estimation
Lecture 5: Interval Estimation Lecture 5: Interval Estimation
Lecture 5: Interval Estimation
 
Confidence Interval ModuleOne of the key concepts of statist.docx
Confidence Interval ModuleOne of the key concepts of statist.docxConfidence Interval ModuleOne of the key concepts of statist.docx
Confidence Interval ModuleOne of the key concepts of statist.docx
 
- Aow-Aowf--,d--Tto o4prnbAuSDUJ_ pya.docx
- Aow-Aowf--,d--Tto o4prnbAuSDUJ_ pya.docx- Aow-Aowf--,d--Tto o4prnbAuSDUJ_ pya.docx
- Aow-Aowf--,d--Tto o4prnbAuSDUJ_ pya.docx
 
Normal and standard normal distribution
Normal and standard normal distributionNormal and standard normal distribution
Normal and standard normal distribution
 
lecture13MWF.pdflecture13MWF.pdflecture13MWF.pdf
lecture13MWF.pdflecture13MWF.pdflecture13MWF.pdflecture13MWF.pdflecture13MWF.pdflecture13MWF.pdf
lecture13MWF.pdflecture13MWF.pdflecture13MWF.pdf
 
Sampling methods theory and practice
Sampling methods theory and practice Sampling methods theory and practice
Sampling methods theory and practice
 
Six Sigma Confidence Interval Analysis (CIA) Training Module
Six Sigma Confidence Interval Analysis (CIA) Training ModuleSix Sigma Confidence Interval Analysis (CIA) Training Module
Six Sigma Confidence Interval Analysis (CIA) Training Module
 
Point and Interval Estimation
Point and Interval EstimationPoint and Interval Estimation
Point and Interval Estimation
 
Sample Size Estimation
Sample Size EstimationSample Size Estimation
Sample Size Estimation
 
Section 7 Analyzing our Marketing Test, Survey Results .docx
Section 7 Analyzing our Marketing Test, Survey Results .docxSection 7 Analyzing our Marketing Test, Survey Results .docx
Section 7 Analyzing our Marketing Test, Survey Results .docx
 
Module 7 Interval estimatorsMaster for Business Statistics.docx
Module 7 Interval estimatorsMaster for Business Statistics.docxModule 7 Interval estimatorsMaster for Business Statistics.docx
Module 7 Interval estimatorsMaster for Business Statistics.docx
 
6. point and interval estimation
6. point and interval estimation6. point and interval estimation
6. point and interval estimation
 
Estimating a Population Proportion
Estimating a Population ProportionEstimating a Population Proportion
Estimating a Population Proportion
 
Estimating a Population Proportion
Estimating a Population ProportionEstimating a Population Proportion
Estimating a Population Proportion
 
Lecture5 Applied Econometrics and Economic Modeling
Lecture5 Applied Econometrics and Economic ModelingLecture5 Applied Econometrics and Economic Modeling
Lecture5 Applied Econometrics and Economic Modeling
 
Estimation
EstimationEstimation
Estimation
 
How to compute for sample size.pptx
How to compute for sample size.pptxHow to compute for sample size.pptx
How to compute for sample size.pptx
 
Estimating population values ppt @ bec doms
Estimating population values ppt @ bec domsEstimating population values ppt @ bec doms
Estimating population values ppt @ bec doms
 

Kürzlich hochgeladen

Presentation by Andreas Schleicher Tackling the School Absenteeism Crisis 30 ...
Presentation by Andreas Schleicher Tackling the School Absenteeism Crisis 30 ...Presentation by Andreas Schleicher Tackling the School Absenteeism Crisis 30 ...
Presentation by Andreas Schleicher Tackling the School Absenteeism Crisis 30 ...EduSkills OECD
 
A Critique of the Proposed National Education Policy Reform
A Critique of the Proposed National Education Policy ReformA Critique of the Proposed National Education Policy Reform
A Critique of the Proposed National Education Policy ReformChameera Dedduwage
 
The basics of sentences session 2pptx copy.pptx
The basics of sentences session 2pptx copy.pptxThe basics of sentences session 2pptx copy.pptx
The basics of sentences session 2pptx copy.pptxheathfieldcps1
 
Introduction to AI in Higher Education_draft.pptx
Introduction to AI in Higher Education_draft.pptxIntroduction to AI in Higher Education_draft.pptx
Introduction to AI in Higher Education_draft.pptxpboyjonauth
 
Interactive Powerpoint_How to Master effective communication
Interactive Powerpoint_How to Master effective communicationInteractive Powerpoint_How to Master effective communication
Interactive Powerpoint_How to Master effective communicationnomboosow
 
BASLIQ CURRENT LOOKBOOK LOOKBOOK(1) (1).pdf
BASLIQ CURRENT LOOKBOOK  LOOKBOOK(1) (1).pdfBASLIQ CURRENT LOOKBOOK  LOOKBOOK(1) (1).pdf
BASLIQ CURRENT LOOKBOOK LOOKBOOK(1) (1).pdfSoniaTolstoy
 
Mastering the Unannounced Regulatory Inspection
Mastering the Unannounced Regulatory InspectionMastering the Unannounced Regulatory Inspection
Mastering the Unannounced Regulatory InspectionSafetyChain Software
 
Industrial Policy - 1948, 1956, 1973, 1977, 1980, 1991
Industrial Policy - 1948, 1956, 1973, 1977, 1980, 1991Industrial Policy - 1948, 1956, 1973, 1977, 1980, 1991
Industrial Policy - 1948, 1956, 1973, 1977, 1980, 1991RKavithamani
 
microwave assisted reaction. General introduction
microwave assisted reaction. General introductionmicrowave assisted reaction. General introduction
microwave assisted reaction. General introductionMaksud Ahmed
 
How to Make a Pirate ship Primary Education.pptx
How to Make a Pirate ship Primary Education.pptxHow to Make a Pirate ship Primary Education.pptx
How to Make a Pirate ship Primary Education.pptxmanuelaromero2013
 
Kisan Call Centre - To harness potential of ICT in Agriculture by answer farm...
Kisan Call Centre - To harness potential of ICT in Agriculture by answer farm...Kisan Call Centre - To harness potential of ICT in Agriculture by answer farm...
Kisan Call Centre - To harness potential of ICT in Agriculture by answer farm...Krashi Coaching
 
Separation of Lanthanides/ Lanthanides and Actinides
Separation of Lanthanides/ Lanthanides and ActinidesSeparation of Lanthanides/ Lanthanides and Actinides
Separation of Lanthanides/ Lanthanides and ActinidesFatimaKhan178732
 
Z Score,T Score, Percential Rank and Box Plot Graph
Z Score,T Score, Percential Rank and Box Plot GraphZ Score,T Score, Percential Rank and Box Plot Graph
Z Score,T Score, Percential Rank and Box Plot GraphThiyagu K
 
CARE OF CHILD IN INCUBATOR..........pptx
CARE OF CHILD IN INCUBATOR..........pptxCARE OF CHILD IN INCUBATOR..........pptx
CARE OF CHILD IN INCUBATOR..........pptxGaneshChakor2
 
Software Engineering Methodologies (overview)
Software Engineering Methodologies (overview)Software Engineering Methodologies (overview)
Software Engineering Methodologies (overview)eniolaolutunde
 
Advanced Views - Calendar View in Odoo 17
Advanced Views - Calendar View in Odoo 17Advanced Views - Calendar View in Odoo 17
Advanced Views - Calendar View in Odoo 17Celine George
 
Organic Name Reactions for the students and aspirants of Chemistry12th.pptx
Organic Name Reactions  for the students and aspirants of Chemistry12th.pptxOrganic Name Reactions  for the students and aspirants of Chemistry12th.pptx
Organic Name Reactions for the students and aspirants of Chemistry12th.pptxVS Mahajan Coaching Centre
 
Contemporary philippine arts from the regions_PPT_Module_12 [Autosaved] (1).pptx
Contemporary philippine arts from the regions_PPT_Module_12 [Autosaved] (1).pptxContemporary philippine arts from the regions_PPT_Module_12 [Autosaved] (1).pptx
Contemporary philippine arts from the regions_PPT_Module_12 [Autosaved] (1).pptxRoyAbrique
 

Kürzlich hochgeladen (20)

Presentation by Andreas Schleicher Tackling the School Absenteeism Crisis 30 ...
Presentation by Andreas Schleicher Tackling the School Absenteeism Crisis 30 ...Presentation by Andreas Schleicher Tackling the School Absenteeism Crisis 30 ...
Presentation by Andreas Schleicher Tackling the School Absenteeism Crisis 30 ...
 
A Critique of the Proposed National Education Policy Reform
A Critique of the Proposed National Education Policy ReformA Critique of the Proposed National Education Policy Reform
A Critique of the Proposed National Education Policy Reform
 
The basics of sentences session 2pptx copy.pptx
The basics of sentences session 2pptx copy.pptxThe basics of sentences session 2pptx copy.pptx
The basics of sentences session 2pptx copy.pptx
 
Introduction to AI in Higher Education_draft.pptx
Introduction to AI in Higher Education_draft.pptxIntroduction to AI in Higher Education_draft.pptx
Introduction to AI in Higher Education_draft.pptx
 
Interactive Powerpoint_How to Master effective communication
Interactive Powerpoint_How to Master effective communicationInteractive Powerpoint_How to Master effective communication
Interactive Powerpoint_How to Master effective communication
 
BASLIQ CURRENT LOOKBOOK LOOKBOOK(1) (1).pdf
BASLIQ CURRENT LOOKBOOK  LOOKBOOK(1) (1).pdfBASLIQ CURRENT LOOKBOOK  LOOKBOOK(1) (1).pdf
BASLIQ CURRENT LOOKBOOK LOOKBOOK(1) (1).pdf
 
Mastering the Unannounced Regulatory Inspection
Mastering the Unannounced Regulatory InspectionMastering the Unannounced Regulatory Inspection
Mastering the Unannounced Regulatory Inspection
 
Industrial Policy - 1948, 1956, 1973, 1977, 1980, 1991
Industrial Policy - 1948, 1956, 1973, 1977, 1980, 1991Industrial Policy - 1948, 1956, 1973, 1977, 1980, 1991
Industrial Policy - 1948, 1956, 1973, 1977, 1980, 1991
 
microwave assisted reaction. General introduction
microwave assisted reaction. General introductionmicrowave assisted reaction. General introduction
microwave assisted reaction. General introduction
 
TataKelola dan KamSiber Kecerdasan Buatan v022.pdf
TataKelola dan KamSiber Kecerdasan Buatan v022.pdfTataKelola dan KamSiber Kecerdasan Buatan v022.pdf
TataKelola dan KamSiber Kecerdasan Buatan v022.pdf
 
How to Make a Pirate ship Primary Education.pptx
How to Make a Pirate ship Primary Education.pptxHow to Make a Pirate ship Primary Education.pptx
How to Make a Pirate ship Primary Education.pptx
 
Kisan Call Centre - To harness potential of ICT in Agriculture by answer farm...
Kisan Call Centre - To harness potential of ICT in Agriculture by answer farm...Kisan Call Centre - To harness potential of ICT in Agriculture by answer farm...
Kisan Call Centre - To harness potential of ICT in Agriculture by answer farm...
 
Separation of Lanthanides/ Lanthanides and Actinides
Separation of Lanthanides/ Lanthanides and ActinidesSeparation of Lanthanides/ Lanthanides and Actinides
Separation of Lanthanides/ Lanthanides and Actinides
 
Z Score,T Score, Percential Rank and Box Plot Graph
Z Score,T Score, Percential Rank and Box Plot GraphZ Score,T Score, Percential Rank and Box Plot Graph
Z Score,T Score, Percential Rank and Box Plot Graph
 
Código Creativo y Arte de Software | Unidad 1
Código Creativo y Arte de Software | Unidad 1Código Creativo y Arte de Software | Unidad 1
Código Creativo y Arte de Software | Unidad 1
 
CARE OF CHILD IN INCUBATOR..........pptx
CARE OF CHILD IN INCUBATOR..........pptxCARE OF CHILD IN INCUBATOR..........pptx
CARE OF CHILD IN INCUBATOR..........pptx
 
Software Engineering Methodologies (overview)
Software Engineering Methodologies (overview)Software Engineering Methodologies (overview)
Software Engineering Methodologies (overview)
 
Advanced Views - Calendar View in Odoo 17
Advanced Views - Calendar View in Odoo 17Advanced Views - Calendar View in Odoo 17
Advanced Views - Calendar View in Odoo 17
 
Organic Name Reactions for the students and aspirants of Chemistry12th.pptx
Organic Name Reactions  for the students and aspirants of Chemistry12th.pptxOrganic Name Reactions  for the students and aspirants of Chemistry12th.pptx
Organic Name Reactions for the students and aspirants of Chemistry12th.pptx
 
Contemporary philippine arts from the regions_PPT_Module_12 [Autosaved] (1).pptx
Contemporary philippine arts from the regions_PPT_Module_12 [Autosaved] (1).pptxContemporary philippine arts from the regions_PPT_Module_12 [Autosaved] (1).pptx
Contemporary philippine arts from the regions_PPT_Module_12 [Autosaved] (1).pptx
 

Why confidence intervals fail when sample sizes are too small

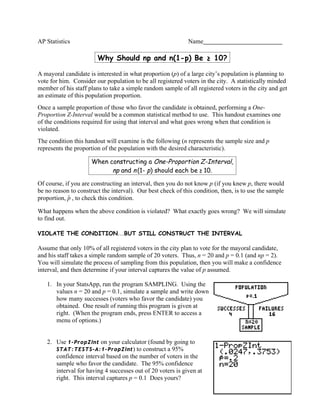
  • 1. AP Statistics Name Why Should np and n(1-p) Be ≥ 10? A mayoral candidate is interested in what proportion (p) of a large city’s population is planning to vote for him. Consider our population to be all registered voters in the city. A statistically minded member of his staff plans to take a simple random sample of all registered voters in the city and get an estimate of this population proportion. Once a sample proportion of those who favor the candidate is obtained, performing a One- Proportion Z-Interval would be a common statistical method to use. This handout examines one of the conditions required for using that interval and what goes wrong when that condition is violated. The condition this handout will examine is the following (n represents the sample size and p represents the proportion of the population with the desired characteristic). When constructing a One-Proportion Z-Interval, np and n (1- p) should each be ≥ 10. Of course, if you are constructing an interval, then you do not know p (if you knew p, there would be no reason to construct the interval). Our best check of this condition, then, is to use the sample ˆ proportion, p , to check this condition. What happens when the above condition is violated? What exactly goes wrong? We will simulate to find out. VIOLATE THE CONDITION…BUT STILL CONSTRUCT THE INTERVAL Assume that only 10% of all registered voters in the city plan to vote for the mayoral candidate, and his staff takes a simple random sample of 20 voters. Thus, n = 20 and p = 0.1 (and np = 2). You will simulate the process of sampling from this population, then you will make a confidence interval, and then determine if your interval captures the value of p assumed. 1. In your StatsApp, run the program SAMPLING. Using the values n = 20 and p = 0.1, simulate a sample and write down how many successes (voters who favor the candidate) you obtained. One result of running this program is given at right. (When the program ends, press ENTER to access a menu of options.) 2. Use 1- Pr o pZ Int on your calculator (found by going to STA T : TE S TS - A : 1 - Pr o pZint ) to construct a 95% confidence interval based on the number of voters in the sample who favor the candidate. The 95% confidence interval for having 4 successes out of 20 voters is given at right. This interval captures p = 0.1 Does yours?
  • 2. Since p = 0.1 was assumed to be the population proportion, we would hope that all our intervals would capture 0.1. However, we constructed a 95% confidence interval, which means that we would expect that in the long run 95% of all intervals constructed in the same manner to capture 0.1 and 5% to not capture 0.1. The thrust of this handout is the following: Suppose the np ≥ 10 and n (1- p) ≥ 10 conditions are violated. Do 95% confidence intervals still perform as advertised? One way to determine if in fact the long run proportion of 95% confidence intervals that capture p = 0.1 is actually 95% is to simulate more intervals. SIMULATING MORE INTERVALS 3. Run program SAMPLING again. Use n = 20 and p = 0.1 and generate the results for 10 different samples. Record the number of voters who favor the candidate in the table below. Sample 1 2 3 4 5 6 7 8 9 10 Number of Voters Favoring Candidate Does the interval capture 0.1? 4. For each of the 10 samples above, make a 95% confidence interval using 1- Pr o pZ Int . Check whether or not each interval captures 0.1 and fill in the above table. 5. Combine your results with your classmates. What percentage of all the computed 95% confidence intervals captured p = 0.1? Comment on how this percentage compares to the method’s stated 95% confidence level. SIMULATING MANY MORE INTERVALS Of course, simulating even more intervals would give us a better estimate of the actual “capture rate” for 95% confidence intervals when n = 20 and p = 0.1. In your StatsApp, run the program CONFSIML and simulate 100 confidence intervals with n = 20 and p = 0.1. A picture of the program in progress is given at right. 6. What percentage of your 100 intervals captured p = 0.1? Combine your results with your classmates. How do your results compare to the stated 95% confidence level?
  • 3. CONSEQUENCES OF VIOLATING THE CONDITION On the previous page, you most likely found that the percentage of your 100 intervals that captured p = 0.1 was less than 95%. In fact, the actual capture rate for 95% confidence intervals when n = 20 and p = 0.1 is only 87.6%. Thus, for this particular combination of n and p, the 95% confidence interval method will not perform as advertised! This is why we check the conditions np ≥ 10 and n(1- p) ≥ 10. If either of these conditions is not true, we run the severe risk of constructing a confidence interval that does not match the method’s stated confidence level. 7. The table below lists actual confidence interval capture percentages for various combinations of n and p. Circle the values for which the conditions np ≥ 10 and n(1- p) ≥ 10 are met. 95% Confidence Interval Capture Percentages for different combinations of n and p 0.9 65.0% 87.6% 80.9% 91.4% 87.9% … 94.3% 0.8 88.6% 92.1% 94.6% 90.5% 93.8% … 94.9% 0.7 84.0% 94.7% 95.3% 93.0% 93.5% … 94.9% 0.6 89.9% 92.8% 93.5% 94.6% 94.1% … 95.0% p 0.5 89.1% 95.9% 95.7% 91.9% 93.5% … 94.6% 0.4 89.9% 92.8% 93.5% 94.6% 94.1% … 95.0% 0.3 84.0% 94.7% 95.3% 93.0% 93.5% … 94.9% 0.2 88.6% 92.1% 94.6% 90.5% 93.8% … 94.9% 0.1 65.0% 87.6% 80.9% 91.4% 87.9% … 94.3% 10 20 30 40 50 … 500 n 8. Comment on how the confidence interval capture rate varies for various values of n and p.
  • 4. ARE THERE OTHER OPTIONS? As you have seen, the traditional One-Proportion Z-Interval usually does not perform as promised when the conditions np ≥ 10 and n(1- p) ≥ 10 are violated. In fact, there are times when the interval does not perform as advertised even when the conditions are satisfied – you may have noticed some of these instances in the table you just examined. Statisticians are well aware of the deficiencies of the traditional One-Proportion Z-Interval and have come up with alternative interval making procedures to more closely match the claimed confidence level. One method adds 2 to the number of successes in the sample and 2 to the number of failures in the sample to obtain an adjusted value for the sample proportion that is given x+2 by the formula p =! ! where x is the number of successes. This value of p is then used instead n+4 ˆ of p in the traditional One-Proportion Z-Interval. Using this adjusted sample proportion gives capture percentages that more closely match the advertised confidence level. The table at right gives the USING THE ADJUSTED SAMPLE PROPORTION coverage percentages for 95% Confidence Interval Capture Percentages for different combinations of n and p various combinations of n and p using the adjusted 0.9 93.0% 95.7% 97.4% 95.8% 97.0% … 95.6% sample proportion. 0.8 96.7% 95.6% 96.4% 94.9% 95.1% … 95.0% 9. Circle the capture 0.7 95.3% 97.5% 95.1% 94.4% 95.7% … 95.5% percentages that are greater than or equal to 0.6 98.2% 96.3% 96.2% 96.6% 94.1% … 95.0% 95%. 0.5 97.9% 95.9% 95.7% 96.2% 93.5% … 94.6% (Note this method is still 0.4 98.2% 96.3% 96.2% 96.6% 94.1% … 95.0% not perfect…but it is an improvement.) 0.3 95.3% 97.5% 95.1% 94.4% 95.7% … 95.5% 0.2 96.7% 95.6% 96.4% 94.9% 95.1% … 95.0% 0.1 93.0% 95.7% 97.4% 95.8% 97.0% … 95.6% 10 20 30 40 50 … 500 n There is an applet, written by statisticians Beth Chance and Allan Rossman, which simulates the making of confidence intervals for any confidence level and any combination of n and p. It is ideal for further exploration of this issue and can be found at the following address: http://www.rossmanchance.com/applets/Confsim/Confsim.html The traditional One-Proportion Z-Interval is named the “Wald” interval in the applet. The method ! using p is named the “Adjusted Wald” interval. It is interesting to experiment with different values of n and p for each type of interval.