Figure 34-2 Coal Paper Canada 6 tons 1 ton United States 4 tons 2 tons.docx
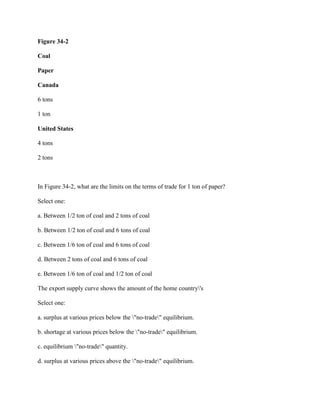
Figure 34-2 Coal Paper Canada 6 tons 1 ton United States 4 tons 2 tons In Figure 34-2, what are the limits on the terms of trade for 1 ton of paper? Select one: a. Between 1/2 ton of coal and 2 tons of coal b. Between 1/2 ton of coal and 6 tons of coal c. Between 1/6 ton of coal and 6 tons of coal d. Between 2 tons of coal and 6 tons of coal e. Between 1/6 ton of coal and 1/2 ton of coal The export supply curve shows the amount of the home country\'s Select one: a. surplus at various prices below the \"no-trade\" equilibrium. b. shortage at various prices below the \"no-trade\" equilibrium. c. equilibrium \"no-trade\" quantity. d. surplus at various prices above the \"no-trade\" equilibrium. e. shortage at various prices above the \"no-trade\" equilibrium. Solution The limits on the terms of trade for 1 ton of paper is e) Between 1/6 ton of coal and 1/2 ton of coal. This is because country canada can either produce one ton of paper or one ton of coal (1/6) and united states can produce either 2 tons of paper or four tons of coal (2/4 or 1/2). The export supply curve shows the amount of the home country\'s shortage at various prices below the no-trade equillibrium .

Empfohlen
Empfohlen
Weitere ähnliche Inhalte
Mehr von jkristen1
Mehr von jkristen1 (20)
Kürzlich hochgeladen
Kürzlich hochgeladen (20)
Figure 34-2 Coal Paper Canada 6 tons 1 ton United States 4 tons 2 tons.docx
- 1. Figure 34-2 Coal Paper Canada 6 tons 1 ton United States 4 tons 2 tons In Figure 34-2, what are the limits on the terms of trade for 1 ton of paper? Select one: a. Between 1/2 ton of coal and 2 tons of coal b. Between 1/2 ton of coal and 6 tons of coal c. Between 1/6 ton of coal and 6 tons of coal d. Between 2 tons of coal and 6 tons of coal e. Between 1/6 ton of coal and 1/2 ton of coal The export supply curve shows the amount of the home country's Select one: a. surplus at various prices below the "no-trade" equilibrium. b. shortage at various prices below the "no-trade" equilibrium. c. equilibrium "no-trade" quantity. d. surplus at various prices above the "no-trade" equilibrium.
- 2. e. shortage at various prices above the "no-trade" equilibrium. Coal Paper Canada 6 tons 1 ton United States 4 tons 2 tons Solution The limits on the terms of trade for 1 ton of paper is e) Between 1/6 ton of coal and 1/2 ton of coal. This is because country canada can either produce one ton of paper or one ton of coal (1/6) and united states can produce either 2 tons of paper or four tons of coal (2/4 or 1/2). The export supply curve shows the amount of the home country's shortage at various prices below the no-trade equillibrium