SlideShare ist ein Scribd-Unternehmen logo
1 von 6
Downloaden Sie, um offline zu lesen
Power BI Desktop
BSNL 38%
JIO 27%
24%
TATA 6% 1%
AIR…
RCOM
WIRELINE CMS
JIO 38%
AIRTEL 35%
22%
BSNL 6%
VODA-I…
WIRELESS VLR CMS
Wireless, Wireline & VRL Count and MoM Variation
OPERATOR Wireless Subs.
Count
Wireless
MoM Var.
Wireline Subs.
Count
Wireline
MoM Var.
Rank

Wireless VLR
Subs. Count
W. VLR
MoM Var.
W. VLR 3
Mths. Var.
W. VLR 6
Mths. Var.
W. VLR 12
Mths. Var.
JIO
AIRTEL
VODA-IDEA
BSNL
TATA
QUADRANT
RCOM
41,30,10,694
36,29,68,293
25,66,45,622
11,47,62,788
0
0
3,154
1.03%
0.22%
-0.70%
-1.14%
NaN
NaN
0.00%
69,76,912
60,28,614
6,71,308
98,34,039
15,86,221
2,98,440
1,69,468
3.57%
0.99%
14.45%
-0.49%
-0.52%
2.53%
-0.60%
1
2
3
4
5
6
7
38,27,42,359
35,47,17,611
21,86,12,535
5,84,24,963
0
0
2,412
0.02%
0.51%
-0.63%
-1.75%
NaN
NaN
-0.29%
1.03%
0.74%
-3.29%
-3.39%
NaN
NaN
-3.60%
5.05%
2.78%
-4.71%
0.47%
NaN
NaN
-8.64%
12.46%
4.28%
-9.54%
-1.00%
NaN
NaN
-61.89%
TOTAL 1,14,73,90,551 0.16% 2,55,65,002 1.32% 1 1,01,44,99,880 -0.05% -0.29% 1.75% 3.40%
CMS OVERVIEW
Year
2022


Month
June


Region
All


State
All


Trendline of VRL Subscribers - Operator Wise
VLR
Subscribers
0.0bn
0.1bn
0.2bn
0.3bn
0.4bn
2018 2020 2022
AIRTEL
BSNL
JIO
VODA-IDEA
CMS - Customer Market Share Var. - Variation
Subs. - Subscribers VLR - Visitor Location Register
JIO 36%
AIRTEL 32%
22%
BSNL 10%
VO…
WIRELESS CMS
• Dotted line in "Trendline of VRL Subscribers" chart represent the trend of the all VLR subscribers in the market.
• Operators have been ranked based on the Sum of the VLR Wireless & Wireline Subscribers.
MTNL have been grouped
together with BSNL
Year & Month filter is not
applicable to "Trendline of
VRL Subscribers" chart
Power BI Desktop
RMS OVERVIEW
Fiscal Year
22-23


Fiscal Qtr
Q1


Region
All


State
All


36%
JIO 31%
19%
BSNL 6%
O… 1%
AIRTEL
VODA-IDEA
RMS - GROSS REVENUE
Gross Revenue - Operator & License
0K 10K 20K
Gross Revenue [Crs.]
AIRTEL
JIO
VODA-IDEA
BSNL
TATA
OTHERS
ACT
SIFY
RAIL TEL
27K
24K
15K
5K
3K
1K
1K
0K
0K
ILD INTERNET MNP NLD PMRTS TELECOM VNO VSAT
JIO 36%
AIRTEL 35%
16%
BSNL 7% 3%0%
VO…
TATA BT
RMS - ADJUSTED G.R.
OPERATOR Gross
Revenue

G.R. QoQ
Var.
G.R. YoY
Var.
Adjusted
G.R.
A.G.R. QoQ
Var.
A.G.R. YoY
Var.
AIRTEL
JIO
VODA-IDEA
BSNL
TATA
OTHERS
ACT
SIFY
RAIL TEL
AT&T
27,186.75
23,770.88
14,718.99
4,711.74
2,792.94
971.88
521.60
298.54
219.82
216 22
3.57%
4.62%
2.88%
-34.30%
-0.56%
5.28%
-5.33%
-7.42%
-10.88%
11 00%
20.09%
21.93%
10.61%
6.26%
35.90%
11.89%
10.01%
8.82%
37.88%
13 42%
21,260.52
22,054.39
9,446.09
4,104.89
1,819.36
498.92
3.04
242.43
219.82
213 44
3.95%
4.41%
-1.82%
2.05%
1.39%
-4.68%
-55.81%
-4.28%
-10.88%
9 64%
19.54%
21.02%
9.16%
18.01%
35.02%
6.07%
-64.15%
5.12%
37.88%
13 69%
TOTAL 76,408.19 0.03% 17.91% 60,529.65 2.79% 17.91%
Bar Chart of Gross Revenue Time Series
0K
20K
40K
60K
80K
Gross
Revenue
[Crs]
2017 2018 2019 2020 2021 2022
72K
63K 65K 66K
61K 62K
58K 58K 59K 58K 58K 60K
64K
68K 67K 68K
72K
67K 65K 67K 70K
76K 76K ILD
INTERNET
MNP
NLD
PMRTS
TELECOM
VNO
Operator
All


• Operators with Gross Revenue Less than ₹100 Crs. have been grouped together as "OTHERS". MTNL is grouped with BSNL.
• Filters "Fiscal Year" & "Fiscal Qtr." are not applicable to "Bar Chart Gross Revenue Time Series" , Filter "Operator" is only applicable to this chart.
Power BI Desktop
CMS & RMS Trend Monthly/Quarterly
Customer Market Share Trend
OPERATOR 2021-08 2021-09 2021-10 2021-11 2021-12 2022-01 2022-02 2022-03 2022-04 2022-05 2022-06 2022-07
JIO
AIRTEL
VODA-IDEA
BSNL
MTNL
RCOM
QUADRANT
TATA
35.46%
34.79%
23.91%
5.78%
0.06%
0.00%
0.00%
0.00%
35.80%
34.64%
23.75%
5.75%
0.06%
0.00%
0.00%
0.00%
36.07%
34.56%
23.58%
5.73%
0.06%
0.00%
0.00%
0.00%
36.17%
34.76%
23.30%
5.71%
0.06%
0.00%
0.00%
0.00%
36.54%
34.61%
23.01%
5.77%
0.06%
0.00%
0.00%
0.00%
36.75%
34.54%
22.81%
5.85%
0.06%
0.00%
0.00%
0.00%
37.38%
34.34%
22.32%
5.90%
0.06%
0.00%
0.00%
0.00%
37.23%
34.61%
22.22%
5.88%
0.06%
0.00%
0.00%
0.00%
37.42%
34.67%
21.98%
5.86%
0.06%
0.00%
0.00%
0.00%
37.70%
34.77%
21.67%
5.80%
0.06%
0.00%
0.00%
0.00%
37.73%
34.96%
21.55%
5.70%
0.06%
0.00%
0.00%
0.00%
37.81%
34.98%
21.47%
5.67%
0.06%
0.00%
0.00%
0.00%
Total 100.00% 100.00% 100.00% 100.00% 100.00% 100.00% 100.00% 100.00% 100.00% 100.00% 100.00% 100.00%
Year
2022


Month
July


Region
All


State
All


Revenue Market Share Trend
OPERATOR 2019-09 2019-12 2020-03 2020-06 2020-09 2020-12 2021-03 2021-06 2021-09 2021-12 2022-03 2022-06
AIRTEL
JIO
VODA-IDEA
BSNL
TATA
OTHERS
ACT
SIFY
AT&T
31.77%
26.58%
27.26%
7.26%
3.24%
0.87%
0.51%
0.42%
32.38%
25.79%
27.01%
7.45%
2.95%
0.78%
0.70%
0.48%
0.47%
32.33%
25.80%
26.94%
7.77%
3.00%
0.80%
0.70%
0.42%
0.39%
32.69%
28.97%
24.47%
6.93%
2.95%
0.73%
0.73%
0.40%
0.42%
33.06%
29.94%
23.14%
7.00%
3.01%
0.66%
0.64%
0.41%
0.38%
33.61%
30.14%
22.72%
6.45%
2.83%
1.22%
0.64%
0.40%
0.39%
34.46%
28.16%
21.77%
7.73%
3.20%
1.30%
0.74%
0.42%
0.37%
34.93%
30.08%
20.54%
6.84%
3.17%
1.34%
0.73%
0.42%
0.39%
35.75%
30.17%
20.23%
6.02%
3.14%
1.60%
0.73%
0.44%
0.40%
34.85%
30.42%
19.90%
6.74%
3.66%
1.15%
0.72%
0.45%
0.29%
34.37%
29.74%
18.73%
9.39%
3.68%
1.21%
0.72%
0.42%
0.32%
35.58%
31.11%
19.26%
6.17%
3.66%
1.27%
0.68%
0.39%
0.28%
Total 100.00% 100.00% 100.00% 100.00% 100.00% 100.00% 100.00% 100.00% 100.00% 100.00% 100.00% 100.00%
Fiscal Y…
22-23


License
All


Operator
All


Fiscal Qtr
Q1


Power BI Desktop
Operator
Region
AIRTEL
VLR Subs. CMS MoM ~
BSNL
VLR Subs. CMS MoM ~
JIO
VLR Subs. CMS MoM ~
VODA-IDEA
VLR Subs. CMS MoM ~
Total
VLR Subs. CMS MoM ~
EAST

NORTH

SOUTH

WEST

8,47,42,765
11,90,01,228
9,54,93,373
5,54,80,245
39.0%
37.9%
39.1%
23.2%
0.28%
-0.21%
1.14%
1.37%
1,11,72,688
1,44,19,387
2,31,25,616
97,07,272
5.1%
4.6%
9.5%
4.1%
-1.09%
-3.04%
-1.38%
-1.47%
8,93,30,016
11,23,86,582
7,65,01,578
10,45,24,183
41.1%
35.8%
31.3%
43.7%
-1.37%
-1.15%
1.12%
1.73%
3,20,07,758
6,81,31,687
4,90,88,401
6,93,84,689
14.7%
21.7%
20.1%
29.0%
-0.83%
-1.34%
-0.69%
0.22%
21,72,53,227
31,39,38,884
24,42,08,968
23,90,96,389
100.0%
100.0%
100.0%
100.0%
-0.64%
-0.93%
0.52%
1.07%
Total 35,47,17,611 35.0% 0.51% 5,84,24,963 5.8% -1.75% 38,27,42,359 37.7% 0.02% 21,86,12,535 21.5% -0.63% 1,01,44,97,468 100.0% -0.05%
Operator
Region
AIRTEL
G.R. RMS QoQ ~
BSNL
G.R. RMS QoQ ~
JIO
G.R. RMS QoQ ~
VODA-IDEA
G.R. RMS QoQ ~
TOTAL
G.R. RMS QoQ ~
EAST

NORTH

PAN

SOUTH

WEST

4,593.41
7,521.80
4,754.90
6,335.37
3,981.27
40.22%
39.90%
44.82%
42.79%
27.09%
5.88%
6.25%
-6.70%
5.84%
6.15%
442.41
847.35
1,820.74
998.39
602.85
3.87%
4.49%
17.16%
6.74%
4.10%
-43.14%
-18.75%
-30.76%
3.26%
-65.63%
5,038.81
6,815.92
946.61
4,798.56
6,170.98
44.11%
36.15%
8.92%
32.41%
41.98%
3.29%
5.19%
9.26%
4.21%
4.75%
1,347.50
3,667.48
3,086.10
2,674.07
3,943.84
11.80%
19.45%
29.09%
18.06%
26.83%
3.70%
3.47%
2.12%
0.79%
4.12%
11,422.13
18,852.55
10,608.35
14,806.39
14,698.94
100.00%
100.00%
100.00%
100.00%
100.00%
1.13%
3.89%
-8.66%
4.19%
-3.19%
TOTAL 27,186.75 38.62% 3.57% 4,711.74 6.69% -34.30% 23,770.88 33.77% 4.62% 14,718.99 20.91% 2.88% 70,388.36 100.00% -0.09%
Year
2022


Month
June


Region
All


State
All


Region & State - RMS & CMS
Power BI Desktop
Scatter Plot of Wireless VLR Subs. Vs Gross Reveue
10M
20M
30M
40M
50M
Gross Revenue [Crs.]
WireLess
VLR
Subs.
500 1,000 1,500 2,000
AIRTEL BSNL JIO MTNL VODA-IDEA
Operator
All


Region
All


State
All


FORECAST - Gross Revenue
• Model Equation : 12.90 + 4.04E-05*WirelessVLR Sub. + 15.66*AIRTEL + 0*BSNL + 88.24*JIO + -63.25*VodaIdea + 9.73*ASM + 2.99*BHR + 34.16*KOL + 0*NES + -26.82*ORS + -19.56+ROB
• Model prediction accuracy is at 90% with adjusted R-Square at 92.4%, this can be further improved using different prediction models like "Random Forest Regression", "Lasso Regression", "K-Neighbors Regression",
"Gradient Descent", "Support Vector Machines", "Ridge Regression", "Elastic Net", "Cross Validation", "Boosting", "Stacking", "Artificial Neural Networks" etc.
PREDICTIVE MODEL
SELECT WRELESS VLR SUBCRIBERS
1,03,75,300
AIRTEL
0


BSNL
0


VODA-ID…
0


JIO
1


ASM
0


BHR
0


KOL
1


NES
0


ORS
0


ROB
0


₹ 554 Crs.
Predicted Gross Revenue
• Model is for "East Region" of India.
• Predicted Gross Revenue is auto
calculated based on the selection.
• 1 stands for Selected 0 stand for un-
selected.
• The reason as to why VLR wireless
subscribers was selected for
prediction of Gross revenue and not
other parameters such as total
wireless subscribers, sum of wireline
and wireless subscribers is mention
in detail with appropriate calculation
in separate "jupyter" file.
• "Multiple Linear Regression Model"
is used for prediction.
• On the top right side is a scatter plot
of wireless to see the trend.
SELECT STATE
SELECT
OPERATOR
Power BI Desktop
• Activity Ratios
• Solvency Ratios
• Liquidity Ratios
• Equity Valuation Ratios
Figures are from respective operators annual financial statements......
Finacial Ratio Analysis
WORK IN PROGRESS

Weitere ähnliche Inhalte

Empfohlen

AI Trends in Creative Operations 2024 by Artwork Flow.pdf
AI Trends in Creative Operations 2024 by Artwork Flow.pdfAI Trends in Creative Operations 2024 by Artwork Flow.pdf
AI Trends in Creative Operations 2024 by Artwork Flow.pdfmarketingartwork
 
PEPSICO Presentation to CAGNY Conference Feb 2024
PEPSICO Presentation to CAGNY Conference Feb 2024PEPSICO Presentation to CAGNY Conference Feb 2024
PEPSICO Presentation to CAGNY Conference Feb 2024Neil Kimberley
 
Content Methodology: A Best Practices Report (Webinar)
Content Methodology: A Best Practices Report (Webinar)Content Methodology: A Best Practices Report (Webinar)
Content Methodology: A Best Practices Report (Webinar)contently
 
How to Prepare For a Successful Job Search for 2024
How to Prepare For a Successful Job Search for 2024How to Prepare For a Successful Job Search for 2024
How to Prepare For a Successful Job Search for 2024Albert Qian
 
Social Media Marketing Trends 2024 // The Global Indie Insights
Social Media Marketing Trends 2024 // The Global Indie InsightsSocial Media Marketing Trends 2024 // The Global Indie Insights
Social Media Marketing Trends 2024 // The Global Indie InsightsKurio // The Social Media Age(ncy)
 
Trends In Paid Search: Navigating The Digital Landscape In 2024
Trends In Paid Search: Navigating The Digital Landscape In 2024Trends In Paid Search: Navigating The Digital Landscape In 2024
Trends In Paid Search: Navigating The Digital Landscape In 2024Search Engine Journal
 
5 Public speaking tips from TED - Visualized summary
5 Public speaking tips from TED - Visualized summary5 Public speaking tips from TED - Visualized summary
5 Public speaking tips from TED - Visualized summarySpeakerHub
 
ChatGPT and the Future of Work - Clark Boyd
ChatGPT and the Future of Work - Clark Boyd ChatGPT and the Future of Work - Clark Boyd
ChatGPT and the Future of Work - Clark Boyd Clark Boyd
 
Getting into the tech field. what next
Getting into the tech field. what next Getting into the tech field. what next
Getting into the tech field. what next Tessa Mero
 
Google's Just Not That Into You: Understanding Core Updates & Search Intent
Google's Just Not That Into You: Understanding Core Updates & Search IntentGoogle's Just Not That Into You: Understanding Core Updates & Search Intent
Google's Just Not That Into You: Understanding Core Updates & Search IntentLily Ray
 
Time Management & Productivity - Best Practices
Time Management & Productivity -  Best PracticesTime Management & Productivity -  Best Practices
Time Management & Productivity - Best PracticesVit Horky
 
The six step guide to practical project management
The six step guide to practical project managementThe six step guide to practical project management
The six step guide to practical project managementMindGenius
 
Beginners Guide to TikTok for Search - Rachel Pearson - We are Tilt __ Bright...
Beginners Guide to TikTok for Search - Rachel Pearson - We are Tilt __ Bright...Beginners Guide to TikTok for Search - Rachel Pearson - We are Tilt __ Bright...
Beginners Guide to TikTok for Search - Rachel Pearson - We are Tilt __ Bright...RachelPearson36
 
Unlocking the Power of ChatGPT and AI in Testing - A Real-World Look, present...
Unlocking the Power of ChatGPT and AI in Testing - A Real-World Look, present...Unlocking the Power of ChatGPT and AI in Testing - A Real-World Look, present...
Unlocking the Power of ChatGPT and AI in Testing - A Real-World Look, present...Applitools
 
12 Ways to Increase Your Influence at Work
12 Ways to Increase Your Influence at Work12 Ways to Increase Your Influence at Work
12 Ways to Increase Your Influence at WorkGetSmarter
 

Empfohlen (20)

AI Trends in Creative Operations 2024 by Artwork Flow.pdf
AI Trends in Creative Operations 2024 by Artwork Flow.pdfAI Trends in Creative Operations 2024 by Artwork Flow.pdf
AI Trends in Creative Operations 2024 by Artwork Flow.pdf
 
Skeleton Culture Code
Skeleton Culture CodeSkeleton Culture Code
Skeleton Culture Code
 
PEPSICO Presentation to CAGNY Conference Feb 2024
PEPSICO Presentation to CAGNY Conference Feb 2024PEPSICO Presentation to CAGNY Conference Feb 2024
PEPSICO Presentation to CAGNY Conference Feb 2024
 
Content Methodology: A Best Practices Report (Webinar)
Content Methodology: A Best Practices Report (Webinar)Content Methodology: A Best Practices Report (Webinar)
Content Methodology: A Best Practices Report (Webinar)
 
How to Prepare For a Successful Job Search for 2024
How to Prepare For a Successful Job Search for 2024How to Prepare For a Successful Job Search for 2024
How to Prepare For a Successful Job Search for 2024
 
Social Media Marketing Trends 2024 // The Global Indie Insights
Social Media Marketing Trends 2024 // The Global Indie InsightsSocial Media Marketing Trends 2024 // The Global Indie Insights
Social Media Marketing Trends 2024 // The Global Indie Insights
 
Trends In Paid Search: Navigating The Digital Landscape In 2024
Trends In Paid Search: Navigating The Digital Landscape In 2024Trends In Paid Search: Navigating The Digital Landscape In 2024
Trends In Paid Search: Navigating The Digital Landscape In 2024
 
5 Public speaking tips from TED - Visualized summary
5 Public speaking tips from TED - Visualized summary5 Public speaking tips from TED - Visualized summary
5 Public speaking tips from TED - Visualized summary
 
ChatGPT and the Future of Work - Clark Boyd
ChatGPT and the Future of Work - Clark Boyd ChatGPT and the Future of Work - Clark Boyd
ChatGPT and the Future of Work - Clark Boyd
 
Getting into the tech field. what next
Getting into the tech field. what next Getting into the tech field. what next
Getting into the tech field. what next
 
Google's Just Not That Into You: Understanding Core Updates & Search Intent
Google's Just Not That Into You: Understanding Core Updates & Search IntentGoogle's Just Not That Into You: Understanding Core Updates & Search Intent
Google's Just Not That Into You: Understanding Core Updates & Search Intent
 
How to have difficult conversations
How to have difficult conversations How to have difficult conversations
How to have difficult conversations
 
Introduction to Data Science
Introduction to Data ScienceIntroduction to Data Science
Introduction to Data Science
 
Time Management & Productivity - Best Practices
Time Management & Productivity -  Best PracticesTime Management & Productivity -  Best Practices
Time Management & Productivity - Best Practices
 
The six step guide to practical project management
The six step guide to practical project managementThe six step guide to practical project management
The six step guide to practical project management
 
Beginners Guide to TikTok for Search - Rachel Pearson - We are Tilt __ Bright...
Beginners Guide to TikTok for Search - Rachel Pearson - We are Tilt __ Bright...Beginners Guide to TikTok for Search - Rachel Pearson - We are Tilt __ Bright...
Beginners Guide to TikTok for Search - Rachel Pearson - We are Tilt __ Bright...
 
Unlocking the Power of ChatGPT and AI in Testing - A Real-World Look, present...
Unlocking the Power of ChatGPT and AI in Testing - A Real-World Look, present...Unlocking the Power of ChatGPT and AI in Testing - A Real-World Look, present...
Unlocking the Power of ChatGPT and AI in Testing - A Real-World Look, present...
 
12 Ways to Increase Your Influence at Work
12 Ways to Increase Your Influence at Work12 Ways to Increase Your Influence at Work
12 Ways to Increase Your Influence at Work
 
ChatGPT webinar slides
ChatGPT webinar slidesChatGPT webinar slides
ChatGPT webinar slides
 
More than Just Lines on a Map: Best Practices for U.S Bike Routes
More than Just Lines on a Map: Best Practices for U.S Bike RoutesMore than Just Lines on a Map: Best Practices for U.S Bike Routes
More than Just Lines on a Map: Best Practices for U.S Bike Routes
 

Telecom - CMS,RMS & Financial Dashboard

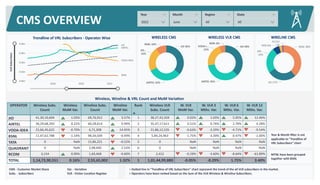
  • 1. Power BI Desktop BSNL 38% JIO 27% 24% TATA 6% 1% AIR… RCOM WIRELINE CMS JIO 38% AIRTEL 35% 22% BSNL 6% VODA-I… WIRELESS VLR CMS Wireless, Wireline & VRL Count and MoM Variation OPERATOR Wireless Subs. Count Wireless MoM Var. Wireline Subs. Count Wireline MoM Var. Rank  Wireless VLR Subs. Count W. VLR MoM Var. W. VLR 3 Mths. Var. W. VLR 6 Mths. Var. W. VLR 12 Mths. Var. JIO AIRTEL VODA-IDEA BSNL TATA QUADRANT RCOM 41,30,10,694 36,29,68,293 25,66,45,622 11,47,62,788 0 0 3,154 1.03% 0.22% -0.70% -1.14% NaN NaN 0.00% 69,76,912 60,28,614 6,71,308 98,34,039 15,86,221 2,98,440 1,69,468 3.57% 0.99% 14.45% -0.49% -0.52% 2.53% -0.60% 1 2 3 4 5 6 7 38,27,42,359 35,47,17,611 21,86,12,535 5,84,24,963 0 0 2,412 0.02% 0.51% -0.63% -1.75% NaN NaN -0.29% 1.03% 0.74% -3.29% -3.39% NaN NaN -3.60% 5.05% 2.78% -4.71% 0.47% NaN NaN -8.64% 12.46% 4.28% -9.54% -1.00% NaN NaN -61.89% TOTAL 1,14,73,90,551 0.16% 2,55,65,002 1.32% 1 1,01,44,99,880 -0.05% -0.29% 1.75% 3.40% CMS OVERVIEW Year 2022   Month June   Region All   State All   Trendline of VRL Subscribers - Operator Wise VLR Subscribers 0.0bn 0.1bn 0.2bn 0.3bn 0.4bn 2018 2020 2022 AIRTEL BSNL JIO VODA-IDEA CMS - Customer Market Share Var. - Variation Subs. - Subscribers VLR - Visitor Location Register JIO 36% AIRTEL 32% 22% BSNL 10% VO… WIRELESS CMS • Dotted line in "Trendline of VRL Subscribers" chart represent the trend of the all VLR subscribers in the market. • Operators have been ranked based on the Sum of the VLR Wireless & Wireline Subscribers. MTNL have been grouped together with BSNL Year & Month filter is not applicable to "Trendline of VRL Subscribers" chart
  • 2. Power BI Desktop RMS OVERVIEW Fiscal Year 22-23   Fiscal Qtr Q1   Region All   State All   36% JIO 31% 19% BSNL 6% O… 1% AIRTEL VODA-IDEA RMS - GROSS REVENUE Gross Revenue - Operator & License 0K 10K 20K Gross Revenue [Crs.] AIRTEL JIO VODA-IDEA BSNL TATA OTHERS ACT SIFY RAIL TEL 27K 24K 15K 5K 3K 1K 1K 0K 0K ILD INTERNET MNP NLD PMRTS TELECOM VNO VSAT JIO 36% AIRTEL 35% 16% BSNL 7% 3%0% VO… TATA BT RMS - ADJUSTED G.R. OPERATOR Gross Revenue  G.R. QoQ Var. G.R. YoY Var. Adjusted G.R. A.G.R. QoQ Var. A.G.R. YoY Var. AIRTEL JIO VODA-IDEA BSNL TATA OTHERS ACT SIFY RAIL TEL AT&T 27,186.75 23,770.88 14,718.99 4,711.74 2,792.94 971.88 521.60 298.54 219.82 216 22 3.57% 4.62% 2.88% -34.30% -0.56% 5.28% -5.33% -7.42% -10.88% 11 00% 20.09% 21.93% 10.61% 6.26% 35.90% 11.89% 10.01% 8.82% 37.88% 13 42% 21,260.52 22,054.39 9,446.09 4,104.89 1,819.36 498.92 3.04 242.43 219.82 213 44 3.95% 4.41% -1.82% 2.05% 1.39% -4.68% -55.81% -4.28% -10.88% 9 64% 19.54% 21.02% 9.16% 18.01% 35.02% 6.07% -64.15% 5.12% 37.88% 13 69% TOTAL 76,408.19 0.03% 17.91% 60,529.65 2.79% 17.91% Bar Chart of Gross Revenue Time Series 0K 20K 40K 60K 80K Gross Revenue [Crs] 2017 2018 2019 2020 2021 2022 72K 63K 65K 66K 61K 62K 58K 58K 59K 58K 58K 60K 64K 68K 67K 68K 72K 67K 65K 67K 70K 76K 76K ILD INTERNET MNP NLD PMRTS TELECOM VNO Operator All   • Operators with Gross Revenue Less than ₹100 Crs. have been grouped together as "OTHERS". MTNL is grouped with BSNL. • Filters "Fiscal Year" & "Fiscal Qtr." are not applicable to "Bar Chart Gross Revenue Time Series" , Filter "Operator" is only applicable to this chart.
  • 3. Power BI Desktop CMS & RMS Trend Monthly/Quarterly Customer Market Share Trend OPERATOR 2021-08 2021-09 2021-10 2021-11 2021-12 2022-01 2022-02 2022-03 2022-04 2022-05 2022-06 2022-07 JIO AIRTEL VODA-IDEA BSNL MTNL RCOM QUADRANT TATA 35.46% 34.79% 23.91% 5.78% 0.06% 0.00% 0.00% 0.00% 35.80% 34.64% 23.75% 5.75% 0.06% 0.00% 0.00% 0.00% 36.07% 34.56% 23.58% 5.73% 0.06% 0.00% 0.00% 0.00% 36.17% 34.76% 23.30% 5.71% 0.06% 0.00% 0.00% 0.00% 36.54% 34.61% 23.01% 5.77% 0.06% 0.00% 0.00% 0.00% 36.75% 34.54% 22.81% 5.85% 0.06% 0.00% 0.00% 0.00% 37.38% 34.34% 22.32% 5.90% 0.06% 0.00% 0.00% 0.00% 37.23% 34.61% 22.22% 5.88% 0.06% 0.00% 0.00% 0.00% 37.42% 34.67% 21.98% 5.86% 0.06% 0.00% 0.00% 0.00% 37.70% 34.77% 21.67% 5.80% 0.06% 0.00% 0.00% 0.00% 37.73% 34.96% 21.55% 5.70% 0.06% 0.00% 0.00% 0.00% 37.81% 34.98% 21.47% 5.67% 0.06% 0.00% 0.00% 0.00% Total 100.00% 100.00% 100.00% 100.00% 100.00% 100.00% 100.00% 100.00% 100.00% 100.00% 100.00% 100.00% Year 2022   Month July   Region All   State All   Revenue Market Share Trend OPERATOR 2019-09 2019-12 2020-03 2020-06 2020-09 2020-12 2021-03 2021-06 2021-09 2021-12 2022-03 2022-06 AIRTEL JIO VODA-IDEA BSNL TATA OTHERS ACT SIFY AT&T 31.77% 26.58% 27.26% 7.26% 3.24% 0.87% 0.51% 0.42% 32.38% 25.79% 27.01% 7.45% 2.95% 0.78% 0.70% 0.48% 0.47% 32.33% 25.80% 26.94% 7.77% 3.00% 0.80% 0.70% 0.42% 0.39% 32.69% 28.97% 24.47% 6.93% 2.95% 0.73% 0.73% 0.40% 0.42% 33.06% 29.94% 23.14% 7.00% 3.01% 0.66% 0.64% 0.41% 0.38% 33.61% 30.14% 22.72% 6.45% 2.83% 1.22% 0.64% 0.40% 0.39% 34.46% 28.16% 21.77% 7.73% 3.20% 1.30% 0.74% 0.42% 0.37% 34.93% 30.08% 20.54% 6.84% 3.17% 1.34% 0.73% 0.42% 0.39% 35.75% 30.17% 20.23% 6.02% 3.14% 1.60% 0.73% 0.44% 0.40% 34.85% 30.42% 19.90% 6.74% 3.66% 1.15% 0.72% 0.45% 0.29% 34.37% 29.74% 18.73% 9.39% 3.68% 1.21% 0.72% 0.42% 0.32% 35.58% 31.11% 19.26% 6.17% 3.66% 1.27% 0.68% 0.39% 0.28% Total 100.00% 100.00% 100.00% 100.00% 100.00% 100.00% 100.00% 100.00% 100.00% 100.00% 100.00% 100.00% Fiscal Y… 22-23   License All   Operator All   Fiscal Qtr Q1  
  • 4. Power BI Desktop Operator Region AIRTEL VLR Subs. CMS MoM ~ BSNL VLR Subs. CMS MoM ~ JIO VLR Subs. CMS MoM ~ VODA-IDEA VLR Subs. CMS MoM ~ Total VLR Subs. CMS MoM ~ EAST  NORTH  SOUTH  WEST  8,47,42,765 11,90,01,228 9,54,93,373 5,54,80,245 39.0% 37.9% 39.1% 23.2% 0.28% -0.21% 1.14% 1.37% 1,11,72,688 1,44,19,387 2,31,25,616 97,07,272 5.1% 4.6% 9.5% 4.1% -1.09% -3.04% -1.38% -1.47% 8,93,30,016 11,23,86,582 7,65,01,578 10,45,24,183 41.1% 35.8% 31.3% 43.7% -1.37% -1.15% 1.12% 1.73% 3,20,07,758 6,81,31,687 4,90,88,401 6,93,84,689 14.7% 21.7% 20.1% 29.0% -0.83% -1.34% -0.69% 0.22% 21,72,53,227 31,39,38,884 24,42,08,968 23,90,96,389 100.0% 100.0% 100.0% 100.0% -0.64% -0.93% 0.52% 1.07% Total 35,47,17,611 35.0% 0.51% 5,84,24,963 5.8% -1.75% 38,27,42,359 37.7% 0.02% 21,86,12,535 21.5% -0.63% 1,01,44,97,468 100.0% -0.05% Operator Region AIRTEL G.R. RMS QoQ ~ BSNL G.R. RMS QoQ ~ JIO G.R. RMS QoQ ~ VODA-IDEA G.R. RMS QoQ ~ TOTAL G.R. RMS QoQ ~ EAST  NORTH  PAN  SOUTH  WEST  4,593.41 7,521.80 4,754.90 6,335.37 3,981.27 40.22% 39.90% 44.82% 42.79% 27.09% 5.88% 6.25% -6.70% 5.84% 6.15% 442.41 847.35 1,820.74 998.39 602.85 3.87% 4.49% 17.16% 6.74% 4.10% -43.14% -18.75% -30.76% 3.26% -65.63% 5,038.81 6,815.92 946.61 4,798.56 6,170.98 44.11% 36.15% 8.92% 32.41% 41.98% 3.29% 5.19% 9.26% 4.21% 4.75% 1,347.50 3,667.48 3,086.10 2,674.07 3,943.84 11.80% 19.45% 29.09% 18.06% 26.83% 3.70% 3.47% 2.12% 0.79% 4.12% 11,422.13 18,852.55 10,608.35 14,806.39 14,698.94 100.00% 100.00% 100.00% 100.00% 100.00% 1.13% 3.89% -8.66% 4.19% -3.19% TOTAL 27,186.75 38.62% 3.57% 4,711.74 6.69% -34.30% 23,770.88 33.77% 4.62% 14,718.99 20.91% 2.88% 70,388.36 100.00% -0.09% Year 2022   Month June   Region All   State All   Region & State - RMS & CMS
  • 5. Power BI Desktop Scatter Plot of Wireless VLR Subs. Vs Gross Reveue 10M 20M 30M 40M 50M Gross Revenue [Crs.] WireLess VLR Subs. 500 1,000 1,500 2,000 AIRTEL BSNL JIO MTNL VODA-IDEA Operator All   Region All   State All   FORECAST - Gross Revenue • Model Equation : 12.90 + 4.04E-05*WirelessVLR Sub. + 15.66*AIRTEL + 0*BSNL + 88.24*JIO + -63.25*VodaIdea + 9.73*ASM + 2.99*BHR + 34.16*KOL + 0*NES + -26.82*ORS + -19.56+ROB • Model prediction accuracy is at 90% with adjusted R-Square at 92.4%, this can be further improved using different prediction models like "Random Forest Regression", "Lasso Regression", "K-Neighbors Regression", "Gradient Descent", "Support Vector Machines", "Ridge Regression", "Elastic Net", "Cross Validation", "Boosting", "Stacking", "Artificial Neural Networks" etc. PREDICTIVE MODEL SELECT WRELESS VLR SUBCRIBERS 1,03,75,300 AIRTEL 0   BSNL 0   VODA-ID… 0   JIO 1   ASM 0   BHR 0   KOL 1   NES 0   ORS 0   ROB 0   ₹ 554 Crs. Predicted Gross Revenue • Model is for "East Region" of India. • Predicted Gross Revenue is auto calculated based on the selection. • 1 stands for Selected 0 stand for un- selected. • The reason as to why VLR wireless subscribers was selected for prediction of Gross revenue and not other parameters such as total wireless subscribers, sum of wireline and wireless subscribers is mention in detail with appropriate calculation in separate "jupyter" file. • "Multiple Linear Regression Model" is used for prediction. • On the top right side is a scatter plot of wireless to see the trend. SELECT STATE SELECT OPERATOR
  • 6. Power BI Desktop • Activity Ratios • Solvency Ratios • Liquidity Ratios • Equity Valuation Ratios Figures are from respective operators annual financial statements...... Finacial Ratio Analysis WORK IN PROGRESS