
Empfohlen
Empfohlen
Weitere ähnliche Inhalte
Was ist angesagt?
Was ist angesagt? (20)
Andere mochten auch
Andere mochten auch (8)
Ähnlich wie Protecting Valuable Green Spaces and Natural Resources
Ähnlich wie Protecting Valuable Green Spaces and Natural Resources (20)
Mehr von Greg Jennings
Kürzlich hochgeladen
Kürzlich hochgeladen (20)
Protecting Valuable Green Spaces and Natural Resources
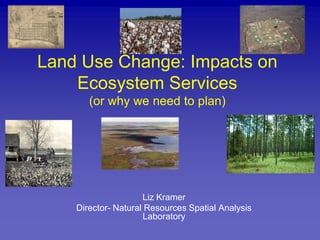
- 1. Land Use Change: Impacts on Ecosystem Services(or why we need to plan) Liz Kramer Director- Natural Resources Spatial Analysis Laboratory
- 2. What is Green Space? It Depends on Who You Ask! To a Conservationist To a Recreation Director
- 3. What is Green Space? Agriculture Forest MANY TYPES OF GREEN SPACE Active & Passive Recreation Critical Habitat Buffers
- 4. What is Green Space? As there are many types of Green Space, when planning for it or purchasing it, be clear as to its intended use and management Farm Preservation? Buffer Areas Habitat Protection
- 5. What is Green Space? “Green Space” must therefore be clearly defined for public discussions Natural Corridor Recreation Trail or
- 6. Conservation The act or process of conserving Preservation or restoration from loss, damage or neglect. The protection, preservation, management or restoration of wildlife and of natural resources, such as forest soil or water. The maintenance of a physical quantity such as energy or mass during a physical or chemical change. American Heritage Dictionary of the English language 4thedition Conservation = Environmental Protection
- 7. Conservation is not a new Concept Conservation is a state of harmony between men and nature Aldo Leopold Conservation means the wise use of the earth and its resources for the lasting good of men Gifford Pinchot The conservation of natural resources is the fundamental problem. Unless we solve that problem it will avail us little to solve all others Theodore Roosevelt - 1906
- 10. Most environmental degradation is due to population and choices
- 12. Ecosystem Services Benefits people obtain from ecosystems Provisioning services Food, water, fuel, and fiber Regulating and supporting services Climate, water, disease regulation, and pollination Soil formation, nutrient cycling, and decomposition Cultural services Educational, aesthetic, cultural heritage, recreation and tourism
- 13. Green Infrastructure “the substructure or underlying foundation, especially the basic installations and facilities on which the continuation and growth of a community depend” gray infrastructure - roads, sewers, utility lines, hospitals, schools, prisons, etc Green infrastructure – waterways, wetlands, woodlands, wildlife habitats, natural areas, greenways, working farms, ranches and forests, wilderness, etc.
- 14. Positive Impacts of Green Space Environmental Impacts Decrease stormwater runoff & improved water quality Protection of wildlife habitat and wildlife Keeping working landscapes (forest & farm) Improved air quality Reduces contributes to climate change Economic Impacts Social Impacts
- 15. Positive Impacts of Green Space Environmental Impacts Economic Impacts Increase property values & tax base in cities Lower taxes for community services in suburbs Lower construction and maintenance cost Lower health care costs Social Impacts
- 16. Positive Impacts of Green Space Environmental Impacts Economic Impacts Social Impacts Increase in economic opportunity Improved feeling of sense of place and community More access to open space Increased social interaction (“public life”) Less traffic and shorter commutes Inner-city redevelopment
- 17. Why Manage Growth? Some growth will come to your city or county whether you want it or not. Some growth won’t come to your city or county no matter what you do. Then there is a middle ground you can impact This part will decide your fate
- 18. Economic Benefits of Farm and Forest Lands These lands produce valuable products for consumers, generate jobs and tax revenues 1/6 of all jobs and gross state product in GA These lands attract businesses and families These lands also provide a net surplus to local government finances
- 19. Economic Benefits of Green Space Green spaces increase property values of surrounding land Green and open spaces can provide environmental amenities for free If green spaces contribute to quality of life, you attract people and jobs to community
- 20. Development by Type Many counties and cities think that growth and development mean an increasingtaxbase and better financial health for the local government. Unfortunately a growing tax base is not enough to guarantee financial health, you must get revenue to grow faster than expenditures.
- 21. Revenues to Cost by Land Use Using results compiled by AFT, the national averages are: Residential: $0.87 Commercial/Industrial: $3.45 Farm/Forest/Open: $2.70 These figures are $’s of revenue for each $1 of expenditures.
- 22. Some Southeastern US ResultsRevenue:Expenditure Ratios
- 25. Development Patterns Development patterns have an impact on the cost of service delivery: sprawl is expensive to service. The same growth done more densely and contiguously saves both money, farmland, and provides environmental amenities. New Jersey, South Carolina, California studies
- 26. How to Change the Numbers Cost of service goes down by 50% of land savings (use half the land, save 25%). Avoid leapfrog development. Build where infrastructure already exists (infill is much cheaper than extensive growth). Multifamily is less expensive per unit until density gets very high. Design so service costs are low.
- 27. Jobs, Commuting, and Home 31% if workers in Rural South work in a different county than where they live. 52% of employment growth in metro areas was from in-commuters. 27% of employment growth in rural areas was from in-commuters. jobs ≠ housing growth Source: Mitch Renkow, NC State
- 28. Changing the Numbers The ways to change the numbers sure sound a lot like the LCI concept Commutes would be short Density would be higher Sometimes done as infill or redevelopment
- 29. Knowing where not to build is as important as where to build Green space planning identifies where not to build and allows us to take advantage of nature in providing key services
- 31. Circa 1732
- 32. Circa 1831
- 33. Railroad and County Map Of Georgia 1920
- 34. State Highway Map 1939
- 35. Thomas County 1895 Gwinnett County 1912 Franklin County 1956
- 39. Land Cover Change 1974 - 2008
- 40. 1974 -2005 Ag Change Statewide
- 41. Distribution of Converted Ag Lands
- 46. Results from Ben Map Models(EPA)
- 51. Impervious Change: Top 10 Counties in Acres Per Day 1991 – 2001 Gwinnett (6) Fulton (5) Cobb (4) DeKalb (2) Forsyth (1) Clayton (1) Henry (1) Chatham (1) Cherokee (1) Richmond (1) 2001 – 2005 Gwinnett (9) Fulton (8) Cobb (6) DeKalb (5) Henry (4) Clayton (3) Chatham (3) Paulding (3) Cherokee (3) Muscogee (2)
- 52. Top 10 Impervious Surface as Percent of County
- 53. Water Balance Pre-development Post-development
- 54. Urban Hydrograph
- 56. Urban Growth Modeling SLEUTH - Slope, Land-use, Exclusion, Urban-extent, Transportation, Hillshade Brute-force simulations Types of growth – spontaneous growth, new spreading centers, edge growth, and road-influenced growth Growth coefficients – dispersion, breed, spread, slope, and road gravity
- 58. Scenarios Current Trends Future Land Use Alternative Service Delivery - Cluster Alternative
- 59. Current Trends Scenario Exclusion
- 60. Future Land Use Scenario Exclusion
- 61. Service Delivery – Clustered Scenario Exclusion
- 62. Scenario Results (1) (2) (3)
- 63. Scenario Comparison Current Trends Scenario 2001: 13% urban, 4.3% impervious 2025: 33% urban, 6.7 % impervious Future Land Use Scenario 2001: 13% urban, 4.3% impervious 2025: 31% urban, 6.4% impervious Service Delivery Cluster Scenario 2001: 13% urban, 4.3% impervious 2025: 26% urban, 5.8% impervious
- 64. Pettit Creek Simulated Hydrograph
- 65. 1 2 3
- 66. Is all land the same?
- 67. Georgia encompasses 37 million acres of land
- 69. If you can read this you’re pretty much screwed
- 71. are most vulnerable to loss?Based on the above, what are the highest priority areas to preserve? Resource Lands Assessment
- 72. Habitat Preservation & Connectivity (“Critical Habitats”) Habitat fragmentation is a serious threat to biological diversity and is the primary cause of the present extinction crisis. Watershed Protection (“Water quality”) Our watersheds not only provide us with quality drinking water, but also provide healthy streams for fishing and swimming. Why are we doing this?
- 73. ? Economic Sustainability of Forests Protecting the best forests helps maintain a strong, resource-based economy. Preservation of Quality Farm Land (“Economic Viability”) Protecting the best farm land enables crop production for many generations to come. Why are we doing this?
- 74. Cultural Viability Preserving heritage and traditional values, cultural lands often define a sense of place. Understanding Development Pressures Large tracts of forests, wetlands, and farmlands are threatened with fragmentation and parcelization due to urban development pressures. Why are we doing this?
- 75. Declining Environmental Quality Polluted air and drinking water can lead to devastating health problems and degrades overall quality of life. Nutrient Cap Maintenance Nutrient reductions will have to be capped despite expected growth in the region. Why are we doing this?
- 76. Green Infrastructure Approach Southeastern Ecological Framework
- 77. Introduction to Resource Land Assessment What is it? Where are the lands that: Have the highest values related to water quality, habitat, economy, culture, etc.? Are most vulnerable to loss Based on the above, what are the highest priority areas to preserve?
- 80. Forest Economics
- 81. Air Quality
- 83. Cultural Assets
- 84. Prime Farmland
- 87. Assumptions
- 88. Data
- 89. Approach
- 92. Streams
- 93. Wetlands
- 94. Roads
- 95. Protected Lands
- 97. Water Quality Model Goal Identify those forests and wetlands that, if lost, would have the greatest potential to compromise or degrade watershed and water quality.
- 98. Water Quality Model Local or Site Factors (“Content”) Regional/Watershed Factors (“Context”) Assumptions
- 99. Water Quality Model Approach Assemble Data Layers
- 100. Water Quality Model Approach Assemble Data Layers Assign Score to Values within Each Data Layer
- 101. Water Quality Model Approach Assemble Data Layers Assign Score to Values within Each Data Layer Assign Weights to Each Data Layer
- 102. Water Quality Model Approach Assemble Data Layers Assign Score to Values within Each Data Layer Assign Weights to Each Data Layer Calculate Composite Score
- 103. Water Quality Model Data Layers Local Parameters Proximity to Water Erodible Soils Net Primary Productivity Slope Wetland Function Forest Fragmentation 100 Year Floodplains Hydrogeomorphic Regions Regional Parameters(summarized by HUC 11 watershed) Stream Density (m/sq km) Percent Forested Percent Impervious Water Quality Rank Municipal Water Supplies
- 104. Water Quality Model Loch Raven Reservoir Liberty Reservoir Baltimore City Results
- 105. A green space planning process A Model 12-Step Process Creating a Draft Plan 1. Take charge 2. Conduct a Community Resource Inventory 3. Categorize green space areas by function 4. Review previous plans & documents 5. Develop clear objectives 6. Take an initial stab at priority areas for preservation
- 106. A green space planning process A Model 12-Step Process Fine Tuning & Selling the Plan 7. Contact landowners that might be affected 8. Prioritize areas for conservation based on inventory, objectives, & landowner considerations 9. Create an inventory of priority parcels 10. Develop an implementation scheme, including fiscal plan, regulatory aspects, and procedures 11. Pepper the community with education 12. Fold the plan into appropriate plans and regulations
- 107. A green space planning process 1. Take charge!! Someone has to start a discussion Someone has to take charge Planning Commission Develop a team ? Greenspace Commission Chamber of Commerce
- 109. priority natural resource areas
- 110. areas that might be protected through regulation
- 111. unique historic, archeological, or aesthetic sites
- 115. What type of green space does it address?
- 118. point out that their property has been identified as being important, after a careful study
- 119. explain that this is NOT a land grab!
- 122. owner
- 123. reason for priority listing
- 125. how will green space protection be funded?
- 126. what changes to regulations are needed?
- 127. what are the management needs of acquired properties?
- 129. fair market value sale
- 130. “bargain” sale
- 131. purchase of conservation restrictions (easements)
- 132. donation
- 133. outright
- 134. upon death by owner
- 135. with lifetime use
- 136. land exchange/foreclosure/eminent domain
- 138. Hold proactive public meetings
- 140. The Ideal Planning Process Inventory Implementation Analysis Plan
- 141. Inventory A Simple Example… Implementation Analysis Plan 1. Inventory Base Map Land Cover Wetlands Water Resources Unique/Fragile Committed
- 143. Regulated
- 144. Committed OSAreas available to be developed inGRAY
- 146. Linkages
- 148. Linkages
- 149. Windows/Additions
- 150. ID Parcels
- 162. Questions?