SlideShare ist ein Scribd-Unternehmen logo
1 von 14
Downloaden Sie, um offline zu lesen
Anal. Chem. 2005, 77, 2187-2200


Quantitative Proteomic Analysis by Accurate Mass
Retention Time Pairs
Jeffrey C. Silva,*,† Richard Denny,§ Craig A. Dorschel,† Marc Gorenstein,† Ignatius J. Kass,‡
Guo-Zhong Li,† Therese McKenna,§ Michael J. Nold,‡ Keith Richardson,§ Phillip Young,§ and
Scott Geromanos†

Waters Corporation, 34 Maple Street, Milford, Massachusetts 01757-3696, Waters Corporation, 100 Cummings Center,
Beverly, Massachusetts 01915, and Waters Corporation, Atlas Park, Simons Way, M22 5PP, Manchester, Great Britain


Current methodologies for protein quantitation include                        due to the issues associated with sample complexity, sample
2-dimensional gel electrophoresis techniques, metabolic                       preparation, and the wide dynamic range of protein abundance.1,2
labeling, and stable isotope labeling methods to name only                    Many approaches to quantitative proteomics have involved the
a few. The current literature illustrates both pros and cons                  combination of stable-isotope labeling methods for sample prepa-
for each of the previously mentioned methodologies.                           ration with automated liquid chromatography coupled to a tandem
Keeping with the teachings of William of Ockham, “with                        mass spectrometer (LC/MS/MS).3-12 Stable isotopes are generally
all things being equal the simplest solution tends to                         introduced into proteins or peptides by chemical modification,3-6
be correct”, a simple LC/MS based methodology is                              metabolic labeling,7-10 or enzymatic derivatization.11,12 The speci-
presented that allows relative changes in abundance of                        ficity of these isotopic labeling techniques is contingent upon
proteins in highly complex mixtures to be determined.                         observing different mass shifts, which can be generated by using
Utilizing a reproducible chromatographic separations                          a variety of available labeling reagents.
system along with the high mass resolution and mass                               In two recent articles, Wang and co-workers,13 as well as
accuracy of an orthogonal time-of-flight mass spectrom-                       Radulovic and co-workers,14 introduced quantitative, label-free LC/
eter, the quantitative comparison of tens of thousands of                     MS strategies for global profiling of complex protein mixtures.
ions emanating from identically prepared control and                          Both publications illustrate their specific algorithms for ion
experimental samples can be made. Using this configu-                         detection, clustering and quantitation. The lower resolution
ration, we can determine the change in relative abundance                     instrument employed in the studies presented by Radulovic and
of a small number of ions between the two conditions                          colleagues requires that their data reduction scheme condense
solely by accurate mass and retention time. Employing                         all detections into nominal mass bins. Though the data presented
standard operating procedures for both sample prepara-                        are compelling, the data reduction strategy involving nominal mass
tion and ESI-mass spectrometry, one typically obtains                         bins may result in significant errors when dealing with highly
under 5 ppm mass precision and quantitative variations                        complex mixtures. As an example, in a simple proteome such as
between 10 and 15%. The principal focus of this paper                         Escherichia coli, there are ∼105 000 tryptic peptides, including one
will demonstrate the quantitative aspects of the methodol-
ogy and continue with a discussion of the associated,                          (1) Hamdan, M.; Righetti, P. G. Mass Spectrom. Rev. 2002, 21, 287-302.
complementary qualitative capabilities.                                        (2) Lill, J. Mass Spectrom. Rev. 2003, 22, 182-194.
                                                                               (3) Gygi, S. P.; Rist, B.; Gerber, S. A.; Turecek, F.; Gelb, M. H.; Aebersold, R.
                                                                                   Nat. Biotechnol. 1999, 17, 994-999.
   Quantitative proteomics has been chartered as the technology                (4) Zhou, H. L.; Ranish, J. A.; Watts, J. D.; Aebersold, R. Nat. Biotechnol. 2002,
                                                                                   19, 512-515.
which will serve as a major contributor in studies aimed at                    (5) Griffin, T. J.; Gygi, S. P.; Rist, B.; Aebersold, R. Anal. Chem. 2001, 73,
uncovering disease pathways, biomarker discovery, and providing                    978-986.
new insights into biological processes for drug discovery. In these            (6) Chakraboorty, A.; Regnier, F. J. Chromatogr., A 2002, 949, 173-184.
                                                                               (7) Veenstra, T. D.; Martinovic, S.; Anderson, G. A.; Pasa-Tolic, L.; Smith, R. D.
experiments, mass spectrometry is used to determine the relative                   J. Am. Soc. Mass Spectrom. 2000, 11, 78-82.
amounts of protein among different biological samples to char-                 (8) Ong, S. E.; Kratchmarova, I.; Mann, M. J. Proteome Res. 2003, 2, 173-181.
acterize a variety of physiological conditions. In addition, further           (9) Krijgsveld, J.; Ketting, R. F.; Mahmoudi, T.; Johansen, J.; Artal-Sanz, M.;
                                                                                   Verrijzer, C. P.; Plasterk, R. H. A.; Heck, A. J. R. Nat. Biotechnol. 2003, 21,
characterization of the physiological perturbation may require that                927-931.
the relative degrees of posttranslational modifications associated            (10) Oda, Y.; Huang, K.; Cross, F. R.; Cowburn, D.; Chait, B. T. PNAS 1999,
with the proteins of interest be determined. However, compre-                      96, 6591-6596.
                                                                              (11) Yao, X. D.; Freas, A.; Ramirez, J.; Demirev, P. A.; Fenselau, C. Anal. Chem.
hensive quantitative proteomics remains technically challenging                    2001, 73, 2836-2842.
                                                                              (12) Stewart, I. I.; Thomson, T.; Figeys, D. Rapid Commun. Mass Spectrom. 2001,
    * Corresponding author. Phone: 978-482-3005. Fax: 508-482-2055. E-mail:        15, 2456-2465.
jeff_silva@waters.com.                                                        (13) Wang, W.; Zhou, H.; Lin, H.; Roy, S.; Shaler, T. A.; Hill, L. R.; Norton, S.;
    † Milford, Massachusetts.
                                                                                   Kumar, P.; Anderle, M.; Becker, C. H. Anal. Chem. 2003, 75, 4818-4826.
    ‡ Beverly, Massachusetts.
                                                                              (14) Radulovic, D.; Jelveh, S.; Ryu, S.; Hamilton, T. G.; Foss, E.; Mao, Y.; Emili,
    § Manchester, Great Britain.
                                                                                   A. Mol. Cell. Proteomics 2004, 3, 984-997.

10.1021/ac048455k CCC: $30.25     © 2005 American Chemical Society                        Analytical Chemistry, Vol. 77, No. 7, April 1, 2005 2187
Published on Web 03/02/2005
missed cleavage between 700 and 2481 molecular mass. An                              a quantitative proteomics strategy which employs an LC/MS
average of 7 tryptic peptides of the 105 000 are found within a                      method as the basis for the analytical strategy for quantifying
mass tolerance of 5 ppm of itself. If the mass tolerance is increased                proteome profile data for differential expression analysis. This
to within 1 Da, the average number of tryptic peptides is increased                  method relies on the changes in the peptide analyte signal
to 165. Using this logic, the opportunity to have more than one                      response from each accurate mass measurement and correspond-
peptide eluting within a nominal mass bin can be up to 23 times                      ing retention time (AMRT) component, and to directly reflect their
more likely if the data are reduced from accurate mass measure-                      concentrations in one sample relative to another. This method
ments to nominal mass. As a result, nominal mass binning of mass                     does not require the use of any stable-isotope labeling method or
spectrometric, LC/MS data may lead to problems in subsequent                         enrichment strategy; however, it does require that the sample
clustering of replicate analyzes and to variability in the corre-                    preparation conditions are carefully controlled for optimal, quan-
sponding quantitative analysis. Radulovic and co-workers report                      titative performance. Regardless of the analytical technique, the
that their quantitative results exhibited an acceptable measure of                   protein samples must be prepared in a fashion that ensures an
variance of 2-fold or less deviation in the observed signal                          efficient and reproducible separation, with concurrent elimination
intensities. In addition to presenting data from an identical                        of undesirable artifacts.
instrument platform, Wang and colleagues also illustrated LC/                            In this investigation, we prepared a tryptic digest of human
MS data collected on a time-of-flight mass spectrometer. In this                     serum spiked with increasing amounts of a standard protein
work, the authors indicated that the higher resolution and mass                      mixture and observed the linear behavior in the signal from
accuracy of the TOF system was found to be advantageous for                          digested peptides corresponding to the experimentally configured
tracking and quantifying large numbers of mass spectral peaks.                       protein concentrations. The methodology presented in this work
The results obtained from these studies provided acceptable                          maximizes the duty cycle of a quadrupole-time-of-flight (Q-TOF)
coefficients of variation (∼25%) across integrated peak intensities.                 mass spectrometer to yield extensive quantitative and qualitative
The data acquisition platform used by Radulovic was configured                       information by systematically and simultaneously analyzing the
to collect two parallel LC/MS experiments in a single LC/MS run                      peptide components from large sets of protein mixtures.22,23
for simultaneous quantitative and qualitative analysis. In an                        Although this work involves the analysis of human serum, this
alternating fashion, the instrument measures the masses of eluting                   methodology is applicable to any number of biological samples
peptide components in MS mode in one function and then carries                       (plasma, urine, whole-cell lysate, organelle, tissue, or microbial).
out a data-dependent CID for a subset of detected precursor
masses in MS/MS mode in a second function. However, the                              MATERIALS AND METHODS
                                                                                         Sample Preparation. Six aliquots of human serum (HS,
authors affirm that considerably more peptide peaks are detectable
                                                                                     Sigma source) were dispensed into separate eppindorf tubes
in full-scan MS mode than can be identified in the same time frame
                                                                                     (∼200 ug). An equimolar stock solution of exogenous proteins
using the collision-induced dissociation process. This level of
                                                                                     (yeast enolase and alcohol dehydrogenase, rabbit glycogen
inefficiency requires that additional MS/MS experiments would
                                                                                     phosphorylase, and bovine serum albumin and hemoglobin,
be needed for thorough identifications to be made in a given study.
                                                                                     MPDS proteins) was prepared such that each protein was present
    The use of MS technology in high-throughput proteomics faces
                                                                                     at 5 pmol/µL in 50 mM ammonium bicarbonate (pH 8.5). The
several challenges in order to accurately compare differentially
                                                                                     exogenous proteins were added to each of the six aliquots of
expressed proteins from corresponding peptide component infor-
                                                                                     human serum such that the final concentration of equimolar
mation, such as retention time, mass, and signal response.
                                                                                     proteins was 0.500, 0.250, 0.100, 0.050, 0.025, and 0.010 pmol/µL
Included among these challenges, software solutions for peak
                                                                                     (final volume of 200 µL), respectively. To avoid working under
detection, chromatographic spectral alignment, charge-state re-
                                                                                     the specified limits of the pipettor, appropriate dilutions of the
duction, and deisotoping need to be implemented in order to
                                                                                     stock solution were made to ensure that at least 10-20 µL of stock
reduce the complexity of the continuum MS data and successfully
                                                                                     protein solution, from a calibrated 20-µL pipettor, was added to
compare differences among samples. The Expression Informatics
                                                                                     achieve the desired final exogenous protein concentration. The
software, introduced in this study, has been developed to carry
                                                                                     volumes of the samples were adjusted to 100 µL with 50 mM
out these functionalities for comprehensive, quantitative, dif-
                                                                                     ammonium bicarbonate (pH 8.5) containing 0.05% RapiGest.25
ferential expression analysis.
                                                                                     Protein was reduced in the presence of 10 mM dithiothreitol at
    Although it has been observed that electrospray ionization
                                                                                     60 °C for 30 min. The protein was alkylated in the dark, in the
(ESI) provides signal responses that correlate linearly with
                                                                                     presence of 50 mM iodoacetamide, at room temperature for 30
increasing analyte concentration,15-17 historically, there have been
                                                                                     min. Proteolytic digestion was initiated by adding modified trypsin
concerns regarding nonlinearity of signal response and ion
                                                                                     (Promega) at a concentration of 75:1 (total protein to trypsin, by
suppression effects18-21 which have prevented the implementation
of a simple LC/MS solution for quantitative proteomics. We outline                   (20) Sangster, T.; Spence, M.; Sinclair, P.; Payne, R.; Smith, C. Rapid Commun.
                                                                                          Mass Spectrom. 2004, 18, 1361-1364.
(15) Purves, R. W.; Gabryelski, L. L. Rapid Commun. Mass Spectrom. 1998, 12,         (21) Mei, H.; Hsieh, Y.; Nardo, C.; Xu, X.; Wang, S.; Ng, K.; Korfmacher, W. A.
     695-700.                                                                             Rapid Commun. Mass Spectrom. 2003, 17, 97-103.
(16) Voyksner, R. D.; Lee, H. Rapid Commun. Mass Spectrom. 1999, 13, 1427-           (22) Bateman, R. H.; Hoyes, J. B. U.K. Patent 2,364,168A, 2002.
     1437.                                                                           (23) Purvine, S.; Eppel, J. T.; Yi, E. C.; Goodlett, D. R. Proteomics 2003, 3, 847-
(17) Chelius, D.; Bondarenko, P. J. Proteome Res. 2002, 1, 317-323.                       850.
(18) Muller, C.; Schafer, P.; Stortzel, M.; Vogt, S.; Weinmann, W. J. Chromatogr.,   (24) Geromanos, S.; Dongre, A.; Opiteck, G.; Silva, J. C. U.K. Patent 2,385,918A,
     B 2002, 773, 47-52.                                                                  2003.
(19) Matuszewski, B. K.; Constanzer, M. L.; Chavez-Eng, C. M. Anal. Chem.            (25) Yu, Y. Q.; Gilar, M.; Lee, P. J.; Bouvier, E. S. P.; Gebler, J. C. Anal. Chem.
     1998, 70, 882-889.                                                                   2003, 75, 6023-6028.

2188    Analytical Chemistry, Vol. 77, No. 7, April 1, 2005
weight) and incubated at 37 °C overnight. Each digestion mixture                than one charge-state, the corresponding area for any given
was diluted to a final volume of 200 µL with 50 mM ammonium                     monoisotopic ion is reported as the summed area from all
bicarbonate (pH 8.5) to reduce the concentration of RapiGest                    contributing charge states. The retention time is determined for
detergent to 0.025%. The tryptic peptide solution was centrifuged               each reported monoisotopic ion at the moment it reaches its
at 13 000 rpm for 10 min, and the supernatant was transferred                   maximum intensity (apex). Each detected component is referred
into an autosampler vial for peptide analysis via LC/MS. Each                   to as an AMRT (accurate-mass, retention time) component. An
sample was analyzed in triplicate. The LC/MS analysis was                       AMRT is extracted from the continuum data only if it exceeds a
performed using 10 µL of the final tryptic digest.                              user-defined, minimum detection threshold. The software is also
    HPLC Configuration. Capillary liquid chromatography (Ca-                    capable of processing the data using an autothreshold capability
pLC) of tryptic peptides was performed with a Waters CapLC/                     which automatically adjusts the ion detection threshold over time
Waters CapLC autosampler, equipped with a Waters NanoEase                       as a function of the dynamic range within the mass spectrometric
Atlantis C18, 300 µm × 15 cm reversed-phase column. The aqueous                 data. The culmination of this process produces an AMRT
mobile phase (mobile phase A) contained 1% acetonitrile in water                component list. This list contains many experimentally derived
with 0.1% formic acid. The organic mobile phase (mobile phase                   attributes for each of the recorded AMRT components (AMRTs).
B) contained 80% acetonitrile in water with 0.1% formic acid.                   Included in this output are the weight-averaged monoisotopic mass
Peptides were loaded onto the column with 6% mobile phase B.                    and charge state, the calculated mass deviation, the deisotoped
Peptides were eluted from the column with a gradient of 6-40%                   and charge-state-reduced sum intensity (centered by area), the
mobile phase B over 100 min at 4.4 µL/min, followed by a 10-min                 chromatographic area, the calculated intensity deviation, the
rinse of 99% of mobile phase B. The column was immediately                      observed apex retention time (centered by area), and the observed
reequilibrated at initial conditions (6% mobile phase B) for 20 min.            start and stop time for the ion detection of the corresponding
The lock mass, [Glu1]-fibrinopeptide at 100 fmol/µL (GFP), was                  AMRT.
delivered from the auxiliary pump of the CapLC at 1 µL/min to                       Clustering Peptide Components by Mass and Retention
the reference sprayer of the NanoLockSpray source.                              Time. One of the key operations required for the comparative
    Mass Spectrometer Configuration. Mass spectrometry analy-                   analyses of peptide mixtures is clustering chemically identical
sis of tryptic peptides was performed using a modified Waters/                  components together from replicate injections of the same sample
Micromass Q-Tof Ultima API to provide enhanced mass accuracy.                   as well as among multiple samples. The clustering algorithm
Detection events were acquired at 4 GHz. For all measurements,                  performs multiple binary comparisons to conduct the overall
the mass spectrometer was operated in V mode with a typical                     clustering strategy for a complete experiment.27,28 AMRT compo-
resolving power of at least 10 000. The spectrum integration time               nents from each injection are clustered to align identical compo-
was 1.8 s with an interscan delay time of 0.2 s. All analyses were              nents to one another on the basis of a mass precision and a
performed using positive-mode ESI using a NanoLockSpray                         retention time deviation threshold. In an initial binary comparison,
source. The lock mass channel was sampled every 30 s. The mass                  a subset of the AMRTs from two separate injections is compared
spectrometer was calibrated with a GFP solution (100 fmol/µL)                   to establish the experimental retention time deviation behavior
delivered through the reference sprayer of the NanoLockSpray                    of identical AMRTs between the two samples. The subset of
source. The doubly charged ion ([M + 2H]2+) was used for initial                AMRTs considered in the initial comparison is typically those
single point calibration (Lteff), and MS/MS fragment ions of GFP                above the median intensity for the entire data set. In the initial
were used to obtain the final instrument calibration. Data acquisi-             comparison, a coarse threshold of typically 5 min is applied to
tion was operated in the exact neutral loss mode, without an                    consider all potential paired candidates. Often, peptides may not
include list. Accurate mass LC/MS and LC/MSE data were                          reproducibly elute at exactly the same time throughout a replicate
collected using 10 eV for MS and 28-35 eV for MSE acquisition                   analysis. However, one generally observes a consistent shift in
such that one cycle of MS and MSE data was acquired every 4.0                   retention-time, whereby the observed retention time of a given
s. The RF offset was adjusted such that the LC/MS data were                     set of peptides will deviate systematically, although not necessarily
effectively acquired from m/z 300 to 2000, which ensured that                   by the same magnitude. Due to the complexity of the data, there
any masses observed in the LC/MSE data less than m/z 300 were                   often exist conditions under which an AMRT in one condition or
known to arise from dissociations in the collision cell.                        replicate will match within the threshold criterion to multiple
                                                                                AMRTs in a different replicate or condition. This, of course, is
RESULTS AND DISCUSSION                                                          not desirable, since an AMRT from one condition or replicate
   Ion Detection. The ion detection algorithm of the Expression                 should only match its identical companion in any other condition.
Informatics software uses a maximum likelihood algorithm to                     To address these situations, the clustering algorithm calculates
deisotope and charge-state-reduce the m/z detections to the                     the delta retention time for all matched AMRTs and plots the
corresponding monoisotopic m/z (MH+) for each scan of the                       retention time for each AMRT against the retention time difference
continuum LC/MS data.26 The algorithm also calculates the                       observed among the corresponding matched components (Figure
observed mass and intensity measurement deviation for every                     1A). In doing so, the algorithm can determine the expected
detected component. The chromatographic area associated with
each component is calculated using an integration algorithm                     (27) Li, G.-Z.; Gorenstein, M.; Geromanos, S.; Silva, J. C.; Dorschel, C. A.; Riley
similar to the ApexTrack peak integration algorithm provided in                      T. Proc. 52nd ASMS Conf. Mass Spectrom. Allied Top. 2004, TPY 354,
                                                                                     Nashville, TN.
the MassLynx software. If a particular component exists in more                 (28) Gorenstein, M.; Li, G.-Z.; Geromanos, S.; Silva, J. C.; Dorschel, C. A.; Plumb,
                                                                                     R. S.; Stumpf, C. L.; Riley, T. Proc. 52nd ASMS Conf. Mass Spectrom. Allied
(26) Skilling, J.; Bryan, R. K. Mon. Not. R. Astron. Soc. 1984, 211, 111-124.        Top. 2004, WPJ 161, Nashville, TN.

                                                                                           Analytical Chemistry, Vol. 77, No. 7, April 1, 2005               2189
Figure 1. (A) The AMRTs from two separate injections of the human serum spiked with 5 pmol of exogenous protein were clustered by mass
and retention time using the Expression Informatics software to associate identical components. The initial results of the clustering algorithm
are displayed by plotting the observed retention time deviation for all matched components versus the retention time of the first injection. Each
point represents a paired AMRT having the appropriate mass ((10 ppm) and retention time tolerance ((5.0 min) from the first pass of the
clustering algorithm. The red and blue lines define the corresponding upper and lower limits for the retention time tolerance used in the second
pass filter. The matched components outside these tolerances are examples of similar mass measurements existing at multiple retention times
within the 10 ppm mass tolerance. Although the absolute retention time deviation is ∼1.45 min throughout the entire chromatogram (min )
-1.05, max ) 0.40), the data indicate that the deviation of matched components at any given retention time does not exceed 0.5 min. (B) Using
the retention time deviations from the matched components of the raw data, within the narrow retention time tolerance of 0.5 min, the retention
times of the paired AMRTs are normalized and the redundant matched AMRTs are removed by eliminating those paired components outside
the fine retention time tolerance. (C) Mass precision measurements from the 3131 replicating AMRTs (in at least two out of three injections)
from the human serum samples containing 5.0 and 0.5 pmol exogenous proteins, whose replicate normalized intensity measurements were
below 30% Cv. The 3131 replicating AMRTs produced 13 963 individual mass measurements used to produce the histogram plot of the mass
precision. A total of 12 981 mass measurements were determined to have a mass precision of (3 ppm, which constitutes ∼93% of the data set.
(D). Coefficient of variation of the intensity measurements from the 3404 replicating AMRTs (in at least two out of three injections) from the
human serum samples containing 5.0 and 0.5 pmol exogenous proteins. The 3404 replicating AMRTs produced 5032 combined Cv measurements
from both samples and were used to produce the histogram plot of the coefficient of variation of the measured intensity. A total of 4557 of the
5032 Cv measurements were under 30%, which constitutes ∼90% of the data set. The average and median coefficient of variation from these
two data sets are 11 and 14%, respectively.

retention time deviations for a given set of peptides at any given         min is generally observed among paired components between two
moment throughout the chromatogram. The expected retention                 experiments. Figure 1A illustrates a single pairwise comparison
time deviations are modeled by monitoring the density of points            of a replicate injection of the same sample. If the chromatography
about a retention time deviation plot and determining the upper            were ideal, the retention time differences for all matched com-
and lower retention time deviation boundaries for any given binary         ponents would be 0, and the resulting plot would illustrate a
comparison. Only the matched AMRT component included within                straight horizontal line centered at zero deviation. Each point in
the defined retention time deviation boundaries are considered             the plot designates one paired set of components. Since many
to satisfy the matching criteria. Figure 1A illustrates such a plot.       components elute from the column at any moment in time, the
A fine retention time deviation threshold of typically less than 0.5       resulting plot should illustrate a dense scattering of points along
2190   Analytical Chemistry, Vol. 77, No. 7, April 1, 2005
the retention time coordinate. Figure 1A illustrates that the            measurements that are in dead time, there is a limit to its ability
reproducibility of the chromatographic peptide separation is ∼0.25       to accurately correct for those measurements.29,30 With this in
min, with an overall chromatographic deviation of 1.0 min. The           mind, the internal AMRT standards selected for normalization
pairwise comparison is performed for each of the replicate               were well below dead time and existed in all replicates of each
injections, as well as across the multiple experiments. The              sample. The average monoisotopic masses of the AMRTs used
retention time deviations observed between the AMRTs of two              for normalization were 1273.6547, 1706.7746, and 2171.1138, with
injections serve as multiple internal standards and are used to          corresponding elution times of approximately 42.60, 53.60, and
determine an appropriate retention time offset for AMRTs eluting         101.80 min, respectively. These AMRT components were endog-
at any moment. The retention time offsets are used to normalize          enous to human serum and were determined to originate from
the observed retention time for every AMRT component. The                transferrin (data not shown).31 Next, the algorithm calculates the
effects of the retention time normalization are illustrated in Figure    replication rate of each AMRT within and among all conditions.
1B. The output that is generated from the clustering routine is a        The algorithm also calculates the average mass, intensity, area,
large matrix, whereby identical components are aligned in each           combined charge-state, and retention-time for each AMRT for all
row for subsequent quantitative and statistical analysis. The            conditions. In addition, a standard deviation and coefficient of
assembled matrix will not only contain AMRTs which appear in             variation is determined for each of these measured attributes.
each of the conditions for each of the replicate injections, but may     Using this information, the software annotates those AMRTs
also include those AMRTs which appear reproducibly in one or             common and unique to each condition. Last, the algorithm
more of the six conditions.                                              performs binary comparisons for each of the conditions to
    To illustrate the level of specificity one is capable of obtaining   generate an average normalized intensity ratio (log) for all
with mass accuracy and retention time reproducibility, the               matched AMRTs and also performs a Student’s t-test for each
processed data can be queried at different retention time and mass       binary comparison. The final results of the clustering algorithm
precision tolerances. As an example, injection 2 of the human            can be exported as a comma-delimited text file containing all of
serum with 2 pmol of MPDS protein produced 2582 AMRTs. The               the mass spectrometric and chromatographic attributes for each
2582 AMRTs were queried to determine how many were within                AMRT, along with all of the mathematical and statistical calcula-
a (1-min retention time window and a 10 ppm mass tolerance.              tions generated after the clustering process. This clustered data
Using these tolerances, a total of 36 AMRTs (1.4%) were found to         file can be further manipulated or visualized in any of a number
coexist within these parameters. Therefore, these 36 AMRTs could         of commercially available software packages, such as Microsoft
potentially add ambiguity during the clustering process and lead         Excel or Spotfire Decision Site.
to incorrect clustering of the data. If the mass tolerance is allowed        The precision of the extracted mass measurements of the
                                                                         clustered components from the replicate injections of all samples
to expand to a 100-mDa error, the ambiguity is increases to a total
                                                                         were typically within (5 ppm of the mean mass measurement.
of 76 AMRTs (2.9%). At 1 Da, nominal mass, the ambiguity
                                                                         These data are illustrated in Figure 1C and demonstrate the
increases to a total of 657 AMRTs (25.4%). These errors are
                                                                         robustness of the ion extraction software and the stability of the
compounded if the tolerances of both the retention time and mass
                                                                         mass measurement instrumentation. In fact, 90% of the total
precision are allowed to expand. If the retention time tolerance is
                                                                         number of replicated components were measured with a precision
allowed to be within (5 min, then the following statistics are
                                                                         of (3 ppm. The reproducibility of the quantitative intensity
generated from the single data file: 293 AMRTs (11.3%) at 10 ppm
                                                                         measurements from the Expression Informatics software is
mass tolerance, 441 AMRTs (17.1%) at 100-mDa mass tolerance,
                                                                         summarized in Figure 1D. These results indicate that the coef-
and 1112 AMRTs (43.1%) at 1-Da tolerance. These results are
                                                                         ficient of variation (Cv) among the replicate injections and across
based on a single injection of a single sample. If one were to
                                                                         multiple samples were typically less than 15%, with a majority of
compare replicates among many different samples, this could lead
                                                                         the quantitative variation lying between 11 and 14% Cv. These
to a significant number of AMRTs being clustered incorrectly and
                                                                         observations are typically expected from the Expression Infor-
thereby produce highly irreproducible results. Having an LC/MS
                                                                         matics software when using standard protocols for efficient sample
instrumentation platform that is capable of providing reproducible
                                                                         preparation.32
mass precision and accuracy along with reproducible chromatog-
                                                                             Expression Analysis of AMRT Components. The purpose
raphy will significantly increase the quality of the clustered data
                                                                         of these experiments was to demonstrate that the Expression
and will provide a more robust quantitative proteomics platform.
                                                                         Informatics software could ascertain the relative change in
    Data Normalization and Statistical Analysis. Once the
                                                                         abundance of a small subset of proteins (MPDS proteins) spiked
AMRT data have been clustered, the clustering algorithm per-
                                                                         into a complex protein background (human serum). The MPDS
forms a number of mathematical and statistical calculations for
the entire data set. To correct for injection variability and total      (29) Rockwood, A. L.; Fabbi, J. C.; Harris, L.; Davis, L.; Lee, E. D.; Ogden, C.;
                                                                              Tolley, H.; Gunsay, M.; Sin, J. C. N.; Lee, H. G. Proc. 45th ASMS Conf. Mass
protein load across samples, the intensity measurements for the               Spectrom. Allied Top. 1997, WOE 0250, Palm Springs, CA.
entire data set are normalized. The intensity measurements of all        (30) Barbacci, D. C.; Russel, D. H.; Schultz, J. A.; Holocek, J.; Ulrich, S.; Burton,
detected AMRTs from each injection are normalized to a set of                 W.; Van Stipdonk, M. J. Am. Soc. Mass Spectrom. 1998, 9, 1328-1333.
                                                                         (31) Silva, J. C.; Richardson, K.; Young, P.; Denny, R.; Neeson, K.; McKenna,
AMRTs (endogenous or exogenous) that are known not to have                    T.; Dorschel, C. A.; Li, G.-L.; Gorenstein, M.; Riley, T.; Geromanos, S. Proc.
changed among the different samples. The internal AMRT                        52nd ASMS Conf. Mass Spectrom. Allied Top. 2004, MPX 452, Nashville,
standards used for normalization purposes were required to be                 TN.
                                                                         (32) Dorschel, C. A.; Gorenstein, M.; Li, G.-Z.; Silva, J. C.; Geromanos, S.; Riley,
present in all six experiments. Although the Expression Infor-                T. Proc. 52nd Ann. ASMS Conf. Mass Spectrom. Allied Top. 2004, TPY 458,
matics software is capable of correcting the mass and intensity               Nashville, TN.

                                                                                    Analytical Chemistry, Vol. 77, No. 7, April 1, 2005                2191
Figure 2. (A) The base peak intensity (BPI) of human serum with five equimolar exogenous proteins spiked at decreasing levels (5.00, 2.00,
1.00, 0.50, 0.25, and 0.10 pmol), (B) the selected ion chromatogram (SIC) of the doubly charged peptide ion, 724.34 ((0.05 m/z). The
corresponding SICs were integrated using MassLynx processing software between 68.00 and 71 min. Processing parameters were set for
automatic noise measurement, Savitzky-Golay smoothing (three channels, two smoothes), and ApexTrack peak integration. (C) The continuum
mass spectrum at the apex of the corresponding 724.34 selected ion chromatogram in panel B (from 600 to 825 m/z). (D) The lock-mass-
corrected, centroided mass spectrum of the 724.34 isotope cluster (between 722 and 729 m/z) from panel C (smoothing: Savitzky-Golay,
three channels, two smoothes; centering: three channels, centroid top 80%, centered by area) and lock-mass-corrected against the monoisotopic
ion of Glu-Fib, 785.8426 m/z).


proteins were spiked at levels well below that of the most abundant      2C is normalized to the highest ion in the spectrum to illustrate
proteins in the complex background. Six samples were prepared            the dilution of the 724.41 MH2+ ion over the six different
to reflect a dilution series of the MPDS proteins ranging from 10        concentrations. The data presented in each spectrum illustrate a
to 500 fmol/µL. The samples were digested with trypsin as                very high degree of similarity with respect to the other coeluting
described in the Material and Methods Section, and the resulting         peptides in the background of human serum. This similarity is
polypeptide mixtures were analyzed in triplicate by LC/MS.22-24          reflected not only in the number of ions present in each scan but
To demonstrate that the quantitative information relating to the         also in the correlation among their respective intensities and
MPDS proteins was available in the acquired LC/MS data, a                relative intensity ratios. The degree of chromatographic reproduc-
manual analysis was performed on a previously characterized              ibility is further supported, at the global level, from the Expression
AMRT (m/z 724.41 at 69.5 min). Figure 2A depicts six total ion           Informatics processing and analysis of the clustered AMRTs
chromatograms (TICs) obtained from the LC/MS acquisitions.               obtained from each of the replicate analyses, as will be illustrated
For the sake of space, only one replicate TIC is illustrated for         later. Figure 2D depicts each spectrum after it has been smoothed
each of the six different samples. The TICs illustrate a high degree     (Savistky-Golay smoothing, three channels, two smoothes),
of similarity among the six different samples, despite an overall        centered (three channels, 80% of the centroid top, centered by
50-fold change in the relative levels of MPDS peptides throughout        area), and lock-mass corrected against the monoisotopic ion of
the six samples. Figure 2B illustrates the selected ion chromato-        GFP (m/z 785.8426). Comparison of the lock-mass-corrected mass
grams (SICs) for the m/z 724.41 (z ) 2, MH2+) ion at ∼69.5 min           measurements obtained from the six individual samples (m/z
and the associated integrated peak areas, as determined by               724.41, MH2+) reflects the level of mass precision obtained from
MassLynx. The identity of this peptide was validated by DDA to           this methodology. It also establishes that one can use an LC/
use as a proof-of-concept model for the subsequent quantitative          MS-based approach for relative quantitation of peptide components
comparison (data not shown, VVGLSTLPEIYEK peptide from                   in a complex protein sample, provided that sufficient mass and
yeast ADH). Figure 2C illustrates the six individual MS spectra          retention time reproducibility are obtained. Table 1 outlines the
obtained from each sample at the chromatographic apex of the             results obtained from the manual interrogation of the raw data
SIC in Figure 2B (m/z 724.41). Each spectrum presented in Figure         using the commercially available MassLynx software. The inte-
2192 Analytical Chemistry, Vol. 77, No. 7, April 1, 2005
Table 1. Summary Table of the Manual and Automated Analysisa

                                                            manual processing                                  automated processing
                                                              (MassLynx)                                      (Expression Informatics)
 human serum + exogenous        theoretical                                    calcd      error                                    calcd      errorl
      proteins, pmol               ratiob       intc      MH+ d       ppme     ratiof      (%)g     inth       MH+ i       ppmj    ratiok      (%)
         5.00                       1.0       15871     1447.8134      5.9       1.0              545213     1447.8112     -4.4      1.0
         2.00                       2.5        5498     1447.8082     -2.3       2.9      15.2    205709     1447.8151     -7.1      2.7       8.0
         1.00                       5.0        2775     1447.8062     -0.9       5.7      14.2    107305     1447.8086     -2.6      5.1       2.0
         0.50                      10.0        1584     1447.8082     -2.3      10.0       0.1     51992     1447.8089     -2.8     10.5       5.1
         0.25                      20.0         688     1447.7998      3.5      23.1      15.3     23808     1447.8102     -3.7     22.9      14.4
         0.10                      50.0         343     1447.8042      0.4      46.3      -7.5     10885     1447.8121     -5.0     50.1       0.2
         RMS error                                                     3.1                 5.4                              4.6                3.5
   a The mass measurements and signal response measurements obtained from manual analysis using MassLynx software and automated processing
using the Expression Informatics software for the 1447.8048 monoisotopic ion (at ∼69 min) originating from the VVGLSTLPEIYEK peptide of
Yeast ADH are described in the Table. b The theoretical relative ratio for the spiked ADH peptide. c The integrated peak measurement obtained
using ApexTrack peak integration in Masslynx. d The calculated monoisotopic mass from the lock-mass-corrected measurement of the 12C isotope
of the doubly charged ion cluster. e The corresponding ppm error obtained using the Masslynx software when compared to the theoretical
monoisotopic mass, 1447.8048. f The calculated relative ratio of each condition compared to the 5 pmol condition from the measured peak response.
g The relative percent error between the calculated relative ratio and the theoretical relative ratio. h The integrated peak measurement obtained
using the peak integration algorithm in the Expression Informatics software. i The calculated monoisotopic mass from the lock-mass corrected
measurement of the doubly charged ion cluster using the maximum entropy algorithm in the Expression Informatics software. j The corresponding
ppm error obtained using the Expression Informatics software when compared to the theoretical monoisotopic mass, 1447.8048. k The calculated
relative ratio of each condition compared to the 5 pmol condition from the measured peak response. l The relative percent error between the
calculated relative ratio and the theoretical relative ratio.


grated peak area and accurate mass measurement of the monoiso-               human serum peptides throughout the dilution series. Though
topic ion for each sample is indicated in Table 1. In addition, the          the data presented in Figures 2 and 3 and Table 1 are quite
observed mass error (ppm) has been determined, along with the                encouraging, the challenge hinges on creating a software process-
corresponding calculated response ratios for each of the samples,            ing package that is capable of automating the process, whereby
when compared to the 5-pmol sample. Upon manual interrogation                hundreds or thousands of TICs can be compared quantitatively.
of the raw continuum data, the overall quantitative accuracy is                  Table 2 illustrates the number of AMRTs obtained from each
within (10%. The average mass accuracy obtained from MassLynx                replicate of each sample, along with the associated combined
for the yeast, ADH peptide (724.41 m/z, z ) 2) was below 5 ppm               intensity for all extracted AMRTs (after normalization). The
(RMS). Table 1 illustrates that the information is available in the          variability associated with the number of extracted AMRTs is
raw continuum data to display the relative change in abundance               presented in Table 2 and illustrates a high degree of reproduc-
of the yeast ADH protein (from 5000 to 100 fmol) in the complex              ibility across replicate injections. However, the data also illustrate
background of human serum. The quality of the mass spectro-                  a steady decrease in the number of AMRTs reported along with
metric data is highlighted in Table 1, which contains the average            a decrease in the combined intensity as one examines those
accurate mass measurement and corresponding parts-per-million                samples containing the highest concentration of exogenous pro-
error for the test AMRT in each of the separate samples. It also             teins to the lowest concentration exogenous proteins. We plotted
includes the average normalized intensity and the corresponding              the change in the average number of AMRTs and total intensity
intensity ratios from the manual analysis of the yeast ADH peptide           versus the spiked protein concentration for the six samples and
across all the six experiments.                                              found the data to be linear with R2 values of 0.9878 and 0.9838,
    The 18 LC/MS experiments were processed with the Expres-                 respectively (data not shown). Since the background of human
sion Informatics software for a profiling analysis study. The                serum proteins should not change from sample to sample, it is
Expression Informatics results of the same AMRT described                    our contention that the associated y intercepts of 1964 AMRTs
earlier (m/z 724.41 MH2+, 1447.81 MH+) produced an average                   and 7.0 × 10⁷ intensity counts represent the basal level (number
mass precision error below 5 ppm (4.1 ppm, RMS) and an average               and associated intensity) of AMRTs present in the human serum.
quantitative error of ∼5%. The results obtained from the automated               The 18 resulting xml files were generated from the continuum
processing of the raw continuum data were, thus, in agreement                LC/MS data using the Expression Informatics software and
with the manually obtained data from MassLynx, described above.              contained both the mass spectrometric and chromatographic
The response curves generated from the manual and automated                  attributes for all extracted AMRTs. The xml files were processed
processing of the VVGLSTLEPIYEK tryptic peptide from yeast                   using the associated clustering algorithm to group identical
ADH is illustrated in Figure 3A. These data demonstrate the                  AMRTs across the replicate injections for all the six samples. In
consistency between the two data processing methods, whereby                 the replicate analysis of the human serum with 5 pmol of MPDS
the two normalized response curves are nearly coincident, with               protein, 68% of the total AMRTs were replicated in three out of
an overall correlation coefficient of 0.999. The results show the            three injections (2577 AMRTs of the 3797 total clustered AMRTs).
linearity of the two data processing methods across the 2 orders             The 2577 replicating AMRTs consisted of ∼87% of the total
of magnitude dynamic range inherent in the outlined experiments.             detected intensity. The overall trend suggests that the missing
Interestingly, the linear response of the exogenous ADH peptide              observations are due to the ion detection threshold parameters.
(724.41 MH2+) seems to illustrate little or no ion suppression               Decreasing the stringency to two out of three replicate injections
effects which may have resulted from the high background of                  resulted in 85% of the total AMRTs and constituted 95% of the
                                                                                        Analytical Chemistry, Vol. 77, No. 7, April 1, 2005    2193
Figure 3. (A) The response curves of the doubly charged polypeptide ion (observed 724.34 m/z, VVGLSTLEPIYEK peptide from yeast ADH)
at ∼69 min from manual interrogation and automated processing of the spiked human serum data. The response measurements were normalized
to the maximum observed response from the corresponding dilution series. (B) A subset of 25 response curves obtained from the output of the
clustering tool of the Expression Informatics software. The clustered output file was imported into Spotfire, and the data were parsed by the
average monoisotopic mass from all replicates of each sample using the trellis option in Spotfire. The average monoisotopic mass for each
AMRT component is indicated at the top of each plot. Those AMRTs associated with the human serum (rows 1-4) did not change throughout
the dilution series and are indicated by those response curves with a slope of 0, whereas all of those AMRTs that are associated with the
exogenous proteins have a similar positive slope (row 5). The AMRTs were validated to each of the corresponding exogenous proteins: 1422.7261
MH+, EFTPVLQADFQK (vovine hemoglobin (R-chain)); 1529.7344 MH+, VGAHAGEYGAEALER (bovine hemoglobin (β-chain)); 1576.7762
MH+, LKPDPNTLCDEFK (bovine albumin); 1578.8098 MH+, VDDFLLSLDGTANK (yeast enolase), and 1580.8387 MH+, QIIEQLSSGFFS PK
(rabbit phosphorylase B).


total detected intensity. In the replicate injection of the 5-pmol           A total of 1776 AMRTs were found in common to all replicates
condition, the average intensity measurement for those AMRTs             of all six samples, constituting an average combined intensity of
which replicated in three out of three injections was 36 666 counts,     7.12 ×10⁷ counts. These results are consistent with the hypothesis
whereas the average intensity measurements for the AMRTs                 regarding the basal level of the human serum AMRTs found to
which replicated in either two or three out of three injections was      replicate among the six samples. Though one may suspect the
13750 and 8411 counts, respectively. Lowering the ion detection          total number of AMRTs to be low, considering the complexity of
threshold increases the number of AMRTs reported but also                the background of human serum peptides, it should be noted that
lowers the total fraction of replicating AMRTs. In addition,             the purpose of this study is to verify that the Expression
lowering the ion detection threshold does not dramatically affect        Informatics software identifies the appropriate change in relative
the fraction of total intensity attributed to the replicating AMRTs.     abundance among the spiked MPDS peptides. The ion detection
2194 Analytical Chemistry, Vol. 77, No. 7, April 1, 2005
Table 2. Summary Table of the Ion Detection Resultsa

        sample                 inj 1           inj 2           inj 3        CV, %           inj 1             inj 2              inj 3         CV, %
                                            5 pm ProStds HsSera                                            2 pm ProStds HsSera
 AMRTs                      3142            3231          3212              1.47        2382               2582          2758                  7.31
 normalized intensity       1.04 × 10⁸      1.03 × 10⁸    9.90 × 10⁷        2.59        8.40 × 10⁷         8.58 × 10⁷    8.85 × 10⁷
                                                                                                                                               2.66
                                            1 pm ProStds HsSera                                            0.5 pm ProStds HsSera
 AMRTs                      2383            2087          2244              6.62        2005               2062           2106                 2.46
 normalized intensity       7.61 × 10⁷      8.22 × 10⁷    8.18 × 10⁷        4.27        7.56 × 10⁷         7.46 × 10⁷     7.97 × 10⁷           3.57
                                            0.25 pm ProStds HsSera                                         0.1 pm ProStds HsSera
 AMRTs                      2012            1939          2058              3.00        1972               2002           1923                 2.03
 normalized intensity       8.00 × 10⁷      7.27 × 10⁷    8.12 × 10⁷        5.88        7.79 × 10⁷         7.08 × 10⁷     7.38 × 10⁷           4.81
   a The total number of AMRTs is indicated for each replicate analysis of the six human serum samples. The sum of the normalized intensity for
each replicate injection is listed below each of the corresponding total AMRT values. The coefficient of variation of the extracted AMRTs and their
associated normalized intensity is calculated for each replicate injection. The ion detection parameters were set up to extract those multiply charged
ions (charge states between 2 and 6) which exceeded 200 counts (center by area, after deisotoping).


threshold was set to generate AMRTs which spanned 3-4 orders                  behavior, and by extension, may be related to the same protein,
of magnitude dynamic range within a given sample. The MPDS                    metabolic, or regulatory pathway(s).33,34
proteins were spiked into the human serum at levels such that                     Figure 4A illustrates a diagonal plot of the log of the average
their intensities were within this window of dynamic range. By                normalized intensity for matched AMRTs from the 5-pmol mixture
applying these threshold parameters, we were able to demonstrate              (x axis) versus the 2-pmol mixture (y axis). The data illustrate
the appropriate response with the ADH peptide and, therefore,                 two distinct clusters of ions spanning close to 4 orders of
continue with the analysis to characterize the remaining AMRTs.               magnitude dynamic range in ion detection and share 2997
    The clustering results were exported from the Expression                  matched AMRT component pairs between the two conditions. The
Informatics software and imported directly into Spotfire for                  data points are colored by their respective t-test score of the
evaluation. With identical components clustered across the                    normalized intensities for all replicate injections between the two
replicate injections of the six samples (dilution series), one can            conditions to illustrate that the variance between the two condi-
readily obtain response curves for each of the clustered compo-               tions is statistically significant. The yellow data points illustrate
nents. Figure 3B illustrates response curves for a subset of                  those matched AMRT components with a t-test score of <0.01,
clustered AMRTs, in which the average normalized intensity is                 indicating that there is less than a 1% chance that the observed
plotted as a function of the quantity (femtomole) of spiked MPDS              change is not due to the applied perturbation. Although more
proteins. The bottom five plots represent an individual peptide               sophisticated multicomponent statistical methods could be per-
from four of the remaining five exogenous proteins. All of these              formed on these data, all the comparisons in this work were
response curves have a similar slope that is indicative of the                performed using a binary Student’s t-test. The t-test was performed
configured serial dilution. The response curves in Figure 3B                  on only the highly reproducible AMRTs which were found to be
correspond to extracted AMRTs that replicated in all six samples              in the majority of the replicates for each of the two test conditions
of human serum with the exogenous proteins. The AMRTs with                    (at least two out of three). In the presentation of this work, there
the experimentally determined monoisotopic m/z of 1422.7261,                  was no attempt to correct for missing data. If an AMRT occurred
1529.7344, 1576.7762, 1578.8098, and 1580.8387 represent peptides             in only one out of three replicate injections in either of the two
from bovine hemoglobin (β-chain), bovine hemoglobin (R-chain),                conditions, the AMRT was ignored in the subsequent quantitative
bovine albumin, yeast enolase, and rabbit phosphorylase B,                    processing. Since this approach does not require the use of
respectively. The mass accuracies associated with these corre-                enrichment techniques, there is quite a bit of peptide redundancy
sponding peptides are all within ( 5 ppm of the theoretical tryptic           for each representative protein in the sample. By not limiting the
peptide mass. All of the plots for the remaining AMRTs have a                 number of peptides per protein, we can afford to use a conservative
slope of 0 and, therefore, correspond to background serum                     approach to our data reduction scheme and propogate the highest
peptides that do not change in relative concentration across the              quality data into the quantitative processing without jeopardizing
six individual samples. For the point of this illustration, the x axis        the number of proteins that can be quantified and subsequently
corresponds to the concentration of spiked exogenous proteins.                identified. In Figure 4A-E, the blue data points are those AMRTs
In a biomarker discovery study, the concentration dependence                  that did not exhibit any change due to the applied perturbation
could easily be replaced by a time course or different perturba-              as defined by the Student’s t-test (>0.01). The red data point
tions, such as drug dosage or environmental conditions. The ability           highlights the AMRT described in Table 1, for the purpose of the
to display these response curves (or conditional profiles) for all            manual analysis and comparison to the automated processing.
matched AMRTs enables one to perform comprehensive global
                                                                              (33) Mirkin, B. Mathematical Classification and Clustering, Nonconvex Optimiza-
comparisons rather than multiple binary comparisons. Using this                    tion and Its Applications; Pardalos, P., Horst, R., Eds.; Kluwer Academic
approach, the AMRTs can be rapidly screened and characterized                      Publishers: The Netherlands, 1996, Chapter 11.
on the basis of their collective behavior across the multiple                 (34) MacQueen, J. Some Methods for Classification and Analysis of Multivariate
                                                                                   Observations. In Proceedings of the Fifth Berkeley Symposium on Mathematical
conditions. Self-organizing maps (SOMs) or k-means clustering                      Statistics and Probability; Le Cam, L. M., Neyman, J., Eds.; University of
techniques can be used to associate AMRTs that exhibit the same                    California Press: Berkeley and Los Angeles, CA; Vol 1, pp 281-297.

                                                                                         Analytical Chemistry, Vol. 77, No. 7, April 1, 2005            2195
Figure 4. Diagonal plots of the normalized log intensity. (A) Comparison of clustered AMRTs between human serum with 5.0 pmol of exogenous
protein mixture versus human serum with 2.0 pmol of exogenous protein mixture. For each matched AMRT component, the average log intensity from
each condition is plotted along each of the two axes. The data are presented without applying any statistical filters, which are obtained from the clustered
data set. (B) Same comparison as illustrated in Panel A; however, the data have been filtered using a number of the available statistical measures
obtained from the clustering tool of the Expression Informatics software. The data have been filtered to show only those matched AMRTs which were
found to have a coefficient of variation of the normalized intensity of e30% among the replicate injections, (minimum two out of three replicates per
condition), as well as an observed mass precision of e10 ppm among the replicate injections. (C) Comparison of clustered AMRTs between human
serum with 5 pmol of exogenous protein mixture versus human serum with 0.1 pmol of exogenous protein mixture after applying the statistical filter
described above. (D) Comparison of clustered AMRTs between human serum with 5.0 pmol of exogenous protein mixture and human serum with 1.0
pmol of exogenous protein mixture after applying the statistical filter described above. (E) Comparison of clustered AMRTs between human serum with
0.50 pmol of exogenous protein mixture and human serum with 0.25 pmol of exogenous protein mixture after applying the statistical filter described
above. The data presented in all panels are colored by binned probability score (p score) from a binary Student’s t-test. Those AMRTs which had a
probability score of e0.01 are yellow, whereas those that are >0.01 are blue. The red data point corresponds to the monoisotopic ion of 1447.8048, which
originates from the VVGLSTLPEIYEK peptide of yeast ADH. The interpolated black line corresponds to the expected fold change for each binary comparison.

2196   Analytical Chemistry, Vol. 77, No. 7, April 1, 2005
Figure 5. (A) A scatter plot of the average normalized intensity of the clustered AMRTs versus their corresponding coefficient of variation
among the replicate injections for human serum spiked with 5 pmol of exogenous protein versus human serum spiked with 2 pmol of exogenous
protein. The blue data points represent 1840 AMRTs which satisfy the statistical filters described in Figure 2B, whereas the red data points
illustrate the 1157 AMRTs that were removed during the filtering process. (B) A histogram plot of the corresponding fold changes determined
among the 1840 AMRTs which met the applied statistical measures.


From this analysis, it is suggested that the yellow data points          AMRT from the filtered data versus the observed coefficient of
represent peptides from the MPDS proteins, whereas the blue              variation for the entire clustered data set. The blue data points
data points originate from peptides from human serum proteins.           are the subset of 1840 AMRTs which meet the statistical
The information that is provided from this methodology allows            parameters described above. As expected, the data illustrate that
one to apply user-defined thresholds to the resulting statistical        the statistical filtering process had the most significant effect on
analysis performed on any of the experimental attributes relating        the lowest intensity AMRTs, since they will be most influenced
to each AMRT cluster, as well as a minimum replication rate within       by coeluting AMRTs and will therefore tend to exhibit the highest
and across conditions as a means to extract the highest quality          variability (Cv).
data for subsequent quantitative analysis. Figure 4B depicts 1840             Manual inspection of the clustered output of the replicate
(61.4%) of the matched AMRT component pairs from Figure 4A               injections of the 5-pmol condition indicated that less than 80 of
after applying a specific set of statistical thresholds to reveal the    the AMRTs determined to be found in only one out of three
highest quality data. These statistical measurements are provided        replicate injections could have been associated with an AMRT
by the Expression Informatics software and are included in the           determined to have replicated in only two out of three replicate
corresponding output file. In this instance, the data were filtered      injections. In this particular example, this represents a false
by (1) applying a replication requirement, in which corresponding        clustering rate of ∼2%. However, since only the AMRTs found to
AMRTs must exist in at least two out of the three replicate              replicate in only one out of three injections are eliminated from
injections for each condition, (2) requiring that the coefficient of     the quantitative processing, the information describing these
variation for the normalized intensities of an AMRT be e30% and          potentially discarded AMRTs is still captured in those AMRTs
(3) requiring that the mass precision of clustered AMRTs be <10          which occurred in two out of three injections.
ppm across all samples. After applying the statistical thresholds,            One of the key features of this methodology is that it is an
1840 of the initial 2997 matched AMRTs (61.4%) remained to               unbiased approach. The method does not require prescreening
illustrate the two distinct sets of peptides, the unaffected human       of polypeptide pools for those peptides that contain specific amino
serum peptides and the affected MPDS peptides. The breadth of            acids. This unbiased approach produces significantly more peptide
each group of ions along the two diagonals is influenced by the          ions per protein than some other quantitative methodologies which
degree of variability inherent to the analytical method and will         utilize isotope-coded affinity tags. In addition, the quantitative
determine the confidence interval for a specific fold change.            nature of this methodology allows the user to apply statistical
Interestingly, the 1840 statistically significant AMRTs represent        methods to remove polypeptide ions (AMRTs) that exhibit
>90% of the total average normalized intensity found in each             questionable reproducibility from further consideration without
condition. A total of 724 of the 2997 AMRTs were attributed to           jeopardizing the ability to find lower level changes. Figure 5B
AMRTs which occurred in only one out of the three replicate              depicts a histogram plot of the observed fold change for the 1840
injections, an additional 384 AMRTs had coefficients of variation        filtered AMRTs. The data presented illustrate two Gaussian
>30%, and 49 AMRTs had mass precision errors exceeding 10                distributions about the x axis which are centered at values of 1.0
ppm. This indicates that the most variable data are due to the           and 2.5. These values correlate with the predicted results for the
lower intensity AMRTs, as can be seen in Figure 5A. Figure 5A            serum-related peptides (no change) and the spiked exogenous
depicts a scatter plot of the average normalized intensity of each       peptides (2.5-fold change).
                                                                                  Analytical Chemistry, Vol. 77, No. 7, April 1, 2005   2197
Figure 4CD represents two additional diagonal plots of the log       AMRTs (tryptic peptides) that will exhibit the same change in
average normalized intensity of the 5-pmol mixtures versus both          expression within some reasonable tolerance. It is suggested that
the 100-fmol and 1-pmol mixtures. The results from Figure 4C             the use of accurate mass in conjunction with the quantitative fold
begin to test the limits of this methodology. At 100 fmol of spiked      change provides additional specificity to allow rapid screening of
MPDS protein, we are approaching the limit of detection for the          complex protein mixtures for targeted proteins of interest which
300-µm scale chromatography selected for these series of experi-         exhibit a change in relative abundance. In instances for which
ments. This can manifest itself in the results by attenuating the        further validation is needed, the user has the ability to construct
expected fold change, producing more scatter between the upper           a targeted include list for subsequent MS/MS analysis from the
and lower limits of the expected fold change. In addition, it should     accurate mass and retention times (AMRTs) obtained from the
be noted that there are a number of peptides from the exogenous          LC/MS acquisition. However, the parallel LC/MS and LC/MSE
MPDS proteins that are chemically identical to a subset of the           strategy implemented for this analysis contains not only the
human serum proteins. Among these are human serum albumin                precursor ion information but also the associated fragment ion
and human hemoglobin. These chemically identical peptides will           information from all the observed precursors and allows one to
show an attenuated fold change as a function of their relative           identify the precursor ions without having to perform the targeted
abundance over that of the endogenous peptide. Figure 4E                 MS/MS experiment.31 Low-energy precursor data are collected
illustrates the 250-fmol mixture versus the 100-fmol mixture. These      into function 1, while the associated elevated-energy data are
plots illustrate two distinct ion distributions of AMRTs, which          collected into the second function. The low-energy precursor ions
correlate with the relative concentration change of the MPDS             are associated with their corresponding high-energy fragment ions
proteins between the two samples as well as those unaffected             using the obtained chromatographic attributes. In this type of
human serum proteins. The blue data points represent those               experiment, the software uses both the low- and elevated-energy
AMRTs that do not show any relative change with statistical              data for qualitative assignment.20
significance between the two conditions (human serum proteins);               The data presented in this manuscript illustrate that the
the yellow data points represent those peptide components that           Expression Informatics software is capable of reducing large sets
do exhibit statistically significant changes between the two             of LC/MS analyses from complex protein mixtures to a simple
conditions (MPDS proteins).                                              list of AMRT components that have undergone a change in relative
    To confirm the quantitative results illustrated in Figure 4A-        abundance due to the applied perturbation. These capabilities are
E, we performed a simple peptide mass fingerprinting search using        provided for by the use of the ion detection, clustering, and
the average mass measurement of each AMRT that was found in              quantitative functionalities. Having the ability to reduce these
at least two out of three replicate injections from all six conditions   complex protein mixtures to a simple list of AMRT components
with a t-test probability score of e0.01 (67 AMRTs in all). We           greatly simplifies the problem of properly identifying the proteins
searched a Swissprot database of over 200 000 entries at 5 ppm           affected by the applied perturbation. In many cases, a subsequent
mass accuracy with no missed cleavages and required four                 protein identification from such complex protein mixtures can be
minimum peptides to match. The search results accounted for              ascertained from a simple peptide mass fingerprint of the specific
59 of the 67 total AMRTs. The 59 AMRTs identified 47 proteins            AMRTs within a given fold change window. To illustrate this
by peptide mass fingerprint, which included the 5 spiked in              powerful capability, we conducted a PMF search with only those
proteins (MPDS proteins) as well as 37 isoforms of the MPDS              AMRTs present in at least two out of the three replicate injections
proteins from different species, including 23 different isoforms of      for all conditions (5000-100 fmol MPDS proteins), with Cv’s of
glycogen phosphorylase. Last, the final five identifications were        the associated replicating intensities of under 30%, with a mass
examples of very high molecular weight proteins (>120 kDa)               precision of under 10 ppm, and illustrating a fold change with a
which have tryptic peptides with monoisotopic masses in common           t-test score of <1% (Figure 4). The PMF search was queried
with the MPDS proteins. The level of redundancy is not surprising,       against a human database of 27 000 entries along with the five
since the search was performed using a non-species-specific              exogenous proteins and was conducted without considering any
database. In a true biomarker discovery experiment, the peptide          missed cleavages and with a mass accuracy of <10 ppm. The PMF
mass fingerprint would most likely be restricted to a nonredundant       search returned 33 peptides from rabbit glycogen phosphorylase,
database of a specific organism to reduce the number of isoforms         18 peptides from bovine serum albumin, 14 peptides from yeast
one may obtain from the homology/identity found in a cross-              enolase, 12 peptides from yeast alcohol dehydrogenase, 4 peptides
species database.                                                        from bovine hemoglobin (R), and 7 peptides from bovine hemo-
    If we had spiked the proteins in at different concentrations,        globin (β). Among the set of identified exogenous proteins, the
we could have used the quantitative fold change of the AMRTs             peptide VVGLSTLEPIYEK (1447.8048 MH+) was among the 12
as an additional filter or scoring mechanism to eliminate the            peptides matched to yeast alcohol dehydrogenase. This peptide
wrongfully assigned high molecular weight protein assignments.           was one of the most intense peptides from yeast ADH and
We also suggest that the use of accurate mass in conjunction with        exhibited a linear response when spiked into human serum, from
fold change is a powerful strategy for MS-based protein identifica-      100 to 5000 fmol (Figure 3A).
tion. Since enzymatically digested proteins typically produce many            Figure 6 shows the 19 peptides matched from bovine serum
peptides and this methodology does not limit the number of               albumin via the PMF search. The average normalized intensity
observed peptides per protein through the use of any type of             values are plotted for each of the albumin peptides for each of
affinity capture enrichment protocol, proteins which exhibit a           the six conditions (5000 to 100 fmol, on column). It is clear from
relative fold change in expression will produce a number of              this illustration that not all peptides ionized with sufficient
2198   Analytical Chemistry, Vol. 77, No. 7, April 1, 2005
Figure 6. Intensity profiles for characterized bovine serum albumin peptides. The AMRTs which originated from bovine serum albumin were
identified by PMF. The identities of the corresponding bovine serum albumin AMRTs were correlated to the clustered output file. The average
intensity measurements for each of the bovine serum albumin peptides (AMRTs) are plotted from each of the six conditions.


efficiency to be detected in all six conditions. In addition, as the    mass spectrometric attributes from an LC/MS analysis of a
concentration of the protein was decreased, the number of               complex protein digest in a quantitatively reproducible manner.
detected peptides decreased in a predictable manner. The                Additionally, the ion detection and clustering capabilities provided
observed peptides exhibit a characteristic ionization pattern that      in the Expression Informatics software demonstrated that one can
is consistent throughout the six experiments. The continuity of         monitor slight changes in relative abundance among different
the ionization pattern illustrates the level of reproducibility one     conditions without requiring the use of isotopic or metabolic
can obtain with ESI-mass spectrometry. This ionization pattern          labeling strategies. The analytical protocols employed in this study
serves as a characteristic feature (ionization map) for the tryptic     demonstrate that the combination of accurate mass and chro-
peptides of bovine serum albumin and can be taken into account          matographic retention time, in conjunction with other measured
for future characterization of this protein. These results indicate     attributes, such as fold change and ion intensities, can provide a
that the two bovine serum albumin peptides, LGEYGFQNALIVR               unique signature for each peptide contained in a complex protein
and HLVDEPQNLIK, are the two most efficiently ionized tryptic           digest mixture. We believe that there is ample literature precedent
peptides. Using this information, it is not surprising that the least   to indicate that electrospray time-of-flight mass spectrometry is
intense peptides observed at the 5-pmol level are not observed at       clearly capable of producing quantitative results for peptide ions
either the 100 or 250 fmol level (LCVLHEK, EACFAVEGPK,
                                                                        over 3 orders of magnitude in concentration. We contend that
DLGEEHFK, and AEFVEVTK). If the ionization pattern for a given
                                                                        the Expression Informatics software is capable of extracting AMRT
protein was known, one could predict which peptides should be
                                                                        information at the low end of detection, provided that ion statistics
present at a given concentration of protein. Additionally, using
                                                                        support an accurate mass measurement and produce a defined
this information, the PMF assignment could be validated further
                                                                        chromatographic apex. The experiments outlined in this manu-
by correlating the observed ionization pattern to the known tryptic
                                                                        script were performed over a period of 36 h. An additional set of
peptide ionization pattern for that particular protein. The ultimate
                                                                        experiments were performed with the dilution series of the MPDS
goal for this type of approach would be to create ionization maps
                                                                        proteins alone over the same 36-h time frame for the purpose of
for all proteins in a proteome database. If this could be ac-
                                                                        another topic. The quantitative results from the two individual sets
complished, identifying proteins by mass, retention time, fold
                                                                        of experiments indicated that the methodology is a robust method
change and ionization efficiency would become an exercise in
accounting (or ion accounting).                                         for global protein profiling.
                                                                            The demonstrated ability to generate response curves for the
CONCLUSION                                                              human serum and the exogenous protein peptides suggests that
   The purpose of the this work was to illustrate that the              the sample preparation and data acquisition were quantitatively
Expression Informatics software could reduce the complexity of          reproducible, with average Cv’s of <15%. Although one can use
the continuum LC/MS data to a list of AMRT components that              affinity capture techniques to enrich samples for peptides contain-
have undergone a statistically significant change in relative           ing specific amino acid residues and thereby simplify the polypep-
abundance due to the applied perturbation. The Expression               tide pool, we have shown that this is not necessary to obtain
Informatics software is capable of extracting chromatographic and       accurate quantitation. On the contrary, our methodology provides
                                                                                 Analytical Chemistry, Vol. 77, No. 7, April 1, 2005   2199
access to more peptides per protein and allows one to establish           ions that were detected in the elevated energy function. Although
high confidence levels for each quantified protein.                       it is not described in this manuscript, the additional information
    The peptide components which exhibit significant up- or down-         provided in the elevated energy function affords additional
regulation can be further investigated by conducting a modification       specificity for each of the detected precursors in the low energy
of the traditional peptide mass fingerprint analysis. One can             function. Although changing the chromatography column may
maximize the information obtained from the clustered AMRT                 cause a slight shift in the observed retention time, the associated
analysis by recognizing that a relative change in abundance for a         elevated energy accurate mass measurements will allow one to
particular protein will manifest itself by producing multiple peptide     manage the data properly across multiple experiments. As
fragments which should exhibit the same relative change in                described in this work, the precursor information obtained in this
abundance. Using the quantitative information available from the          mode is quantitative and reproducible. A more detailed explanation
clustered AMRT analysis, the user can choose to submit for PMF            of the alternate scanning methodology is described in the
identification, only those accurate mass measurements which               following study by Silva and co-workers31 and will be the topic of
exhibit the proper fold change. Organizing the AMRTs by                   future work.
observed fold change for subsequent PMF identification is quite
empowering, since it provides additional stringency to the qualita-       ACKNOWLEDGMENT
tive identification of a protein that is quantitatively consistent with       The authors acknowledge the valuable contributions of Timo-
the data. For those users who require structural information for          thy Riley and Bob Bateman throughout the development of this
qualitative peptide/protein assignment, the list of AMRTs can be          work. The authors also acknowledge Jeanne Li for her contribu-
used to organize a targeted include list for subsequent peptide           tions in the laboratory and throughout the editing of this
identification studies by traditional methods, such as targeted MS/       manuscript. Last, we extend our gratitude to our collaborators
MS. Using the accurate mass and retention time information                who helped develop the Expression Informatics software by
obtained from the AMRT analysis, as well as the associated                embracing the methodology and applying themselves to demon-
quantitative and statistical analysis, one can carry out a targeted       strate its utility (Stanely Hefta, Ashok Dongre, Gregory Opiteck,
MS/MS analysis to identify only those AMRTs that have under-              Martin Wiedmann, Deborah H. Smith, Arthur Moseley, Kevin
gone a statistically significant change in relative abundance             Blackburn, Danie Schlatzer, Craig A. Townsend, Minerva Hughes,
between conditions. This would eliminate the accumulation of MS/          Christopher T. Walsh, and Jun Yin).
MS data on proteins that are not affected in specific studies and
would allow one to maximize the efficiency of the MS/MS data              SUPPORTING INFORMATION AVAILABLE
collection per unit time in a biomarker discovery setting. However,           Four posters that were presented at the 52nd ASMS Confer-
the initial LC/MS experiments could have been acquired using              ence on Mass Spectrometry and Allied Topics, 2004, Nashville,
the alternate scanning methodology described in this work, in             TN (see explanations of refs 27, 28, 31, 32 in text) are available
which the collision energy alternates between low and elevated            as Supporting Information. This material is available free of charge
energy throughout the entire LC/MS analysis to capture both               via the Internet at http://pubs.acs.org.
precursor and associated fragment ion information in one experi-
ment. Precursor information is captured in one function under
low-energy conditions, and the associated fragment ions are               Received for review October 19, 2004. Accepted January
captured in a second function under elevated-energy conditions.           13, 2005.
Each reported precursor will have an associated set of fragment           AC048455K


2200   Analytical Chemistry, Vol. 77, No. 7, April 1, 2005

Weitere ähnliche Inhalte

Was ist angesagt?

Thesis defense - QUANG ONG - FINAL
Thesis defense - QUANG ONG - FINALThesis defense - QUANG ONG - FINAL
Thesis defense - QUANG ONG - FINALQuang Ong
 
Xie et al 2016 risk analysis
Xie et al 2016 risk analysisXie et al 2016 risk analysis
Xie et al 2016 risk analysisMaria Isabel
 
Weber_FinalProposal
Weber_FinalProposalWeber_FinalProposal
Weber_FinalProposalAnna Weber
 
Topological analysis of coexpression networks in neoplastic tissues (BITS2012...
Topological analysis of coexpression networks in neoplastic tissues (BITS2012...Topological analysis of coexpression networks in neoplastic tissues (BITS2012...
Topological analysis of coexpression networks in neoplastic tissues (BITS2012...Roberto Anglani
 
Data as research output, data as part of the scholarly record
Data as research output, data as part of the scholarly recordData as research output, data as part of the scholarly record
Data as research output, data as part of the scholarly recordTodd Vision
 
Study on In Vitro Kinetic Characterization of Transporter-Mediated Permeability
Study on In Vitro Kinetic Characterization of Transporter-Mediated PermeabilityStudy on In Vitro Kinetic Characterization of Transporter-Mediated Permeability
Study on In Vitro Kinetic Characterization of Transporter-Mediated PermeabilityTorben Haagh
 
CYP121 Drug Discovery (M. tuberculosis)
CYP121 Drug Discovery (M. tuberculosis)CYP121 Drug Discovery (M. tuberculosis)
CYP121 Drug Discovery (M. tuberculosis)Anthony Coyne
 
Repurposing large datasets to dissect exposomic (and genomic) contributions i...
Repurposing large datasets to dissect exposomic (and genomic) contributions i...Repurposing large datasets to dissect exposomic (and genomic) contributions i...
Repurposing large datasets to dissect exposomic (and genomic) contributions i...Chirag Patel
 
Japanese Environmental Children's Study and Data-driven E
Japanese Environmental Children's Study and Data-driven EJapanese Environmental Children's Study and Data-driven E
Japanese Environmental Children's Study and Data-driven EChirag Patel
 
Biomedical Informatics 706: Precision Medicine with exposures
Biomedical Informatics 706: Precision Medicine with exposuresBiomedical Informatics 706: Precision Medicine with exposures
Biomedical Informatics 706: Precision Medicine with exposuresChirag Patel
 
Gutell 109.ejp.2009.44.277
Gutell 109.ejp.2009.44.277Gutell 109.ejp.2009.44.277
Gutell 109.ejp.2009.44.277Robin Gutell
 
Label-Free Quantitation and Mapping of the ErbB2 Tumor Receptor by Multiple P...
Label-Free Quantitation and Mapping of the ErbB2 Tumor Receptor by Multiple P...Label-Free Quantitation and Mapping of the ErbB2 Tumor Receptor by Multiple P...
Label-Free Quantitation and Mapping of the ErbB2 Tumor Receptor by Multiple P...AB SCIEX India
 
Montgomery expression
Montgomery expressionMontgomery expression
Montgomery expressionmorenorossi
 

Was ist angesagt? (20)

Thesis defense - QUANG ONG - FINAL
Thesis defense - QUANG ONG - FINALThesis defense - QUANG ONG - FINAL
Thesis defense - QUANG ONG - FINAL
 
Weber-Thesis
Weber-ThesisWeber-Thesis
Weber-Thesis
 
Xie et al 2016 risk analysis
Xie et al 2016 risk analysisXie et al 2016 risk analysis
Xie et al 2016 risk analysis
 
Weber_FinalProposal
Weber_FinalProposalWeber_FinalProposal
Weber_FinalProposal
 
Topological analysis of coexpression networks in neoplastic tissues (BITS2012...
Topological analysis of coexpression networks in neoplastic tissues (BITS2012...Topological analysis of coexpression networks in neoplastic tissues (BITS2012...
Topological analysis of coexpression networks in neoplastic tissues (BITS2012...
 
Data as research output, data as part of the scholarly record
Data as research output, data as part of the scholarly recordData as research output, data as part of the scholarly record
Data as research output, data as part of the scholarly record
 
Study on In Vitro Kinetic Characterization of Transporter-Mediated Permeability
Study on In Vitro Kinetic Characterization of Transporter-Mediated PermeabilityStudy on In Vitro Kinetic Characterization of Transporter-Mediated Permeability
Study on In Vitro Kinetic Characterization of Transporter-Mediated Permeability
 
Smith_COSB_2015
Smith_COSB_2015Smith_COSB_2015
Smith_COSB_2015
 
CYP121 Drug Discovery (M. tuberculosis)
CYP121 Drug Discovery (M. tuberculosis)CYP121 Drug Discovery (M. tuberculosis)
CYP121 Drug Discovery (M. tuberculosis)
 
Repurposing large datasets to dissect exposomic (and genomic) contributions i...
Repurposing large datasets to dissect exposomic (and genomic) contributions i...Repurposing large datasets to dissect exposomic (and genomic) contributions i...
Repurposing large datasets to dissect exposomic (and genomic) contributions i...
 
Japanese Environmental Children's Study and Data-driven E
Japanese Environmental Children's Study and Data-driven EJapanese Environmental Children's Study and Data-driven E
Japanese Environmental Children's Study and Data-driven E
 
Open Journal of Chemistry
Open Journal of ChemistryOpen Journal of Chemistry
Open Journal of Chemistry
 
defense 2.0
defense 2.0defense 2.0
defense 2.0
 
Biomedical Informatics 706: Precision Medicine with exposures
Biomedical Informatics 706: Precision Medicine with exposuresBiomedical Informatics 706: Precision Medicine with exposures
Biomedical Informatics 706: Precision Medicine with exposures
 
Internship Poster Diabetes 2014 Final
Internship Poster Diabetes 2014 FinalInternship Poster Diabetes 2014 Final
Internship Poster Diabetes 2014 Final
 
Gutell 109.ejp.2009.44.277
Gutell 109.ejp.2009.44.277Gutell 109.ejp.2009.44.277
Gutell 109.ejp.2009.44.277
 
ncomms11428
ncomms11428ncomms11428
ncomms11428
 
Label-Free Quantitation and Mapping of the ErbB2 Tumor Receptor by Multiple P...
Label-Free Quantitation and Mapping of the ErbB2 Tumor Receptor by Multiple P...Label-Free Quantitation and Mapping of the ErbB2 Tumor Receptor by Multiple P...
Label-Free Quantitation and Mapping of the ErbB2 Tumor Receptor by Multiple P...
 
APOE Poster
APOE PosterAPOE Poster
APOE Poster
 
Montgomery expression
Montgomery expressionMontgomery expression
Montgomery expression
 

Andere mochten auch

Proteomics 2009 V9p1683
Proteomics 2009 V9p1683Proteomics 2009 V9p1683
Proteomics 2009 V9p1683jcruzsilva
 
00002 Jc Silva 2006 Mcp V5n1p144
00002 Jc Silva 2006 Mcp V5n1p14400002 Jc Silva 2006 Mcp V5n1p144
00002 Jc Silva 2006 Mcp V5n1p144jcruzsilva
 
Asilomar2005 Ecoli Poster
Asilomar2005 Ecoli PosterAsilomar2005 Ecoli Poster
Asilomar2005 Ecoli Posterjcruzsilva
 
Asms2004 Alternate Scanning Lcms
Asms2004 Alternate Scanning LcmsAsms2004 Alternate Scanning Lcms
Asms2004 Alternate Scanning Lcmsjcruzsilva
 
00048 J Silva Proteo Monitor 2005 1104
00048 J Silva Proteo Monitor 2005 110400048 J Silva Proteo Monitor 2005 1104
00048 J Silva Proteo Monitor 2005 1104jcruzsilva
 
00003 Jc Silva 2006 Mcp V5n4p589
00003 Jc Silva 2006 Mcp V5n4p58900003 Jc Silva 2006 Mcp V5n4p589
00003 Jc Silva 2006 Mcp V5n4p589jcruzsilva
 
00049 J Silva Research Profile Jpr 2006
00049 J Silva Research Profile Jpr 200600049 J Silva Research Profile Jpr 2006
00049 J Silva Research Profile Jpr 2006jcruzsilva
 
Proteomics 2009 V9p1696
Proteomics 2009 V9p1696Proteomics 2009 V9p1696
Proteomics 2009 V9p1696jcruzsilva
 

Andere mochten auch (8)

Proteomics 2009 V9p1683
Proteomics 2009 V9p1683Proteomics 2009 V9p1683
Proteomics 2009 V9p1683
 
00002 Jc Silva 2006 Mcp V5n1p144
00002 Jc Silva 2006 Mcp V5n1p14400002 Jc Silva 2006 Mcp V5n1p144
00002 Jc Silva 2006 Mcp V5n1p144
 
Asilomar2005 Ecoli Poster
Asilomar2005 Ecoli PosterAsilomar2005 Ecoli Poster
Asilomar2005 Ecoli Poster
 
Asms2004 Alternate Scanning Lcms
Asms2004 Alternate Scanning LcmsAsms2004 Alternate Scanning Lcms
Asms2004 Alternate Scanning Lcms
 
00048 J Silva Proteo Monitor 2005 1104
00048 J Silva Proteo Monitor 2005 110400048 J Silva Proteo Monitor 2005 1104
00048 J Silva Proteo Monitor 2005 1104
 
00003 Jc Silva 2006 Mcp V5n4p589
00003 Jc Silva 2006 Mcp V5n4p58900003 Jc Silva 2006 Mcp V5n4p589
00003 Jc Silva 2006 Mcp V5n4p589
 
00049 J Silva Research Profile Jpr 2006
00049 J Silva Research Profile Jpr 200600049 J Silva Research Profile Jpr 2006
00049 J Silva Research Profile Jpr 2006
 
Proteomics 2009 V9p1696
Proteomics 2009 V9p1696Proteomics 2009 V9p1696
Proteomics 2009 V9p1696
 

Ähnlich wie 00047 Jc Silva 2005 Anal Chem V77p2187

An Actionable Annotation Scoring Framework For Gas Chromatography - High Reso...
An Actionable Annotation Scoring Framework For Gas Chromatography - High Reso...An Actionable Annotation Scoring Framework For Gas Chromatography - High Reso...
An Actionable Annotation Scoring Framework For Gas Chromatography - High Reso...Nicole Heredia
 
Mel Reichman on Pool Shark’s Cues for More Efficient Drug Discovery
Mel Reichman on Pool Shark’s Cues for More Efficient Drug DiscoveryMel Reichman on Pool Shark’s Cues for More Efficient Drug Discovery
Mel Reichman on Pool Shark’s Cues for More Efficient Drug DiscoveryJean-Claude Bradley
 
Finland Helsinki Drug Research slides 2011
Finland Helsinki Drug Research slides 2011Finland Helsinki Drug Research slides 2011
Finland Helsinki Drug Research slides 2011Sean Ekins
 
Analytical method development and validation
Analytical method development and validationAnalytical method development and validation
Analytical method development and validationCreative Peptides
 
Radiolytic Modification of Basic Amino Acid Residues in Peptides : Probes for...
Radiolytic Modification of Basic Amino Acid Residues in Peptides : Probes for...Radiolytic Modification of Basic Amino Acid Residues in Peptides : Probes for...
Radiolytic Modification of Basic Amino Acid Residues in Peptides : Probes for...Keiji Takamoto
 
Capstone poster gail_falcione (1)
Capstone poster gail_falcione (1)Capstone poster gail_falcione (1)
Capstone poster gail_falcione (1)Gail Falcione
 
High-throughput proteomics: from understanding data to predicting them
High-throughput proteomics: from understanding data to predicting themHigh-throughput proteomics: from understanding data to predicting them
High-throughput proteomics: from understanding data to predicting themMaté Ongenaert
 
1995 Research Publication
1995 Research Publication1995 Research Publication
1995 Research PublicationPhil Myers
 
Drug metabolism and disposition 2
Drug metabolism and disposition 2Drug metabolism and disposition 2
Drug metabolism and disposition 2Edrus Syah
 
BioIT Drug induced liver injury talk 2011
BioIT Drug induced liver injury talk 2011BioIT Drug induced liver injury talk 2011
BioIT Drug induced liver injury talk 2011Sean Ekins
 
NMR in fragment based drug discovery
NMR in fragment based drug discoveryNMR in fragment based drug discovery
NMR in fragment based drug discoveryKatie Strong
 
Genome responses of trypanosome infected cattle
Genome responses of trypanosome infected cattleGenome responses of trypanosome infected cattle
Genome responses of trypanosome infected cattleLaurence Dawkins-Hall
 
Poster on systems pharmacology of the cholesterol biosynthesis pathway
Poster on systems pharmacology of the cholesterol biosynthesis pathwayPoster on systems pharmacology of the cholesterol biosynthesis pathway
Poster on systems pharmacology of the cholesterol biosynthesis pathwayGuide to PHARMACOLOGY
 
Talk at Yale University April 26th 2011: Applying Computational Models for To...
Talk at Yale University April 26th 2011: Applying Computational Modelsfor To...Talk at Yale University April 26th 2011: Applying Computational Modelsfor To...
Talk at Yale University April 26th 2011: Applying Computational Models for To...Sean Ekins
 
Chemical Nose Biosensors Cancer Cells and Biomarkers
Chemical Nose Biosensors Cancer Cells and BiomarkersChemical Nose Biosensors Cancer Cells and Biomarkers
Chemical Nose Biosensors Cancer Cells and BiomarkersOscar1Miranda2
 
Chemical Nose Biosensors Cancer Cells and Biomarkers
Chemical Nose Biosensors Cancer Cells and BiomarkersChemical Nose Biosensors Cancer Cells and Biomarkers
Chemical Nose Biosensors Cancer Cells and BiomarkersOscar1Miranda2
 

Ähnlich wie 00047 Jc Silva 2005 Anal Chem V77p2187 (20)

An Actionable Annotation Scoring Framework For Gas Chromatography - High Reso...
An Actionable Annotation Scoring Framework For Gas Chromatography - High Reso...An Actionable Annotation Scoring Framework For Gas Chromatography - High Reso...
An Actionable Annotation Scoring Framework For Gas Chromatography - High Reso...
 
Mel Reichman on Pool Shark’s Cues for More Efficient Drug Discovery
Mel Reichman on Pool Shark’s Cues for More Efficient Drug DiscoveryMel Reichman on Pool Shark’s Cues for More Efficient Drug Discovery
Mel Reichman on Pool Shark’s Cues for More Efficient Drug Discovery
 
Finland Helsinki Drug Research slides 2011
Finland Helsinki Drug Research slides 2011Finland Helsinki Drug Research slides 2011
Finland Helsinki Drug Research slides 2011
 
Analytical method development and validation
Analytical method development and validationAnalytical method development and validation
Analytical method development and validation
 
Chenomx
ChenomxChenomx
Chenomx
 
LSD1 - bmc-paper
LSD1 - bmc-paperLSD1 - bmc-paper
LSD1 - bmc-paper
 
Radiolytic Modification of Basic Amino Acid Residues in Peptides : Probes for...
Radiolytic Modification of Basic Amino Acid Residues in Peptides : Probes for...Radiolytic Modification of Basic Amino Acid Residues in Peptides : Probes for...
Radiolytic Modification of Basic Amino Acid Residues in Peptides : Probes for...
 
Capstone poster gail_falcione (1)
Capstone poster gail_falcione (1)Capstone poster gail_falcione (1)
Capstone poster gail_falcione (1)
 
High-throughput proteomics: from understanding data to predicting them
High-throughput proteomics: from understanding data to predicting themHigh-throughput proteomics: from understanding data to predicting them
High-throughput proteomics: from understanding data to predicting them
 
Genomica Yquimiot
Genomica YquimiotGenomica Yquimiot
Genomica Yquimiot
 
1995 Research Publication
1995 Research Publication1995 Research Publication
1995 Research Publication
 
Drug metabolism and disposition 2
Drug metabolism and disposition 2Drug metabolism and disposition 2
Drug metabolism and disposition 2
 
BioIT Drug induced liver injury talk 2011
BioIT Drug induced liver injury talk 2011BioIT Drug induced liver injury talk 2011
BioIT Drug induced liver injury talk 2011
 
NMR in fragment based drug discovery
NMR in fragment based drug discoveryNMR in fragment based drug discovery
NMR in fragment based drug discovery
 
Genome responses of trypanosome infected cattle
Genome responses of trypanosome infected cattleGenome responses of trypanosome infected cattle
Genome responses of trypanosome infected cattle
 
Poster on systems pharmacology of the cholesterol biosynthesis pathway
Poster on systems pharmacology of the cholesterol biosynthesis pathwayPoster on systems pharmacology of the cholesterol biosynthesis pathway
Poster on systems pharmacology of the cholesterol biosynthesis pathway
 
Talk at Yale University April 26th 2011: Applying Computational Models for To...
Talk at Yale University April 26th 2011: Applying Computational Modelsfor To...Talk at Yale University April 26th 2011: Applying Computational Modelsfor To...
Talk at Yale University April 26th 2011: Applying Computational Models for To...
 
Chemical Nose Biosensors Cancer Cells and Biomarkers
Chemical Nose Biosensors Cancer Cells and BiomarkersChemical Nose Biosensors Cancer Cells and Biomarkers
Chemical Nose Biosensors Cancer Cells and Biomarkers
 
Chemical Nose Biosensors Cancer Cells and Biomarkers
Chemical Nose Biosensors Cancer Cells and BiomarkersChemical Nose Biosensors Cancer Cells and Biomarkers
Chemical Nose Biosensors Cancer Cells and Biomarkers
 
Sirm core2 (2)
Sirm core2 (2)Sirm core2 (2)
Sirm core2 (2)
 

00047 Jc Silva 2005 Anal Chem V77p2187

  • 1. Anal. Chem. 2005, 77, 2187-2200 Quantitative Proteomic Analysis by Accurate Mass Retention Time Pairs Jeffrey C. Silva,*,† Richard Denny,§ Craig A. Dorschel,† Marc Gorenstein,† Ignatius J. Kass,‡ Guo-Zhong Li,† Therese McKenna,§ Michael J. Nold,‡ Keith Richardson,§ Phillip Young,§ and Scott Geromanos† Waters Corporation, 34 Maple Street, Milford, Massachusetts 01757-3696, Waters Corporation, 100 Cummings Center, Beverly, Massachusetts 01915, and Waters Corporation, Atlas Park, Simons Way, M22 5PP, Manchester, Great Britain Current methodologies for protein quantitation include due to the issues associated with sample complexity, sample 2-dimensional gel electrophoresis techniques, metabolic preparation, and the wide dynamic range of protein abundance.1,2 labeling, and stable isotope labeling methods to name only Many approaches to quantitative proteomics have involved the a few. The current literature illustrates both pros and cons combination of stable-isotope labeling methods for sample prepa- for each of the previously mentioned methodologies. ration with automated liquid chromatography coupled to a tandem Keeping with the teachings of William of Ockham, “with mass spectrometer (LC/MS/MS).3-12 Stable isotopes are generally all things being equal the simplest solution tends to introduced into proteins or peptides by chemical modification,3-6 be correct”, a simple LC/MS based methodology is metabolic labeling,7-10 or enzymatic derivatization.11,12 The speci- presented that allows relative changes in abundance of ficity of these isotopic labeling techniques is contingent upon proteins in highly complex mixtures to be determined. observing different mass shifts, which can be generated by using Utilizing a reproducible chromatographic separations a variety of available labeling reagents. system along with the high mass resolution and mass In two recent articles, Wang and co-workers,13 as well as accuracy of an orthogonal time-of-flight mass spectrom- Radulovic and co-workers,14 introduced quantitative, label-free LC/ eter, the quantitative comparison of tens of thousands of MS strategies for global profiling of complex protein mixtures. ions emanating from identically prepared control and Both publications illustrate their specific algorithms for ion experimental samples can be made. Using this configu- detection, clustering and quantitation. The lower resolution ration, we can determine the change in relative abundance instrument employed in the studies presented by Radulovic and of a small number of ions between the two conditions colleagues requires that their data reduction scheme condense solely by accurate mass and retention time. Employing all detections into nominal mass bins. Though the data presented standard operating procedures for both sample prepara- are compelling, the data reduction strategy involving nominal mass tion and ESI-mass spectrometry, one typically obtains bins may result in significant errors when dealing with highly under 5 ppm mass precision and quantitative variations complex mixtures. As an example, in a simple proteome such as between 10 and 15%. The principal focus of this paper Escherichia coli, there are ∼105 000 tryptic peptides, including one will demonstrate the quantitative aspects of the methodol- ogy and continue with a discussion of the associated, (1) Hamdan, M.; Righetti, P. G. Mass Spectrom. Rev. 2002, 21, 287-302. complementary qualitative capabilities. (2) Lill, J. Mass Spectrom. Rev. 2003, 22, 182-194. (3) Gygi, S. P.; Rist, B.; Gerber, S. A.; Turecek, F.; Gelb, M. H.; Aebersold, R. Nat. Biotechnol. 1999, 17, 994-999. Quantitative proteomics has been chartered as the technology (4) Zhou, H. L.; Ranish, J. A.; Watts, J. D.; Aebersold, R. Nat. Biotechnol. 2002, 19, 512-515. which will serve as a major contributor in studies aimed at (5) Griffin, T. J.; Gygi, S. P.; Rist, B.; Aebersold, R. Anal. Chem. 2001, 73, uncovering disease pathways, biomarker discovery, and providing 978-986. new insights into biological processes for drug discovery. In these (6) Chakraboorty, A.; Regnier, F. J. Chromatogr., A 2002, 949, 173-184. (7) Veenstra, T. D.; Martinovic, S.; Anderson, G. A.; Pasa-Tolic, L.; Smith, R. D. experiments, mass spectrometry is used to determine the relative J. Am. Soc. Mass Spectrom. 2000, 11, 78-82. amounts of protein among different biological samples to char- (8) Ong, S. E.; Kratchmarova, I.; Mann, M. J. Proteome Res. 2003, 2, 173-181. acterize a variety of physiological conditions. In addition, further (9) Krijgsveld, J.; Ketting, R. F.; Mahmoudi, T.; Johansen, J.; Artal-Sanz, M.; Verrijzer, C. P.; Plasterk, R. H. A.; Heck, A. J. R. Nat. Biotechnol. 2003, 21, characterization of the physiological perturbation may require that 927-931. the relative degrees of posttranslational modifications associated (10) Oda, Y.; Huang, K.; Cross, F. R.; Cowburn, D.; Chait, B. T. PNAS 1999, with the proteins of interest be determined. However, compre- 96, 6591-6596. (11) Yao, X. D.; Freas, A.; Ramirez, J.; Demirev, P. A.; Fenselau, C. Anal. Chem. hensive quantitative proteomics remains technically challenging 2001, 73, 2836-2842. (12) Stewart, I. I.; Thomson, T.; Figeys, D. Rapid Commun. Mass Spectrom. 2001, * Corresponding author. Phone: 978-482-3005. Fax: 508-482-2055. E-mail: 15, 2456-2465. jeff_silva@waters.com. (13) Wang, W.; Zhou, H.; Lin, H.; Roy, S.; Shaler, T. A.; Hill, L. R.; Norton, S.; † Milford, Massachusetts. Kumar, P.; Anderle, M.; Becker, C. H. Anal. Chem. 2003, 75, 4818-4826. ‡ Beverly, Massachusetts. (14) Radulovic, D.; Jelveh, S.; Ryu, S.; Hamilton, T. G.; Foss, E.; Mao, Y.; Emili, § Manchester, Great Britain. A. Mol. Cell. Proteomics 2004, 3, 984-997. 10.1021/ac048455k CCC: $30.25 © 2005 American Chemical Society Analytical Chemistry, Vol. 77, No. 7, April 1, 2005 2187 Published on Web 03/02/2005
  • 2. missed cleavage between 700 and 2481 molecular mass. An a quantitative proteomics strategy which employs an LC/MS average of 7 tryptic peptides of the 105 000 are found within a method as the basis for the analytical strategy for quantifying mass tolerance of 5 ppm of itself. If the mass tolerance is increased proteome profile data for differential expression analysis. This to within 1 Da, the average number of tryptic peptides is increased method relies on the changes in the peptide analyte signal to 165. Using this logic, the opportunity to have more than one response from each accurate mass measurement and correspond- peptide eluting within a nominal mass bin can be up to 23 times ing retention time (AMRT) component, and to directly reflect their more likely if the data are reduced from accurate mass measure- concentrations in one sample relative to another. This method ments to nominal mass. As a result, nominal mass binning of mass does not require the use of any stable-isotope labeling method or spectrometric, LC/MS data may lead to problems in subsequent enrichment strategy; however, it does require that the sample clustering of replicate analyzes and to variability in the corre- preparation conditions are carefully controlled for optimal, quan- sponding quantitative analysis. Radulovic and co-workers report titative performance. Regardless of the analytical technique, the that their quantitative results exhibited an acceptable measure of protein samples must be prepared in a fashion that ensures an variance of 2-fold or less deviation in the observed signal efficient and reproducible separation, with concurrent elimination intensities. In addition to presenting data from an identical of undesirable artifacts. instrument platform, Wang and colleagues also illustrated LC/ In this investigation, we prepared a tryptic digest of human MS data collected on a time-of-flight mass spectrometer. In this serum spiked with increasing amounts of a standard protein work, the authors indicated that the higher resolution and mass mixture and observed the linear behavior in the signal from accuracy of the TOF system was found to be advantageous for digested peptides corresponding to the experimentally configured tracking and quantifying large numbers of mass spectral peaks. protein concentrations. The methodology presented in this work The results obtained from these studies provided acceptable maximizes the duty cycle of a quadrupole-time-of-flight (Q-TOF) coefficients of variation (∼25%) across integrated peak intensities. mass spectrometer to yield extensive quantitative and qualitative The data acquisition platform used by Radulovic was configured information by systematically and simultaneously analyzing the to collect two parallel LC/MS experiments in a single LC/MS run peptide components from large sets of protein mixtures.22,23 for simultaneous quantitative and qualitative analysis. In an Although this work involves the analysis of human serum, this alternating fashion, the instrument measures the masses of eluting methodology is applicable to any number of biological samples peptide components in MS mode in one function and then carries (plasma, urine, whole-cell lysate, organelle, tissue, or microbial). out a data-dependent CID for a subset of detected precursor masses in MS/MS mode in a second function. However, the MATERIALS AND METHODS Sample Preparation. Six aliquots of human serum (HS, authors affirm that considerably more peptide peaks are detectable Sigma source) were dispensed into separate eppindorf tubes in full-scan MS mode than can be identified in the same time frame (∼200 ug). An equimolar stock solution of exogenous proteins using the collision-induced dissociation process. This level of (yeast enolase and alcohol dehydrogenase, rabbit glycogen inefficiency requires that additional MS/MS experiments would phosphorylase, and bovine serum albumin and hemoglobin, be needed for thorough identifications to be made in a given study. MPDS proteins) was prepared such that each protein was present The use of MS technology in high-throughput proteomics faces at 5 pmol/µL in 50 mM ammonium bicarbonate (pH 8.5). The several challenges in order to accurately compare differentially exogenous proteins were added to each of the six aliquots of expressed proteins from corresponding peptide component infor- human serum such that the final concentration of equimolar mation, such as retention time, mass, and signal response. proteins was 0.500, 0.250, 0.100, 0.050, 0.025, and 0.010 pmol/µL Included among these challenges, software solutions for peak (final volume of 200 µL), respectively. To avoid working under detection, chromatographic spectral alignment, charge-state re- the specified limits of the pipettor, appropriate dilutions of the duction, and deisotoping need to be implemented in order to stock solution were made to ensure that at least 10-20 µL of stock reduce the complexity of the continuum MS data and successfully protein solution, from a calibrated 20-µL pipettor, was added to compare differences among samples. The Expression Informatics achieve the desired final exogenous protein concentration. The software, introduced in this study, has been developed to carry volumes of the samples were adjusted to 100 µL with 50 mM out these functionalities for comprehensive, quantitative, dif- ammonium bicarbonate (pH 8.5) containing 0.05% RapiGest.25 ferential expression analysis. Protein was reduced in the presence of 10 mM dithiothreitol at Although it has been observed that electrospray ionization 60 °C for 30 min. The protein was alkylated in the dark, in the (ESI) provides signal responses that correlate linearly with presence of 50 mM iodoacetamide, at room temperature for 30 increasing analyte concentration,15-17 historically, there have been min. Proteolytic digestion was initiated by adding modified trypsin concerns regarding nonlinearity of signal response and ion (Promega) at a concentration of 75:1 (total protein to trypsin, by suppression effects18-21 which have prevented the implementation of a simple LC/MS solution for quantitative proteomics. We outline (20) Sangster, T.; Spence, M.; Sinclair, P.; Payne, R.; Smith, C. Rapid Commun. Mass Spectrom. 2004, 18, 1361-1364. (15) Purves, R. W.; Gabryelski, L. L. Rapid Commun. Mass Spectrom. 1998, 12, (21) Mei, H.; Hsieh, Y.; Nardo, C.; Xu, X.; Wang, S.; Ng, K.; Korfmacher, W. A. 695-700. Rapid Commun. Mass Spectrom. 2003, 17, 97-103. (16) Voyksner, R. D.; Lee, H. Rapid Commun. Mass Spectrom. 1999, 13, 1427- (22) Bateman, R. H.; Hoyes, J. B. U.K. Patent 2,364,168A, 2002. 1437. (23) Purvine, S.; Eppel, J. T.; Yi, E. C.; Goodlett, D. R. Proteomics 2003, 3, 847- (17) Chelius, D.; Bondarenko, P. J. Proteome Res. 2002, 1, 317-323. 850. (18) Muller, C.; Schafer, P.; Stortzel, M.; Vogt, S.; Weinmann, W. J. Chromatogr., (24) Geromanos, S.; Dongre, A.; Opiteck, G.; Silva, J. C. U.K. Patent 2,385,918A, B 2002, 773, 47-52. 2003. (19) Matuszewski, B. K.; Constanzer, M. L.; Chavez-Eng, C. M. Anal. Chem. (25) Yu, Y. Q.; Gilar, M.; Lee, P. J.; Bouvier, E. S. P.; Gebler, J. C. Anal. Chem. 1998, 70, 882-889. 2003, 75, 6023-6028. 2188 Analytical Chemistry, Vol. 77, No. 7, April 1, 2005
  • 3. weight) and incubated at 37 °C overnight. Each digestion mixture than one charge-state, the corresponding area for any given was diluted to a final volume of 200 µL with 50 mM ammonium monoisotopic ion is reported as the summed area from all bicarbonate (pH 8.5) to reduce the concentration of RapiGest contributing charge states. The retention time is determined for detergent to 0.025%. The tryptic peptide solution was centrifuged each reported monoisotopic ion at the moment it reaches its at 13 000 rpm for 10 min, and the supernatant was transferred maximum intensity (apex). Each detected component is referred into an autosampler vial for peptide analysis via LC/MS. Each to as an AMRT (accurate-mass, retention time) component. An sample was analyzed in triplicate. The LC/MS analysis was AMRT is extracted from the continuum data only if it exceeds a performed using 10 µL of the final tryptic digest. user-defined, minimum detection threshold. The software is also HPLC Configuration. Capillary liquid chromatography (Ca- capable of processing the data using an autothreshold capability pLC) of tryptic peptides was performed with a Waters CapLC/ which automatically adjusts the ion detection threshold over time Waters CapLC autosampler, equipped with a Waters NanoEase as a function of the dynamic range within the mass spectrometric Atlantis C18, 300 µm × 15 cm reversed-phase column. The aqueous data. The culmination of this process produces an AMRT mobile phase (mobile phase A) contained 1% acetonitrile in water component list. This list contains many experimentally derived with 0.1% formic acid. The organic mobile phase (mobile phase attributes for each of the recorded AMRT components (AMRTs). B) contained 80% acetonitrile in water with 0.1% formic acid. Included in this output are the weight-averaged monoisotopic mass Peptides were loaded onto the column with 6% mobile phase B. and charge state, the calculated mass deviation, the deisotoped Peptides were eluted from the column with a gradient of 6-40% and charge-state-reduced sum intensity (centered by area), the mobile phase B over 100 min at 4.4 µL/min, followed by a 10-min chromatographic area, the calculated intensity deviation, the rinse of 99% of mobile phase B. The column was immediately observed apex retention time (centered by area), and the observed reequilibrated at initial conditions (6% mobile phase B) for 20 min. start and stop time for the ion detection of the corresponding The lock mass, [Glu1]-fibrinopeptide at 100 fmol/µL (GFP), was AMRT. delivered from the auxiliary pump of the CapLC at 1 µL/min to Clustering Peptide Components by Mass and Retention the reference sprayer of the NanoLockSpray source. Time. One of the key operations required for the comparative Mass Spectrometer Configuration. Mass spectrometry analy- analyses of peptide mixtures is clustering chemically identical sis of tryptic peptides was performed using a modified Waters/ components together from replicate injections of the same sample Micromass Q-Tof Ultima API to provide enhanced mass accuracy. as well as among multiple samples. The clustering algorithm Detection events were acquired at 4 GHz. For all measurements, performs multiple binary comparisons to conduct the overall the mass spectrometer was operated in V mode with a typical clustering strategy for a complete experiment.27,28 AMRT compo- resolving power of at least 10 000. The spectrum integration time nents from each injection are clustered to align identical compo- was 1.8 s with an interscan delay time of 0.2 s. All analyses were nents to one another on the basis of a mass precision and a performed using positive-mode ESI using a NanoLockSpray retention time deviation threshold. In an initial binary comparison, source. The lock mass channel was sampled every 30 s. The mass a subset of the AMRTs from two separate injections is compared spectrometer was calibrated with a GFP solution (100 fmol/µL) to establish the experimental retention time deviation behavior delivered through the reference sprayer of the NanoLockSpray of identical AMRTs between the two samples. The subset of source. The doubly charged ion ([M + 2H]2+) was used for initial AMRTs considered in the initial comparison is typically those single point calibration (Lteff), and MS/MS fragment ions of GFP above the median intensity for the entire data set. In the initial were used to obtain the final instrument calibration. Data acquisi- comparison, a coarse threshold of typically 5 min is applied to tion was operated in the exact neutral loss mode, without an consider all potential paired candidates. Often, peptides may not include list. Accurate mass LC/MS and LC/MSE data were reproducibly elute at exactly the same time throughout a replicate collected using 10 eV for MS and 28-35 eV for MSE acquisition analysis. However, one generally observes a consistent shift in such that one cycle of MS and MSE data was acquired every 4.0 retention-time, whereby the observed retention time of a given s. The RF offset was adjusted such that the LC/MS data were set of peptides will deviate systematically, although not necessarily effectively acquired from m/z 300 to 2000, which ensured that by the same magnitude. Due to the complexity of the data, there any masses observed in the LC/MSE data less than m/z 300 were often exist conditions under which an AMRT in one condition or known to arise from dissociations in the collision cell. replicate will match within the threshold criterion to multiple AMRTs in a different replicate or condition. This, of course, is RESULTS AND DISCUSSION not desirable, since an AMRT from one condition or replicate Ion Detection. The ion detection algorithm of the Expression should only match its identical companion in any other condition. Informatics software uses a maximum likelihood algorithm to To address these situations, the clustering algorithm calculates deisotope and charge-state-reduce the m/z detections to the the delta retention time for all matched AMRTs and plots the corresponding monoisotopic m/z (MH+) for each scan of the retention time for each AMRT against the retention time difference continuum LC/MS data.26 The algorithm also calculates the observed among the corresponding matched components (Figure observed mass and intensity measurement deviation for every 1A). In doing so, the algorithm can determine the expected detected component. The chromatographic area associated with each component is calculated using an integration algorithm (27) Li, G.-Z.; Gorenstein, M.; Geromanos, S.; Silva, J. C.; Dorschel, C. A.; Riley similar to the ApexTrack peak integration algorithm provided in T. Proc. 52nd ASMS Conf. Mass Spectrom. Allied Top. 2004, TPY 354, Nashville, TN. the MassLynx software. If a particular component exists in more (28) Gorenstein, M.; Li, G.-Z.; Geromanos, S.; Silva, J. C.; Dorschel, C. A.; Plumb, R. S.; Stumpf, C. L.; Riley, T. Proc. 52nd ASMS Conf. Mass Spectrom. Allied (26) Skilling, J.; Bryan, R. K. Mon. Not. R. Astron. Soc. 1984, 211, 111-124. Top. 2004, WPJ 161, Nashville, TN. Analytical Chemistry, Vol. 77, No. 7, April 1, 2005 2189
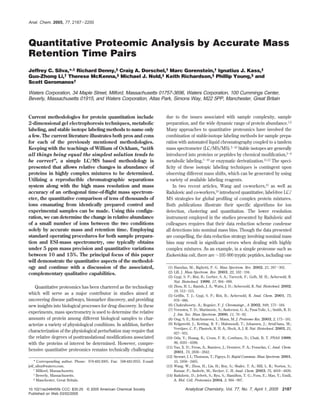
  • 4. Figure 1. (A) The AMRTs from two separate injections of the human serum spiked with 5 pmol of exogenous protein were clustered by mass and retention time using the Expression Informatics software to associate identical components. The initial results of the clustering algorithm are displayed by plotting the observed retention time deviation for all matched components versus the retention time of the first injection. Each point represents a paired AMRT having the appropriate mass ((10 ppm) and retention time tolerance ((5.0 min) from the first pass of the clustering algorithm. The red and blue lines define the corresponding upper and lower limits for the retention time tolerance used in the second pass filter. The matched components outside these tolerances are examples of similar mass measurements existing at multiple retention times within the 10 ppm mass tolerance. Although the absolute retention time deviation is ∼1.45 min throughout the entire chromatogram (min ) -1.05, max ) 0.40), the data indicate that the deviation of matched components at any given retention time does not exceed 0.5 min. (B) Using the retention time deviations from the matched components of the raw data, within the narrow retention time tolerance of 0.5 min, the retention times of the paired AMRTs are normalized and the redundant matched AMRTs are removed by eliminating those paired components outside the fine retention time tolerance. (C) Mass precision measurements from the 3131 replicating AMRTs (in at least two out of three injections) from the human serum samples containing 5.0 and 0.5 pmol exogenous proteins, whose replicate normalized intensity measurements were below 30% Cv. The 3131 replicating AMRTs produced 13 963 individual mass measurements used to produce the histogram plot of the mass precision. A total of 12 981 mass measurements were determined to have a mass precision of (3 ppm, which constitutes ∼93% of the data set. (D). Coefficient of variation of the intensity measurements from the 3404 replicating AMRTs (in at least two out of three injections) from the human serum samples containing 5.0 and 0.5 pmol exogenous proteins. The 3404 replicating AMRTs produced 5032 combined Cv measurements from both samples and were used to produce the histogram plot of the coefficient of variation of the measured intensity. A total of 4557 of the 5032 Cv measurements were under 30%, which constitutes ∼90% of the data set. The average and median coefficient of variation from these two data sets are 11 and 14%, respectively. retention time deviations for a given set of peptides at any given min is generally observed among paired components between two moment throughout the chromatogram. The expected retention experiments. Figure 1A illustrates a single pairwise comparison time deviations are modeled by monitoring the density of points of a replicate injection of the same sample. If the chromatography about a retention time deviation plot and determining the upper were ideal, the retention time differences for all matched com- and lower retention time deviation boundaries for any given binary ponents would be 0, and the resulting plot would illustrate a comparison. Only the matched AMRT component included within straight horizontal line centered at zero deviation. Each point in the defined retention time deviation boundaries are considered the plot designates one paired set of components. Since many to satisfy the matching criteria. Figure 1A illustrates such a plot. components elute from the column at any moment in time, the A fine retention time deviation threshold of typically less than 0.5 resulting plot should illustrate a dense scattering of points along 2190 Analytical Chemistry, Vol. 77, No. 7, April 1, 2005
  • 5. the retention time coordinate. Figure 1A illustrates that the measurements that are in dead time, there is a limit to its ability reproducibility of the chromatographic peptide separation is ∼0.25 to accurately correct for those measurements.29,30 With this in min, with an overall chromatographic deviation of 1.0 min. The mind, the internal AMRT standards selected for normalization pairwise comparison is performed for each of the replicate were well below dead time and existed in all replicates of each injections, as well as across the multiple experiments. The sample. The average monoisotopic masses of the AMRTs used retention time deviations observed between the AMRTs of two for normalization were 1273.6547, 1706.7746, and 2171.1138, with injections serve as multiple internal standards and are used to corresponding elution times of approximately 42.60, 53.60, and determine an appropriate retention time offset for AMRTs eluting 101.80 min, respectively. These AMRT components were endog- at any moment. The retention time offsets are used to normalize enous to human serum and were determined to originate from the observed retention time for every AMRT component. The transferrin (data not shown).31 Next, the algorithm calculates the effects of the retention time normalization are illustrated in Figure replication rate of each AMRT within and among all conditions. 1B. The output that is generated from the clustering routine is a The algorithm also calculates the average mass, intensity, area, large matrix, whereby identical components are aligned in each combined charge-state, and retention-time for each AMRT for all row for subsequent quantitative and statistical analysis. The conditions. In addition, a standard deviation and coefficient of assembled matrix will not only contain AMRTs which appear in variation is determined for each of these measured attributes. each of the conditions for each of the replicate injections, but may Using this information, the software annotates those AMRTs also include those AMRTs which appear reproducibly in one or common and unique to each condition. Last, the algorithm more of the six conditions. performs binary comparisons for each of the conditions to To illustrate the level of specificity one is capable of obtaining generate an average normalized intensity ratio (log) for all with mass accuracy and retention time reproducibility, the matched AMRTs and also performs a Student’s t-test for each processed data can be queried at different retention time and mass binary comparison. The final results of the clustering algorithm precision tolerances. As an example, injection 2 of the human can be exported as a comma-delimited text file containing all of serum with 2 pmol of MPDS protein produced 2582 AMRTs. The the mass spectrometric and chromatographic attributes for each 2582 AMRTs were queried to determine how many were within AMRT, along with all of the mathematical and statistical calcula- a (1-min retention time window and a 10 ppm mass tolerance. tions generated after the clustering process. This clustered data Using these tolerances, a total of 36 AMRTs (1.4%) were found to file can be further manipulated or visualized in any of a number coexist within these parameters. Therefore, these 36 AMRTs could of commercially available software packages, such as Microsoft potentially add ambiguity during the clustering process and lead Excel or Spotfire Decision Site. to incorrect clustering of the data. If the mass tolerance is allowed The precision of the extracted mass measurements of the clustered components from the replicate injections of all samples to expand to a 100-mDa error, the ambiguity is increases to a total were typically within (5 ppm of the mean mass measurement. of 76 AMRTs (2.9%). At 1 Da, nominal mass, the ambiguity These data are illustrated in Figure 1C and demonstrate the increases to a total of 657 AMRTs (25.4%). These errors are robustness of the ion extraction software and the stability of the compounded if the tolerances of both the retention time and mass mass measurement instrumentation. In fact, 90% of the total precision are allowed to expand. If the retention time tolerance is number of replicated components were measured with a precision allowed to be within (5 min, then the following statistics are of (3 ppm. The reproducibility of the quantitative intensity generated from the single data file: 293 AMRTs (11.3%) at 10 ppm measurements from the Expression Informatics software is mass tolerance, 441 AMRTs (17.1%) at 100-mDa mass tolerance, summarized in Figure 1D. These results indicate that the coef- and 1112 AMRTs (43.1%) at 1-Da tolerance. These results are ficient of variation (Cv) among the replicate injections and across based on a single injection of a single sample. If one were to multiple samples were typically less than 15%, with a majority of compare replicates among many different samples, this could lead the quantitative variation lying between 11 and 14% Cv. These to a significant number of AMRTs being clustered incorrectly and observations are typically expected from the Expression Infor- thereby produce highly irreproducible results. Having an LC/MS matics software when using standard protocols for efficient sample instrumentation platform that is capable of providing reproducible preparation.32 mass precision and accuracy along with reproducible chromatog- Expression Analysis of AMRT Components. The purpose raphy will significantly increase the quality of the clustered data of these experiments was to demonstrate that the Expression and will provide a more robust quantitative proteomics platform. Informatics software could ascertain the relative change in Data Normalization and Statistical Analysis. Once the abundance of a small subset of proteins (MPDS proteins) spiked AMRT data have been clustered, the clustering algorithm per- into a complex protein background (human serum). The MPDS forms a number of mathematical and statistical calculations for the entire data set. To correct for injection variability and total (29) Rockwood, A. L.; Fabbi, J. C.; Harris, L.; Davis, L.; Lee, E. D.; Ogden, C.; Tolley, H.; Gunsay, M.; Sin, J. C. N.; Lee, H. G. Proc. 45th ASMS Conf. Mass protein load across samples, the intensity measurements for the Spectrom. Allied Top. 1997, WOE 0250, Palm Springs, CA. entire data set are normalized. The intensity measurements of all (30) Barbacci, D. C.; Russel, D. H.; Schultz, J. A.; Holocek, J.; Ulrich, S.; Burton, detected AMRTs from each injection are normalized to a set of W.; Van Stipdonk, M. J. Am. Soc. Mass Spectrom. 1998, 9, 1328-1333. (31) Silva, J. C.; Richardson, K.; Young, P.; Denny, R.; Neeson, K.; McKenna, AMRTs (endogenous or exogenous) that are known not to have T.; Dorschel, C. A.; Li, G.-L.; Gorenstein, M.; Riley, T.; Geromanos, S. Proc. changed among the different samples. The internal AMRT 52nd ASMS Conf. Mass Spectrom. Allied Top. 2004, MPX 452, Nashville, standards used for normalization purposes were required to be TN. (32) Dorschel, C. A.; Gorenstein, M.; Li, G.-Z.; Silva, J. C.; Geromanos, S.; Riley, present in all six experiments. Although the Expression Infor- T. Proc. 52nd Ann. ASMS Conf. Mass Spectrom. Allied Top. 2004, TPY 458, matics software is capable of correcting the mass and intensity Nashville, TN. Analytical Chemistry, Vol. 77, No. 7, April 1, 2005 2191
  • 6. Figure 2. (A) The base peak intensity (BPI) of human serum with five equimolar exogenous proteins spiked at decreasing levels (5.00, 2.00, 1.00, 0.50, 0.25, and 0.10 pmol), (B) the selected ion chromatogram (SIC) of the doubly charged peptide ion, 724.34 ((0.05 m/z). The corresponding SICs were integrated using MassLynx processing software between 68.00 and 71 min. Processing parameters were set for automatic noise measurement, Savitzky-Golay smoothing (three channels, two smoothes), and ApexTrack peak integration. (C) The continuum mass spectrum at the apex of the corresponding 724.34 selected ion chromatogram in panel B (from 600 to 825 m/z). (D) The lock-mass- corrected, centroided mass spectrum of the 724.34 isotope cluster (between 722 and 729 m/z) from panel C (smoothing: Savitzky-Golay, three channels, two smoothes; centering: three channels, centroid top 80%, centered by area) and lock-mass-corrected against the monoisotopic ion of Glu-Fib, 785.8426 m/z). proteins were spiked at levels well below that of the most abundant 2C is normalized to the highest ion in the spectrum to illustrate proteins in the complex background. Six samples were prepared the dilution of the 724.41 MH2+ ion over the six different to reflect a dilution series of the MPDS proteins ranging from 10 concentrations. The data presented in each spectrum illustrate a to 500 fmol/µL. The samples were digested with trypsin as very high degree of similarity with respect to the other coeluting described in the Material and Methods Section, and the resulting peptides in the background of human serum. This similarity is polypeptide mixtures were analyzed in triplicate by LC/MS.22-24 reflected not only in the number of ions present in each scan but To demonstrate that the quantitative information relating to the also in the correlation among their respective intensities and MPDS proteins was available in the acquired LC/MS data, a relative intensity ratios. The degree of chromatographic reproduc- manual analysis was performed on a previously characterized ibility is further supported, at the global level, from the Expression AMRT (m/z 724.41 at 69.5 min). Figure 2A depicts six total ion Informatics processing and analysis of the clustered AMRTs chromatograms (TICs) obtained from the LC/MS acquisitions. obtained from each of the replicate analyses, as will be illustrated For the sake of space, only one replicate TIC is illustrated for later. Figure 2D depicts each spectrum after it has been smoothed each of the six different samples. The TICs illustrate a high degree (Savistky-Golay smoothing, three channels, two smoothes), of similarity among the six different samples, despite an overall centered (three channels, 80% of the centroid top, centered by 50-fold change in the relative levels of MPDS peptides throughout area), and lock-mass corrected against the monoisotopic ion of the six samples. Figure 2B illustrates the selected ion chromato- GFP (m/z 785.8426). Comparison of the lock-mass-corrected mass grams (SICs) for the m/z 724.41 (z ) 2, MH2+) ion at ∼69.5 min measurements obtained from the six individual samples (m/z and the associated integrated peak areas, as determined by 724.41, MH2+) reflects the level of mass precision obtained from MassLynx. The identity of this peptide was validated by DDA to this methodology. It also establishes that one can use an LC/ use as a proof-of-concept model for the subsequent quantitative MS-based approach for relative quantitation of peptide components comparison (data not shown, VVGLSTLPEIYEK peptide from in a complex protein sample, provided that sufficient mass and yeast ADH). Figure 2C illustrates the six individual MS spectra retention time reproducibility are obtained. Table 1 outlines the obtained from each sample at the chromatographic apex of the results obtained from the manual interrogation of the raw data SIC in Figure 2B (m/z 724.41). Each spectrum presented in Figure using the commercially available MassLynx software. The inte- 2192 Analytical Chemistry, Vol. 77, No. 7, April 1, 2005
  • 7. Table 1. Summary Table of the Manual and Automated Analysisa manual processing automated processing (MassLynx) (Expression Informatics) human serum + exogenous theoretical calcd error calcd errorl proteins, pmol ratiob intc MH+ d ppme ratiof (%)g inth MH+ i ppmj ratiok (%) 5.00 1.0 15871 1447.8134 5.9 1.0 545213 1447.8112 -4.4 1.0 2.00 2.5 5498 1447.8082 -2.3 2.9 15.2 205709 1447.8151 -7.1 2.7 8.0 1.00 5.0 2775 1447.8062 -0.9 5.7 14.2 107305 1447.8086 -2.6 5.1 2.0 0.50 10.0 1584 1447.8082 -2.3 10.0 0.1 51992 1447.8089 -2.8 10.5 5.1 0.25 20.0 688 1447.7998 3.5 23.1 15.3 23808 1447.8102 -3.7 22.9 14.4 0.10 50.0 343 1447.8042 0.4 46.3 -7.5 10885 1447.8121 -5.0 50.1 0.2 RMS error 3.1 5.4 4.6 3.5 a The mass measurements and signal response measurements obtained from manual analysis using MassLynx software and automated processing using the Expression Informatics software for the 1447.8048 monoisotopic ion (at ∼69 min) originating from the VVGLSTLPEIYEK peptide of Yeast ADH are described in the Table. b The theoretical relative ratio for the spiked ADH peptide. c The integrated peak measurement obtained using ApexTrack peak integration in Masslynx. d The calculated monoisotopic mass from the lock-mass-corrected measurement of the 12C isotope of the doubly charged ion cluster. e The corresponding ppm error obtained using the Masslynx software when compared to the theoretical monoisotopic mass, 1447.8048. f The calculated relative ratio of each condition compared to the 5 pmol condition from the measured peak response. g The relative percent error between the calculated relative ratio and the theoretical relative ratio. h The integrated peak measurement obtained using the peak integration algorithm in the Expression Informatics software. i The calculated monoisotopic mass from the lock-mass corrected measurement of the doubly charged ion cluster using the maximum entropy algorithm in the Expression Informatics software. j The corresponding ppm error obtained using the Expression Informatics software when compared to the theoretical monoisotopic mass, 1447.8048. k The calculated relative ratio of each condition compared to the 5 pmol condition from the measured peak response. l The relative percent error between the calculated relative ratio and the theoretical relative ratio. grated peak area and accurate mass measurement of the monoiso- human serum peptides throughout the dilution series. Though topic ion for each sample is indicated in Table 1. In addition, the the data presented in Figures 2 and 3 and Table 1 are quite observed mass error (ppm) has been determined, along with the encouraging, the challenge hinges on creating a software process- corresponding calculated response ratios for each of the samples, ing package that is capable of automating the process, whereby when compared to the 5-pmol sample. Upon manual interrogation hundreds or thousands of TICs can be compared quantitatively. of the raw continuum data, the overall quantitative accuracy is Table 2 illustrates the number of AMRTs obtained from each within (10%. The average mass accuracy obtained from MassLynx replicate of each sample, along with the associated combined for the yeast, ADH peptide (724.41 m/z, z ) 2) was below 5 ppm intensity for all extracted AMRTs (after normalization). The (RMS). Table 1 illustrates that the information is available in the variability associated with the number of extracted AMRTs is raw continuum data to display the relative change in abundance presented in Table 2 and illustrates a high degree of reproduc- of the yeast ADH protein (from 5000 to 100 fmol) in the complex ibility across replicate injections. However, the data also illustrate background of human serum. The quality of the mass spectro- a steady decrease in the number of AMRTs reported along with metric data is highlighted in Table 1, which contains the average a decrease in the combined intensity as one examines those accurate mass measurement and corresponding parts-per-million samples containing the highest concentration of exogenous pro- error for the test AMRT in each of the separate samples. It also teins to the lowest concentration exogenous proteins. We plotted includes the average normalized intensity and the corresponding the change in the average number of AMRTs and total intensity intensity ratios from the manual analysis of the yeast ADH peptide versus the spiked protein concentration for the six samples and across all the six experiments. found the data to be linear with R2 values of 0.9878 and 0.9838, The 18 LC/MS experiments were processed with the Expres- respectively (data not shown). Since the background of human sion Informatics software for a profiling analysis study. The serum proteins should not change from sample to sample, it is Expression Informatics results of the same AMRT described our contention that the associated y intercepts of 1964 AMRTs earlier (m/z 724.41 MH2+, 1447.81 MH+) produced an average and 7.0 × 10⁷ intensity counts represent the basal level (number mass precision error below 5 ppm (4.1 ppm, RMS) and an average and associated intensity) of AMRTs present in the human serum. quantitative error of ∼5%. The results obtained from the automated The 18 resulting xml files were generated from the continuum processing of the raw continuum data were, thus, in agreement LC/MS data using the Expression Informatics software and with the manually obtained data from MassLynx, described above. contained both the mass spectrometric and chromatographic The response curves generated from the manual and automated attributes for all extracted AMRTs. The xml files were processed processing of the VVGLSTLEPIYEK tryptic peptide from yeast using the associated clustering algorithm to group identical ADH is illustrated in Figure 3A. These data demonstrate the AMRTs across the replicate injections for all the six samples. In consistency between the two data processing methods, whereby the replicate analysis of the human serum with 5 pmol of MPDS the two normalized response curves are nearly coincident, with protein, 68% of the total AMRTs were replicated in three out of an overall correlation coefficient of 0.999. The results show the three injections (2577 AMRTs of the 3797 total clustered AMRTs). linearity of the two data processing methods across the 2 orders The 2577 replicating AMRTs consisted of ∼87% of the total of magnitude dynamic range inherent in the outlined experiments. detected intensity. The overall trend suggests that the missing Interestingly, the linear response of the exogenous ADH peptide observations are due to the ion detection threshold parameters. (724.41 MH2+) seems to illustrate little or no ion suppression Decreasing the stringency to two out of three replicate injections effects which may have resulted from the high background of resulted in 85% of the total AMRTs and constituted 95% of the Analytical Chemistry, Vol. 77, No. 7, April 1, 2005 2193
  • 8. Figure 3. (A) The response curves of the doubly charged polypeptide ion (observed 724.34 m/z, VVGLSTLEPIYEK peptide from yeast ADH) at ∼69 min from manual interrogation and automated processing of the spiked human serum data. The response measurements were normalized to the maximum observed response from the corresponding dilution series. (B) A subset of 25 response curves obtained from the output of the clustering tool of the Expression Informatics software. The clustered output file was imported into Spotfire, and the data were parsed by the average monoisotopic mass from all replicates of each sample using the trellis option in Spotfire. The average monoisotopic mass for each AMRT component is indicated at the top of each plot. Those AMRTs associated with the human serum (rows 1-4) did not change throughout the dilution series and are indicated by those response curves with a slope of 0, whereas all of those AMRTs that are associated with the exogenous proteins have a similar positive slope (row 5). The AMRTs were validated to each of the corresponding exogenous proteins: 1422.7261 MH+, EFTPVLQADFQK (vovine hemoglobin (R-chain)); 1529.7344 MH+, VGAHAGEYGAEALER (bovine hemoglobin (β-chain)); 1576.7762 MH+, LKPDPNTLCDEFK (bovine albumin); 1578.8098 MH+, VDDFLLSLDGTANK (yeast enolase), and 1580.8387 MH+, QIIEQLSSGFFS PK (rabbit phosphorylase B). total detected intensity. In the replicate injection of the 5-pmol A total of 1776 AMRTs were found in common to all replicates condition, the average intensity measurement for those AMRTs of all six samples, constituting an average combined intensity of which replicated in three out of three injections was 36 666 counts, 7.12 ×10⁷ counts. These results are consistent with the hypothesis whereas the average intensity measurements for the AMRTs regarding the basal level of the human serum AMRTs found to which replicated in either two or three out of three injections was replicate among the six samples. Though one may suspect the 13750 and 8411 counts, respectively. Lowering the ion detection total number of AMRTs to be low, considering the complexity of threshold increases the number of AMRTs reported but also the background of human serum peptides, it should be noted that lowers the total fraction of replicating AMRTs. In addition, the purpose of this study is to verify that the Expression lowering the ion detection threshold does not dramatically affect Informatics software identifies the appropriate change in relative the fraction of total intensity attributed to the replicating AMRTs. abundance among the spiked MPDS peptides. The ion detection 2194 Analytical Chemistry, Vol. 77, No. 7, April 1, 2005
  • 9. Table 2. Summary Table of the Ion Detection Resultsa sample inj 1 inj 2 inj 3 CV, % inj 1 inj 2 inj 3 CV, % 5 pm ProStds HsSera 2 pm ProStds HsSera AMRTs 3142 3231 3212 1.47 2382 2582 2758 7.31 normalized intensity 1.04 × 10⁸ 1.03 × 10⁸ 9.90 × 10⁷ 2.59 8.40 × 10⁷ 8.58 × 10⁷ 8.85 × 10⁷ 2.66 1 pm ProStds HsSera 0.5 pm ProStds HsSera AMRTs 2383 2087 2244 6.62 2005 2062 2106 2.46 normalized intensity 7.61 × 10⁷ 8.22 × 10⁷ 8.18 × 10⁷ 4.27 7.56 × 10⁷ 7.46 × 10⁷ 7.97 × 10⁷ 3.57 0.25 pm ProStds HsSera 0.1 pm ProStds HsSera AMRTs 2012 1939 2058 3.00 1972 2002 1923 2.03 normalized intensity 8.00 × 10⁷ 7.27 × 10⁷ 8.12 × 10⁷ 5.88 7.79 × 10⁷ 7.08 × 10⁷ 7.38 × 10⁷ 4.81 a The total number of AMRTs is indicated for each replicate analysis of the six human serum samples. The sum of the normalized intensity for each replicate injection is listed below each of the corresponding total AMRT values. The coefficient of variation of the extracted AMRTs and their associated normalized intensity is calculated for each replicate injection. The ion detection parameters were set up to extract those multiply charged ions (charge states between 2 and 6) which exceeded 200 counts (center by area, after deisotoping). threshold was set to generate AMRTs which spanned 3-4 orders behavior, and by extension, may be related to the same protein, of magnitude dynamic range within a given sample. The MPDS metabolic, or regulatory pathway(s).33,34 proteins were spiked into the human serum at levels such that Figure 4A illustrates a diagonal plot of the log of the average their intensities were within this window of dynamic range. By normalized intensity for matched AMRTs from the 5-pmol mixture applying these threshold parameters, we were able to demonstrate (x axis) versus the 2-pmol mixture (y axis). The data illustrate the appropriate response with the ADH peptide and, therefore, two distinct clusters of ions spanning close to 4 orders of continue with the analysis to characterize the remaining AMRTs. magnitude dynamic range in ion detection and share 2997 The clustering results were exported from the Expression matched AMRT component pairs between the two conditions. The Informatics software and imported directly into Spotfire for data points are colored by their respective t-test score of the evaluation. With identical components clustered across the normalized intensities for all replicate injections between the two replicate injections of the six samples (dilution series), one can conditions to illustrate that the variance between the two condi- readily obtain response curves for each of the clustered compo- tions is statistically significant. The yellow data points illustrate nents. Figure 3B illustrates response curves for a subset of those matched AMRT components with a t-test score of <0.01, clustered AMRTs, in which the average normalized intensity is indicating that there is less than a 1% chance that the observed plotted as a function of the quantity (femtomole) of spiked MPDS change is not due to the applied perturbation. Although more proteins. The bottom five plots represent an individual peptide sophisticated multicomponent statistical methods could be per- from four of the remaining five exogenous proteins. All of these formed on these data, all the comparisons in this work were response curves have a similar slope that is indicative of the performed using a binary Student’s t-test. The t-test was performed configured serial dilution. The response curves in Figure 3B on only the highly reproducible AMRTs which were found to be correspond to extracted AMRTs that replicated in all six samples in the majority of the replicates for each of the two test conditions of human serum with the exogenous proteins. The AMRTs with (at least two out of three). In the presentation of this work, there the experimentally determined monoisotopic m/z of 1422.7261, was no attempt to correct for missing data. If an AMRT occurred 1529.7344, 1576.7762, 1578.8098, and 1580.8387 represent peptides in only one out of three replicate injections in either of the two from bovine hemoglobin (β-chain), bovine hemoglobin (R-chain), conditions, the AMRT was ignored in the subsequent quantitative bovine albumin, yeast enolase, and rabbit phosphorylase B, processing. Since this approach does not require the use of respectively. The mass accuracies associated with these corre- enrichment techniques, there is quite a bit of peptide redundancy sponding peptides are all within ( 5 ppm of the theoretical tryptic for each representative protein in the sample. By not limiting the peptide mass. All of the plots for the remaining AMRTs have a number of peptides per protein, we can afford to use a conservative slope of 0 and, therefore, correspond to background serum approach to our data reduction scheme and propogate the highest peptides that do not change in relative concentration across the quality data into the quantitative processing without jeopardizing six individual samples. For the point of this illustration, the x axis the number of proteins that can be quantified and subsequently corresponds to the concentration of spiked exogenous proteins. identified. In Figure 4A-E, the blue data points are those AMRTs In a biomarker discovery study, the concentration dependence that did not exhibit any change due to the applied perturbation could easily be replaced by a time course or different perturba- as defined by the Student’s t-test (>0.01). The red data point tions, such as drug dosage or environmental conditions. The ability highlights the AMRT described in Table 1, for the purpose of the to display these response curves (or conditional profiles) for all manual analysis and comparison to the automated processing. matched AMRTs enables one to perform comprehensive global (33) Mirkin, B. Mathematical Classification and Clustering, Nonconvex Optimiza- comparisons rather than multiple binary comparisons. Using this tion and Its Applications; Pardalos, P., Horst, R., Eds.; Kluwer Academic approach, the AMRTs can be rapidly screened and characterized Publishers: The Netherlands, 1996, Chapter 11. on the basis of their collective behavior across the multiple (34) MacQueen, J. Some Methods for Classification and Analysis of Multivariate Observations. In Proceedings of the Fifth Berkeley Symposium on Mathematical conditions. Self-organizing maps (SOMs) or k-means clustering Statistics and Probability; Le Cam, L. M., Neyman, J., Eds.; University of techniques can be used to associate AMRTs that exhibit the same California Press: Berkeley and Los Angeles, CA; Vol 1, pp 281-297. Analytical Chemistry, Vol. 77, No. 7, April 1, 2005 2195
  • 10. Figure 4. Diagonal plots of the normalized log intensity. (A) Comparison of clustered AMRTs between human serum with 5.0 pmol of exogenous protein mixture versus human serum with 2.0 pmol of exogenous protein mixture. For each matched AMRT component, the average log intensity from each condition is plotted along each of the two axes. The data are presented without applying any statistical filters, which are obtained from the clustered data set. (B) Same comparison as illustrated in Panel A; however, the data have been filtered using a number of the available statistical measures obtained from the clustering tool of the Expression Informatics software. The data have been filtered to show only those matched AMRTs which were found to have a coefficient of variation of the normalized intensity of e30% among the replicate injections, (minimum two out of three replicates per condition), as well as an observed mass precision of e10 ppm among the replicate injections. (C) Comparison of clustered AMRTs between human serum with 5 pmol of exogenous protein mixture versus human serum with 0.1 pmol of exogenous protein mixture after applying the statistical filter described above. (D) Comparison of clustered AMRTs between human serum with 5.0 pmol of exogenous protein mixture and human serum with 1.0 pmol of exogenous protein mixture after applying the statistical filter described above. (E) Comparison of clustered AMRTs between human serum with 0.50 pmol of exogenous protein mixture and human serum with 0.25 pmol of exogenous protein mixture after applying the statistical filter described above. The data presented in all panels are colored by binned probability score (p score) from a binary Student’s t-test. Those AMRTs which had a probability score of e0.01 are yellow, whereas those that are >0.01 are blue. The red data point corresponds to the monoisotopic ion of 1447.8048, which originates from the VVGLSTLPEIYEK peptide of yeast ADH. The interpolated black line corresponds to the expected fold change for each binary comparison. 2196 Analytical Chemistry, Vol. 77, No. 7, April 1, 2005
  • 11. Figure 5. (A) A scatter plot of the average normalized intensity of the clustered AMRTs versus their corresponding coefficient of variation among the replicate injections for human serum spiked with 5 pmol of exogenous protein versus human serum spiked with 2 pmol of exogenous protein. The blue data points represent 1840 AMRTs which satisfy the statistical filters described in Figure 2B, whereas the red data points illustrate the 1157 AMRTs that were removed during the filtering process. (B) A histogram plot of the corresponding fold changes determined among the 1840 AMRTs which met the applied statistical measures. From this analysis, it is suggested that the yellow data points AMRT from the filtered data versus the observed coefficient of represent peptides from the MPDS proteins, whereas the blue variation for the entire clustered data set. The blue data points data points originate from peptides from human serum proteins. are the subset of 1840 AMRTs which meet the statistical The information that is provided from this methodology allows parameters described above. As expected, the data illustrate that one to apply user-defined thresholds to the resulting statistical the statistical filtering process had the most significant effect on analysis performed on any of the experimental attributes relating the lowest intensity AMRTs, since they will be most influenced to each AMRT cluster, as well as a minimum replication rate within by coeluting AMRTs and will therefore tend to exhibit the highest and across conditions as a means to extract the highest quality variability (Cv). data for subsequent quantitative analysis. Figure 4B depicts 1840 Manual inspection of the clustered output of the replicate (61.4%) of the matched AMRT component pairs from Figure 4A injections of the 5-pmol condition indicated that less than 80 of after applying a specific set of statistical thresholds to reveal the the AMRTs determined to be found in only one out of three highest quality data. These statistical measurements are provided replicate injections could have been associated with an AMRT by the Expression Informatics software and are included in the determined to have replicated in only two out of three replicate corresponding output file. In this instance, the data were filtered injections. In this particular example, this represents a false by (1) applying a replication requirement, in which corresponding clustering rate of ∼2%. However, since only the AMRTs found to AMRTs must exist in at least two out of the three replicate replicate in only one out of three injections are eliminated from injections for each condition, (2) requiring that the coefficient of the quantitative processing, the information describing these variation for the normalized intensities of an AMRT be e30% and potentially discarded AMRTs is still captured in those AMRTs (3) requiring that the mass precision of clustered AMRTs be <10 which occurred in two out of three injections. ppm across all samples. After applying the statistical thresholds, One of the key features of this methodology is that it is an 1840 of the initial 2997 matched AMRTs (61.4%) remained to unbiased approach. The method does not require prescreening illustrate the two distinct sets of peptides, the unaffected human of polypeptide pools for those peptides that contain specific amino serum peptides and the affected MPDS peptides. The breadth of acids. This unbiased approach produces significantly more peptide each group of ions along the two diagonals is influenced by the ions per protein than some other quantitative methodologies which degree of variability inherent to the analytical method and will utilize isotope-coded affinity tags. In addition, the quantitative determine the confidence interval for a specific fold change. nature of this methodology allows the user to apply statistical Interestingly, the 1840 statistically significant AMRTs represent methods to remove polypeptide ions (AMRTs) that exhibit >90% of the total average normalized intensity found in each questionable reproducibility from further consideration without condition. A total of 724 of the 2997 AMRTs were attributed to jeopardizing the ability to find lower level changes. Figure 5B AMRTs which occurred in only one out of the three replicate depicts a histogram plot of the observed fold change for the 1840 injections, an additional 384 AMRTs had coefficients of variation filtered AMRTs. The data presented illustrate two Gaussian >30%, and 49 AMRTs had mass precision errors exceeding 10 distributions about the x axis which are centered at values of 1.0 ppm. This indicates that the most variable data are due to the and 2.5. These values correlate with the predicted results for the lower intensity AMRTs, as can be seen in Figure 5A. Figure 5A serum-related peptides (no change) and the spiked exogenous depicts a scatter plot of the average normalized intensity of each peptides (2.5-fold change). Analytical Chemistry, Vol. 77, No. 7, April 1, 2005 2197
  • 12. Figure 4CD represents two additional diagonal plots of the log AMRTs (tryptic peptides) that will exhibit the same change in average normalized intensity of the 5-pmol mixtures versus both expression within some reasonable tolerance. It is suggested that the 100-fmol and 1-pmol mixtures. The results from Figure 4C the use of accurate mass in conjunction with the quantitative fold begin to test the limits of this methodology. At 100 fmol of spiked change provides additional specificity to allow rapid screening of MPDS protein, we are approaching the limit of detection for the complex protein mixtures for targeted proteins of interest which 300-µm scale chromatography selected for these series of experi- exhibit a change in relative abundance. In instances for which ments. This can manifest itself in the results by attenuating the further validation is needed, the user has the ability to construct expected fold change, producing more scatter between the upper a targeted include list for subsequent MS/MS analysis from the and lower limits of the expected fold change. In addition, it should accurate mass and retention times (AMRTs) obtained from the be noted that there are a number of peptides from the exogenous LC/MS acquisition. However, the parallel LC/MS and LC/MSE MPDS proteins that are chemically identical to a subset of the strategy implemented for this analysis contains not only the human serum proteins. Among these are human serum albumin precursor ion information but also the associated fragment ion and human hemoglobin. These chemically identical peptides will information from all the observed precursors and allows one to show an attenuated fold change as a function of their relative identify the precursor ions without having to perform the targeted abundance over that of the endogenous peptide. Figure 4E MS/MS experiment.31 Low-energy precursor data are collected illustrates the 250-fmol mixture versus the 100-fmol mixture. These into function 1, while the associated elevated-energy data are plots illustrate two distinct ion distributions of AMRTs, which collected into the second function. The low-energy precursor ions correlate with the relative concentration change of the MPDS are associated with their corresponding high-energy fragment ions proteins between the two samples as well as those unaffected using the obtained chromatographic attributes. In this type of human serum proteins. The blue data points represent those experiment, the software uses both the low- and elevated-energy AMRTs that do not show any relative change with statistical data for qualitative assignment.20 significance between the two conditions (human serum proteins); The data presented in this manuscript illustrate that the the yellow data points represent those peptide components that Expression Informatics software is capable of reducing large sets do exhibit statistically significant changes between the two of LC/MS analyses from complex protein mixtures to a simple conditions (MPDS proteins). list of AMRT components that have undergone a change in relative To confirm the quantitative results illustrated in Figure 4A- abundance due to the applied perturbation. These capabilities are E, we performed a simple peptide mass fingerprinting search using provided for by the use of the ion detection, clustering, and the average mass measurement of each AMRT that was found in quantitative functionalities. Having the ability to reduce these at least two out of three replicate injections from all six conditions complex protein mixtures to a simple list of AMRT components with a t-test probability score of e0.01 (67 AMRTs in all). We greatly simplifies the problem of properly identifying the proteins searched a Swissprot database of over 200 000 entries at 5 ppm affected by the applied perturbation. In many cases, a subsequent mass accuracy with no missed cleavages and required four protein identification from such complex protein mixtures can be minimum peptides to match. The search results accounted for ascertained from a simple peptide mass fingerprint of the specific 59 of the 67 total AMRTs. The 59 AMRTs identified 47 proteins AMRTs within a given fold change window. To illustrate this by peptide mass fingerprint, which included the 5 spiked in powerful capability, we conducted a PMF search with only those proteins (MPDS proteins) as well as 37 isoforms of the MPDS AMRTs present in at least two out of the three replicate injections proteins from different species, including 23 different isoforms of for all conditions (5000-100 fmol MPDS proteins), with Cv’s of glycogen phosphorylase. Last, the final five identifications were the associated replicating intensities of under 30%, with a mass examples of very high molecular weight proteins (>120 kDa) precision of under 10 ppm, and illustrating a fold change with a which have tryptic peptides with monoisotopic masses in common t-test score of <1% (Figure 4). The PMF search was queried with the MPDS proteins. The level of redundancy is not surprising, against a human database of 27 000 entries along with the five since the search was performed using a non-species-specific exogenous proteins and was conducted without considering any database. In a true biomarker discovery experiment, the peptide missed cleavages and with a mass accuracy of <10 ppm. The PMF mass fingerprint would most likely be restricted to a nonredundant search returned 33 peptides from rabbit glycogen phosphorylase, database of a specific organism to reduce the number of isoforms 18 peptides from bovine serum albumin, 14 peptides from yeast one may obtain from the homology/identity found in a cross- enolase, 12 peptides from yeast alcohol dehydrogenase, 4 peptides species database. from bovine hemoglobin (R), and 7 peptides from bovine hemo- If we had spiked the proteins in at different concentrations, globin (β). Among the set of identified exogenous proteins, the we could have used the quantitative fold change of the AMRTs peptide VVGLSTLEPIYEK (1447.8048 MH+) was among the 12 as an additional filter or scoring mechanism to eliminate the peptides matched to yeast alcohol dehydrogenase. This peptide wrongfully assigned high molecular weight protein assignments. was one of the most intense peptides from yeast ADH and We also suggest that the use of accurate mass in conjunction with exhibited a linear response when spiked into human serum, from fold change is a powerful strategy for MS-based protein identifica- 100 to 5000 fmol (Figure 3A). tion. Since enzymatically digested proteins typically produce many Figure 6 shows the 19 peptides matched from bovine serum peptides and this methodology does not limit the number of albumin via the PMF search. The average normalized intensity observed peptides per protein through the use of any type of values are plotted for each of the albumin peptides for each of affinity capture enrichment protocol, proteins which exhibit a the six conditions (5000 to 100 fmol, on column). It is clear from relative fold change in expression will produce a number of this illustration that not all peptides ionized with sufficient 2198 Analytical Chemistry, Vol. 77, No. 7, April 1, 2005
  • 13. Figure 6. Intensity profiles for characterized bovine serum albumin peptides. The AMRTs which originated from bovine serum albumin were identified by PMF. The identities of the corresponding bovine serum albumin AMRTs were correlated to the clustered output file. The average intensity measurements for each of the bovine serum albumin peptides (AMRTs) are plotted from each of the six conditions. efficiency to be detected in all six conditions. In addition, as the mass spectrometric attributes from an LC/MS analysis of a concentration of the protein was decreased, the number of complex protein digest in a quantitatively reproducible manner. detected peptides decreased in a predictable manner. The Additionally, the ion detection and clustering capabilities provided observed peptides exhibit a characteristic ionization pattern that in the Expression Informatics software demonstrated that one can is consistent throughout the six experiments. The continuity of monitor slight changes in relative abundance among different the ionization pattern illustrates the level of reproducibility one conditions without requiring the use of isotopic or metabolic can obtain with ESI-mass spectrometry. This ionization pattern labeling strategies. The analytical protocols employed in this study serves as a characteristic feature (ionization map) for the tryptic demonstrate that the combination of accurate mass and chro- peptides of bovine serum albumin and can be taken into account matographic retention time, in conjunction with other measured for future characterization of this protein. These results indicate attributes, such as fold change and ion intensities, can provide a that the two bovine serum albumin peptides, LGEYGFQNALIVR unique signature for each peptide contained in a complex protein and HLVDEPQNLIK, are the two most efficiently ionized tryptic digest mixture. We believe that there is ample literature precedent peptides. Using this information, it is not surprising that the least to indicate that electrospray time-of-flight mass spectrometry is intense peptides observed at the 5-pmol level are not observed at clearly capable of producing quantitative results for peptide ions either the 100 or 250 fmol level (LCVLHEK, EACFAVEGPK, over 3 orders of magnitude in concentration. We contend that DLGEEHFK, and AEFVEVTK). If the ionization pattern for a given the Expression Informatics software is capable of extracting AMRT protein was known, one could predict which peptides should be information at the low end of detection, provided that ion statistics present at a given concentration of protein. Additionally, using support an accurate mass measurement and produce a defined this information, the PMF assignment could be validated further chromatographic apex. The experiments outlined in this manu- by correlating the observed ionization pattern to the known tryptic script were performed over a period of 36 h. An additional set of peptide ionization pattern for that particular protein. The ultimate experiments were performed with the dilution series of the MPDS goal for this type of approach would be to create ionization maps proteins alone over the same 36-h time frame for the purpose of for all proteins in a proteome database. If this could be ac- another topic. The quantitative results from the two individual sets complished, identifying proteins by mass, retention time, fold of experiments indicated that the methodology is a robust method change and ionization efficiency would become an exercise in accounting (or ion accounting). for global protein profiling. The demonstrated ability to generate response curves for the CONCLUSION human serum and the exogenous protein peptides suggests that The purpose of the this work was to illustrate that the the sample preparation and data acquisition were quantitatively Expression Informatics software could reduce the complexity of reproducible, with average Cv’s of <15%. Although one can use the continuum LC/MS data to a list of AMRT components that affinity capture techniques to enrich samples for peptides contain- have undergone a statistically significant change in relative ing specific amino acid residues and thereby simplify the polypep- abundance due to the applied perturbation. The Expression tide pool, we have shown that this is not necessary to obtain Informatics software is capable of extracting chromatographic and accurate quantitation. On the contrary, our methodology provides Analytical Chemistry, Vol. 77, No. 7, April 1, 2005 2199
  • 14. access to more peptides per protein and allows one to establish ions that were detected in the elevated energy function. Although high confidence levels for each quantified protein. it is not described in this manuscript, the additional information The peptide components which exhibit significant up- or down- provided in the elevated energy function affords additional regulation can be further investigated by conducting a modification specificity for each of the detected precursors in the low energy of the traditional peptide mass fingerprint analysis. One can function. Although changing the chromatography column may maximize the information obtained from the clustered AMRT cause a slight shift in the observed retention time, the associated analysis by recognizing that a relative change in abundance for a elevated energy accurate mass measurements will allow one to particular protein will manifest itself by producing multiple peptide manage the data properly across multiple experiments. As fragments which should exhibit the same relative change in described in this work, the precursor information obtained in this abundance. Using the quantitative information available from the mode is quantitative and reproducible. A more detailed explanation clustered AMRT analysis, the user can choose to submit for PMF of the alternate scanning methodology is described in the identification, only those accurate mass measurements which following study by Silva and co-workers31 and will be the topic of exhibit the proper fold change. Organizing the AMRTs by future work. observed fold change for subsequent PMF identification is quite empowering, since it provides additional stringency to the qualita- ACKNOWLEDGMENT tive identification of a protein that is quantitatively consistent with The authors acknowledge the valuable contributions of Timo- the data. For those users who require structural information for thy Riley and Bob Bateman throughout the development of this qualitative peptide/protein assignment, the list of AMRTs can be work. The authors also acknowledge Jeanne Li for her contribu- used to organize a targeted include list for subsequent peptide tions in the laboratory and throughout the editing of this identification studies by traditional methods, such as targeted MS/ manuscript. Last, we extend our gratitude to our collaborators MS. Using the accurate mass and retention time information who helped develop the Expression Informatics software by obtained from the AMRT analysis, as well as the associated embracing the methodology and applying themselves to demon- quantitative and statistical analysis, one can carry out a targeted strate its utility (Stanely Hefta, Ashok Dongre, Gregory Opiteck, MS/MS analysis to identify only those AMRTs that have under- Martin Wiedmann, Deborah H. Smith, Arthur Moseley, Kevin gone a statistically significant change in relative abundance Blackburn, Danie Schlatzer, Craig A. Townsend, Minerva Hughes, between conditions. This would eliminate the accumulation of MS/ Christopher T. Walsh, and Jun Yin). MS data on proteins that are not affected in specific studies and would allow one to maximize the efficiency of the MS/MS data SUPPORTING INFORMATION AVAILABLE collection per unit time in a biomarker discovery setting. However, Four posters that were presented at the 52nd ASMS Confer- the initial LC/MS experiments could have been acquired using ence on Mass Spectrometry and Allied Topics, 2004, Nashville, the alternate scanning methodology described in this work, in TN (see explanations of refs 27, 28, 31, 32 in text) are available which the collision energy alternates between low and elevated as Supporting Information. This material is available free of charge energy throughout the entire LC/MS analysis to capture both via the Internet at http://pubs.acs.org. precursor and associated fragment ion information in one experi- ment. Precursor information is captured in one function under low-energy conditions, and the associated fragment ions are Received for review October 19, 2004. Accepted January captured in a second function under elevated-energy conditions. 13, 2005. Each reported precursor will have an associated set of fragment AC048455K 2200 Analytical Chemistry, Vol. 77, No. 7, April 1, 2005