1. RESEARCH AND PRACTICE
Effects of Alcohol Tax Increases on Alcohol-Related
Disease Mortality inAlaska: lime-Series Analyses
From 1976 to 2004
I Alexander C. Wagenaar, PhD, Mildred M. Maldonado-Molina, PhD, and Bradley H. Wagenaar, BA
Morbidity and mortality associated with con-
Objective.We evaluated the effects of tax increases on alcoholic beverages in
sumption of alcoholic beverages constitute a
1983 and 2002 on alcohol-related disease mortality in Alaska.
substantial public health burden in the United
Methods. We used a quasi-experimental design with quarterly measures of
States. An estimated 85 000 deaths per year
mortality from 1976 though 2004, and we included other states for comparison.
are associated with drinking, including car Our statistical approach combined an autoregressive integrated moving average
crashes, other unintentional injuries, homicide, model with structural parameters in interrupted time-series models.
suicide, and a range of diseases, particularly Results. We observed statistically significant reductions in the numbers and
those affecting the liver, pancreas, and heart.1-3 rates of deaths caused by alcohol-related disease beginning immediately after
All states have taxes specific to alcoholic bever- the 1983 and 2002 alcohol tax increases in Alaska. In terms of effect size, the
ages; some of these taxes are imposed primarily reductions were -29% (Cohen's d=-0.57) and -11% (Cohen's d=-0.52) for the 2
to generate revenue, 4 whereas others are osten- tax increases. Statistical tests of temporary-effect models versus long-term-
sibly intended to promote public health and effect models showed little dissipation of the effect over time.
Conclusions. Increases in alcohol excise tax rates were associated with
welfare by limiting alcohol consumption.5'r
immediate and sustained reductions in alcohol-related disease mortality in
More than 100 studies have examined the
Alaska. Reductions in mortality occurred after 2 tax increases almost 20 years
relationship between alcoholic beverage prices
apart. Taxing alcoholic beverages is an effective public health strategy for
(or alcohol tax rates as a surrogate for prices) reducing the burden of alcohol-related disease. (Am J Public Health. 2009;99:
and various indices of sales or consumption of 1464-1470. doi:10.2105/AJPH.2007.131326)
alcohol (see Babor et al.7 and Chaloupka et al. 8
for recent reviews). With a few exceptions (e.g.,
Salomaag), studies consistently find price or tax studies found that higher beer taxes were not intervention while using comparison data se-
31 ties to rule out or control for possible alterna-
levels to be inversely related to sales or con- specifically related to levels of robbery or rape.
sumption of alcoholic beverages, with the mag- Finally, a number of studies have found higher tive explanations for the effect.45 A good ex-
nitude of the effect in terms of elasticities ranging alcohol prices or taxes to be associated with perimental design has a number of benefits: it
from -0.2 to -2.0, depending on population, lower rates of alcohol dependence37' 38 and liver can allow researchers to eliminate many con-
2 3
methods, time period, and specific beverage. dcrrhosis. 23 '39 -4 In contrast, Schweitzer et al.4 founding factors as a threat to a causal interpre-
Substantially fewer studies have examined did not find a significant relationship between tation of an observed relationship without the
the effects of alcohol prices or taxes on mea- alcohol prices and rates of alcohol dependence. need to identify, measure, and statistically control
sures of alcohol-related morbidity or mortality, To elicit more information about the effect for all possible confounds; it can avert debates
and of those that have, most have focused on of alcoholic beverage taxes on disease mortality, about which of the numerous specific control
injury rather than disease. Of 18 studies that we examined patterns of alcohol-related disease variables to include; and it can prevent re-
examined price or tax effects on traffic crashes, mortality in the state of Alaska over a 29-year searchers from introducing biases into the study
15 found that higher alcohol prices or taxes period to determine whether 2 major increases by including only those control variables for
were associated with fewer crashes,"'-24 but 3 in alcohol tax rates, 1 in 1983 and the other which operational measures are available.
found no effect25 27 Sloan et al.2 5 found that in 2002, affected alcohol-related mortality in Given that Alaska is unusual compared with
alcohol prices were not related to falls, fires, or the state. other states in terms of weather, population,
other unintentional injury rates, but OhstWldt and economy, health, and many other factors, no
Morrisey 28 found that higher beer taxes were METHODS other single state is optimal for comparison
related to lower rates of nonfatal industrial with Alaska. Therefore, we elected to use the
injuries. In addition, 8 studies (6 of which were Research Design aggregate of all other states as the comparison
conducted by 1 research team) found higher The research design of the study can be group. This comparison ensures that effects
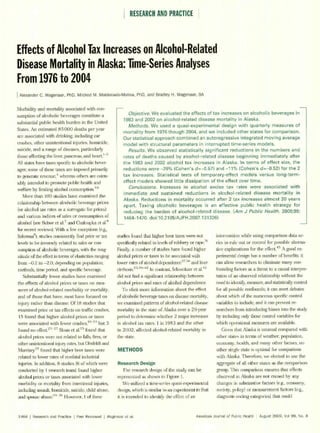
alcohol prices or taxes associated with lower represented as shown in Figure 1. observed in Alaska are not caused by any
morbidity or mortality from intentional injuries, We utilized a time-series quasi-experimental changes in substantive factors (e.g., economy,
including assault, homicide, suicide, child abuse, design, which is similar to an experiment in that society, policy) or measurement factors (e.g.,
and spouse abuse. 2 9 3' However, I of these it is intended to identify the effect of an diagnosis coding categories) that could
1464 l Research and Practice I Peer Reviewed I Wagenaar et al. American Journal of Public Health I August 2009, Vol 99, No. 8
2. RESEARCH AND PRACTICE
Experimental 01 0, 0 X] 0 0,0
(Alaska) -, . .... 0" 1 ... "
Comparison 0,, 0,: 0,1 ... ... ......... ... ... .. .0
(other states)
Note. Otrepresents an observation at a given time t, with each t being one quarter of a calendar year. The first observation took place at time tj, the first quarter of 1976, and the series
ended at t116,the last quarter of 2004. X,represents an increase inalcohol tax inAugust 1983, when the excise tax on beer increased from $0.25 to $0.35 per gallon, the tax on wine increased
from $0.25 to $0.35 per gallon, and the tax on distilled spirits increased from $4.00 to $5.50 per gallon. 44 X represents a subsequent increase in alcohol tax in October 2002, when the
2
tax on beer increased to $1.07 per gallon. the tax on wine increased to $2.50 per gallon, and the tax on spirits increased to $12.80 per gallon. 44 m represents the number of quarterly observations
before the first tax increase (m=30). n represents the number of quarterly observations after the first tax increase and before the second tax increase (n=77). These 2 sets of observations
are summed with 9 follow-up quarterly observations after the second tax increase, producing a total of 116 observations.
FIGURE 1-Representation of study design.
affect observed alcohol-related mortality States. We obtained the complete annual data addition to analyses of mortality frequency
over time. set containing 1 record on each deceased per- counts, we also used annual estimates of popu-
We further strengthened the study's design son for each year from 1976 through 2004 lation from the US Census Bureau to calculate
by examining 2 separate increases in tax rates from the National Bureau of Economic Re- death rates per 100 000 population aged 15
occurring almost 20 years apart. This element search.5" From these data we created quarterly years and older.' 5-5
of the study allowed us to test the replicability coimts of deaths stratified by underlying cause of
of observed effects, and it ensured that ob- death, first for Alaska and then for the other Statistical Analyses
served effects were not caused by unique states as a group. Given the large number of repeated obser-
circumstances not generalizable overtime, thus We cumulated counts by cause of death into vations, we used an approach that combined a
ruling out the "contemporaneous history" 3 outcome variables. (1) Alcohol-caused mor- Box-Jenkins autoregressive integrated moving
threat to internal validity first articulated by tality, which represents all deaths caused by average (ARIMA) model with structural pa-
Campbell and Stanley.41 Moreover, a simulta-
' diseases for which the alcohol-attributable rameters, 59,6
neous evaluation of the effects of the 2 tax fraction is 1.0 (e.g., alcoholic liver disease,
increases allowed us to perform a long-tern alcohol-induced chronic pancreatitis, alcohol (1) (1 -B 4
) yt =o+o(1 +o,)212t
11, +fiZ,
follow-up evaluation of the earlier tax increase. psychoses, alcohol abuse, alcohol dependence +i/jiX+(f - OB4)u1,
syndrome, alcoholic polyneuropathy, alcoholic
Data Collection cardiomyopathy, alcoholic gastritis, and acute where Y,=I to Yj - are the 3 outcome measures
Data on alcohol tax rates in Alaska were alcohol poisoning). (2) Alcohol-related mortal- by quarter from t= (first quarter 1976) through
collected from a number of sources. The Al- ity, which represents all deaths caused by t=116 (last quarter 2004); a is a constant; ol is
cohol Policy Information System provides diseases with alcohol-attributable fractions the estimated effect of implementation of the
summaries of US state and federal tax rates for 0.35 and higher but less than 1.0 (i.e., other 1983 alcohol tax increase; Iluis a step function
multiple classes of alcoholic beverages, details cirrhosis; cholelithiasis; acute and chronic equal to 0 before the 1983 tax change took effect
on changes in rates, full legal citations, and text pancreatitis; malignant neoplasms of the and 1 after the change; no is the estimated effect
2
from the relevant codified statutes, starting mouth, pharynx, esophagus, liver, and breast; of implementation of the 2002 alcohol tax
with calendar year 2003 .47-'9 Data for the epilepsy; and cardiovascular diseases including increase; 12t is a step function equal to 0 before
period prior to 2003 were collected by experi- hypertension, ischemia, arrhythrnia, cerebro- the 2002 tax change took effect and 1 after the
enced research attorneys who used standard vascular disease, and ischemic and hemor- change; [3 is the estimated effect of Z, the
legal research methods to search the records of rhagic stroke). (3) The third variable is the sum frequency (or rate) of alcohol-related disease in
codified statutes in Westlaw databases (http:// of the first 2 variables. Alcohol-attributable the comparison states; 4, is a vector of estinates
www.westlaw.com, fee-based membership) when fractions for diseases, categorized by Interna- that controls for outliers X,; E)is the first-order
available, and who searched law library hard- tional Classification of Diseases (ICD)5"code, are seasonal moving average parameter; ut is a
copy materials for earlier years. based on RehIm et al.,52 English et al,53 and random (white noise) error component; and B is
Data on alcohol-related mortality outcomes Shultz et al., 54 which in turn were based on the backshift operator such that B4 (yd equals
were based on death-ceitificate data recorded comprehensive reviews and meta-analyses of the YI-4. We used SAS version 9.1 Proc ARIMA
by the National Vital Statistics System of the literature (for the ICD codes used, see the table (SAS Institute Inc, Cary, NC) to estimate all
National Center for Health Statistics. which available as a supplement to the online version of models, and we used a strict significance crite-
includes all deaths occurTing Mithmn the United the article at http://Nw,ww.ajph.oi-g). Finally, in nion of Pat less than .001 to evaluate all models
August 2009, Vol 99, No. 8 1 American Journal of Public Health Wagenaar et aLi. Peer Reviewed I Research and Practice I 1465
3. RESEARCH AND PRACTICE
for effects of outliers. A maximum of 1 outlier TABLE 1-Effects of Alcohol-Tax Increases on Alcohol-Related Disease Mortality: Alaska,
was detected and controlled in any model. 1983 and 2002
For each Alaska outcome measure (alcohol-
Estimate Percentage
caused mortality, alcohol-related mortality, and 2
(SE) t P Change
R Cohen's d
the sum of both), 4 specific models were esti-
mated: (1) frequency, (2) rate per 100000 Allalcohol-related and alcohol-caused mortality (AAF_>0O35)
population aged 15 years and older, (3) rate per Effects of 1983 alcohol-tax increase
100000 population including the comparison Frequency 0.77 -5.65 (1.73) -3.27 .00 -28.6 -0.57
states covariate, and (4) natural logs of rate per Rate per 100000 population 0.33 -1.37 (0.50) -2.77 .01 -22.5 -0.88
100000 population including the comparison Rate per 100000 population with other states 0.33 -1.19 (0.52) -2.28 .02 -19.6 -0.77
states covariate. Frequencies were examined covariate
for initial evidence of effects. Rates per popu- Lograte per 100000 population with other states 0.26 -0.19 (0.08) -2.23 .03 -17.0 -0.79
lation were examined to assess whether ob- covariate
served differences were caused by population Effects of 2002 alcohol-tax increase
changes. Then the comparison states covariate Frequency 0.77 -5.15 (2.11) -2.44 .02 -11.3 -0.52
was included to assess whether observed ef- Rate per 100000 population 0.33 -1.23 (0.57) -2.17 .03 -13.0 -0,79
fects in Alaska may have been caused by other Rate per 100000 population with other states 0.33 -1.36 (0.57) -2.39 .02 -14.5 -0.88
factors changing over time across states. The covariate
natural logs were modeled to ensure estimates Log rate per 100000 population with other states 0.26 -0.19 (0.09) -2.08 .04 -17.1 -0.80
were not affected by heteroscedasticity covariate
(changing variance in death rates over time). 1.0)
Subset analysis: alcohol-caused mortality (AAF=
Finally, to statistically test whether the effects Effects of 1983 alcohol-tax increase
were permanent or temporary, we estimated an Frequency 0.68 -2.93 (1.48) -1.98 .05 -24.4 -0.38
alternative specification of the time-series Rate per 100000 population 0.30 -0.77 (0.38) -2.05 .04 -20.8 -0.59
model that used a first-order transfer function Rate per 100000 population with other states 0.31 -0.74 (0.38) -1.96 .05 -19,9 -0.56
on the differenced tax-change variable: covariate
Log per 100000 population with other states
rate 0.22 -0.13 (0.10) -1.33 .19 -12.1 -0.40
(2) (co/i-6B)(1-B)I.
covariate
where (o is the estimated shift effect of It, Effects of 2002 alcohol-tax increase
representing the 1983 alcohol tax increase; 6 is Frequency 0.68 -2.19 (1.75) -1.25 .21 -7.0 -0.29
the estimated rate of decay of the initial effect; Rate per 100000 population 0.30 -0.59 (0.44) -1.35 .18 -9.1 -0.45
and B is the backshift operator, such that B(I) Rate per 100000 population with other states 0.31 -0.55 (0.44) -1.25 .21 -8.5 -0.42
equals I,-,. If the estimated value for 6 in such a covariate
model is very close to unity, the effect is long- Log rate per 100000 population with other 0,22 -0.11 (0.11) -1.00 .32 -10.8 -0.36
term and does not dissipate. If the estimate of 6 states covariate
is less than 1, the immediate effect decays over Subset analysis: alcohol-related mortality (AAF 0.35 <1.0)
>
61
time. See chapter 3 of McCleary and Hay for a Effects of 1983 alcohol-tax increase
detailed description of transfer-function model- Frequency 0.31 -2.45 (1.17) -2.13 .04 -31.6 -0.65
ing that is accessible to nonstatisticians. Rate per 100000 population -0.15 -0.44 (0.31) -1.41 .16 -18.2 4053
All of the models fit the data well and Rate per 100000 population with other states -0.13 -0.42 (0.36) -1.19 .24 -17.7 -0.52
explained substantial proportions of the vari- covariate
ance in deaths over time. Models of frequencies Log rate per 100 000 population with other states-0.04 -0.27 (0,13) -2.21 .03 -24.0 -0.75
had R2 of 0.68 to 0.72 (after adjustment for covariate
number of degrees of freedom used in the Effects of 2002 alcohol-tax increase
model). Given that rates or ratios naturally Frequency 0.31 -1.81 (1.40) -1.29 .20 -12.9 -0.48
have substantially higher measurement error Rate per 100000 population -0.15 0.01 (0.36) 0.04 .97 0.4 0.02
do than the numerator frequencies alone, ad- Rate per 100000 population with other states -0.13 -0.22 (0.37) -0.58 .57 -7,4 -0.26
2
justed R for those models was somewhat covariate
lower, ranging from 0.13 to 0.33. Finally, pa- Log rate per 100000 population with other states -0.04 -0.16 (0.13) -1.20 .23 -14.9 -0.44
rameter estimates in terms of change in fre- covariate
quency or population rate of death were
Note. AAF=alcohol-attributable fraction. Results derived from autoregressive integrated moving average models combined
transformed into 2 standardized metrics of 2
with structural parameters. /2 adjusted for degrees offreedom used in model; calculated negative e in second subset analysis
effect: percentage change in the outcome based results from increased variance heterogeneity.
1466 1 Research and Practice ý Peer Reviewed I Wagenaar et al. American Journal of Public Health I August 2009, Vol 99, No. 8
4. RESEARCH AND PRACTICE
on the average of the 4 quarters immediately a plot of the data (Figure 2), especially for states did not experience the mortality declines
prior to a given tax rate change, and Cohen's the 1983 policy change, for which a 19-year that Alaska experienced, and the effects ob-
d,6 2 the effect size in standard deviation units, follow-up period is available. served for Alaska cannot be attributed to
calculated with the raw standard deviation of the We analyzed the death rate to control for broader trends or other factors experienced
outcome over the entire data series. Percentage changes in size of the population over time, but across the other states. Repeating this model
change is a commonly used, easily understood this analysis did not appreciably change the on the natural logs of the death rate did not
metric of interest to prevention practitioners and estimated effects (Figure 3). Percentage reduc- change the findings. Finally, the estimates and
policymakers, and the Cohen's d effect size per- tions in alcohol-related mortality declined standard errors in Table 1 show that the mag-
mits comparison of effect sizes across a wide slightly to -23%/o for the 1983 tax increase and nitudes of the effects of the 2 tax changes were
range of intervention and outcome domains. increased slightly to -13%/o for the 2002 in- not significantly different from each other.
crease. Estimated Cohen's d effect sizes for the The second and third panels of Table 1 pro-
RESULTS tax increases were larger for the rate per vide these same estimates of effect separately
100 000 population measure than for the for 2 subsets of the overall outcome measure:
Results show statistically significant reduc- analyses of raw numbers of deaths (-0.88 and (1) alcohol-caused mortality, for which the
tions in the numbers of deaths caused by -0.79). These results confirm that observed alcohol-attributable fraction is 1.0, and (2)
alcohol-related disease beginning immediately effects of the tax policy changes are not attrib- alcohol-related mortality, for which the alcohol-
after the 1983 and 2002 alcohol tax increases utable to overall changes in population. attributable fraction ranges from 0.35 to 0.99.
in Alaska (Table 1). Estimated reductions in We obtained a third set of effect estimates by In the second subset it is not known with
mortality are of clear substantive importance: adding the comparison states to the model, to certainty whether any individual death was
the 1983 tax increase was followed by a -29% determine whether observed alcohol-tax ef- caused by alcohol, but as the sample increases in
change in number of deaths (23 deaths averted fects in Alaska reflected mortality reductions size we are increasingly confident in the pro-
per year), and the 2002 tax increase was fol- caused by any of a number of other possible portion of deaths that were caused by alcohol.
lowed by a -11% change in deaths (an addi- factors operating across states. Again, there was We found no significant differences in the
tional 21 deaths averted per year). In terms of no appreciable change in the estimates. The magnitudes of the estimated effects of the 2 tax
Cohen's d effect size, the reductions were 1983 tax increase was associated with a -20% changes across these 2 outcome subsets (Table
-0.57 and -0.52 for the 2 tax increases, re- change in mortality (d=-0.77), and the 2002 1). The sole obvious consequence of disaggre-
spectively, in chronological order. These effects increase was associated with a -150/o change in gating the outcome is increased variability of the
are large enough to be clearly discernible from mortality (d=-0.88). Thus, the comparison estimates (increased standard errors), an ex-
pected result of the smaller and more variable
mortality counts in the subset analyses.
S•Actual --- Linear
trend -- Model predicted] An examination of the actual death counts
by quarter (Figure 2) could be interpreted to
mean that the obvious sudden effect of the
1983 tax increase 2002 tax increase
60 1983 tax increase dissipated over time, be-
cause after 5 years the average numbers of
deaths per quarter returned to the levels they
50
were immediately before the policy change.
Simple comparisons of the linear slopes of the
40 pre-1983 and post-1983 periods show that
they are similar (pre-1983 slope=0.21 vs
0 30
post-1983 slope=0.32), but the slightly larger
post-1983 slope might be interpreted as a
E
z dissipation of the effect seen in the sudden
20
intercept difference in 1983. However, addi-
tional analyses that directly tested alternative
10 hypotheses assuming temporary versus per-
manent effects demonstrated the effect did
not dissipate over time. When we used the
1976 1978 1980 1982 1984 .19 86 1988 1990 19 92 1994 1996 1998 2000 2002 ' 2004 temporary-impact model specification, the
estimate of (oremained essentially the same
Year
(-5.06, SE=1.83), but the estimate of the
FIGURE 2-Frequency of quarterly alcohol-related disease mortality: Alaska, 1976-2004. decay parameter 8 was 0.98 (SE=0.03), very
near unity, demonstrating that the effect did
August 2009, Vol 99, No. 8 American Journal of Public Health Wagenaar et at. I Peer Reviewed I Research and Practice 1 1467
5. RESEARCH AND PRACTICE
conditions that result from decades of high
TABLE 2-Alaska's Alcohol-Tax Rates per Gallon in Constant 2006 Dollars exposures to ethanol (e.g., cirrhosis or cancer).
However, mortality caused by long-term,
1982 (Preincrease) 1983 (Postincrease) 2001 (Preincrease) 2002 (Postincrease)
chronic alcohol use responds immediately to a
Beer $0.46 $0.63 $0.40 $1.20 change in drinking levels, because at any given
Wine $0.46 $0.63 $0.40 $2.80 time there is a reservoir of individuals in the
Spirits $7.28 $9.83 $6.28 $14.35 population who are about to die from a chronic
63
alcohol-related disease. Even modest reduc_
not decay over time.6 ' Moreover, the residual presumed mechanism of effect (alcohol-tax in- tions in current drinking immediately retards
variance of the temporary-effect model was creases and alcohol-related mortality). Com- progression of alcohol-related disease for this
larger than that of the permanent-effect model, plete and accurate quarterly measures of the 2 population, resulting in an immediate reduction
indicating poorer fit of the temporary-effect central intervening factors-retail prices and in the death rate, as found in the present study.
model. drinking behaviors-are not available for the In this regard, alcohol-related disease is not
When we repeated this procedure on the 29-year period studied. However, the theory unlike some other diseases, such as chronic
population-rate outcome variable, we again underlying this mechanism of effect is so well obstructive pulmonary disease (COPD). Chronic,
found no dissipation of effect over time. Similar established that a lack of measures for each long-term exposure to air pollution is one cause
statistical tests of permanent versus temporary intervening effect does not reduce the plausi- of COPD.6 4 Development of COPD resulting
effects for the 2002 tax change are not yet bility of the findings. from exposure to urban air pollution levels usu-
possible, because only 9 postchange data A colleague and a reviewer both sought to ally takes decades. 64 Nevertheless, sudden re-
points are currently available. explain the fact that the effect of the 1983 tax ductions in ambient air pollution result in im-
increase appears to be larger than the effect of mediate reductions in COPD mortality. Pope
DISCUSSION the 2002 tax increase, as shown in the per- et al. reviewed 18 "striking studies ... that
centage-change column in Table 1.Several observed changes in daily death counts asso-
We found that increases in alcoholic bever- reasonable hypotheses quickly come to mind. clated with short-term changes in particulate air
age tax rates were associated with significant For example, general price inflation means that pollution.' 65(r475 ) This pattern of immediate
and substantial reductions of alcohol-related any given alcohol tax increase in dollars per population-level changes in mortality occurs for
disease mortality in Alaska. Reductions in gallon (as alcohol taxes often are measured, both COPD and alcohol-related disease, and for
mortality were observed for 2 tax increases 19 rather than as a percentage of the sale price) the same reason: at any given moment in time,
years apart, indicating that the observed effects would likely be a larger proportion of the total there are many in the population whose cumu-
cannot be attributed to a single historical pe- retail price of a product in 1983 than in 2002. lative exposure (to pollution or alcohol) is near
riod or event, atypical or otherwise. The long- However, close examination of the estimates the threshold that will cause death, and a re-
term follow-up after the first tax increase and standard errors in Table 1 shows no sig- duction in current exposure delays death. A
allowed us to determine that the effect was not nificant differences between estimates of the trajectory or cascade of delayed individual
temporary, but was maintained over time. Our effects of the 2 changes. Moreover, we only had deaths results in population mortality declines
quasi-experimental research design included access to 2.25 years of follow-up data for the that begin immediately when the exposure re-
other states as a comparison group, demon- 2002 tax change. Determination of whether the ductions occur.
strating that the effects observed for mortality 2 tax changes had significantly different long- Another question that could be raised about
in Alaska were not caused by broader national term magnitudes of effect, and the possible causes the time-ordered pattern of observed effects is
trends, factors affecting mortality in common of such differences (if any), requires waiting for related to the continual gradual reduction in
across states, or a sudden change experienced additional follow-up data to become available. real (inflation adjusted) alcohol taxes over time.
across states in 1983 or 2002. Some questions might be raised about Table 2 shows the Alaska tax rates immediately
Our results are consistent with basic eco- the timing of observed effects of alcohol- before and after each tax change in constant
nomic theory and econometric analyses of the tax increases. For instance, scientists and 2006 dollars (adjusted by the consumer price
price elasticity of alcoholic beverages, which practitioners who focus on individual-level index for urban consumers in Anchorage 66).
hold that an increased tax on beverage alcohol disease may find the claim that immediate For example, the beer tax increased from $0.46
is presumed to raise the price to consumers, population-level effects on mortality can be per gallon in 1982 to $0.63 in 1983 at the time
who respond by purchasing and drinking less caused by modest changes in the social envi- of the legislated increase, but then gradually
alcohol. Lower alcohol consumption is then ronment to be biologically implausible and declined to $0.40 by 2001 because of inflation,
thought to reduce risk of death caused by a "counterintuitive," as a reviewer of this article before increasing to $1.20 as a result of the 2002
range of alcohol-related diseases, resulting in a said. A few of the specific causes of death law. Given such a pattern, one might have
decline in mortality counts and rates. Our study included in our outcome measures are the expected any effect of the 1983 tax increase on
validated this account by demonstrating a clear result of the acute toxic effects of ethanol mortality to have dissipated after a decade and a
link between the first and last factors in this ingestion (e.g., poisoning), but most are chronic half of inflation. However, we found little
1468 I Research and Practice I Peer Reviewed I Wagenaar et al. American Journal of Public Health I August 2009, Vol 99, No. 8
6. RESEARCH AND PRACTICE
Contributors
I Acal --- Linear rend - Model pred-ite] A. C_ Wagenaar designed the study and led the writing of
the article. M-M. Maldonado-Molina conducted the sta-
1983tax increaw
tistical analyses. B.H. Wagenaar designed the outcome
12 measures by alcohol-attributable fraction and collected
mortality data. All authors participated in editing and
revising the article.
10
Acknowledgments
75 This study was funded by Robert Wood Johnson Foun-
dation (grant 058005).
0 The authors appreciate the assistance of Linan Ma
with data management and Amy L. Tobler with prepa-
6 ration of the article and are thankful for the helpful
comments made by the reviewers and Frank Cbaloupka.
Note. Findings and conclusions are solely the authors'
and do not necessarily represent the views of the Robert
Wood Johnson Foundation.
Human Participant Protection
The University of Florida institutional review board
reviewed this study and deemed that its study protocol did
1976 1978 1980 1982 1984 1986 1988 1990 1992 1994 1996 ' 1998 2000 ' 2002 ' 2004 not require approval because we had no contact with
participants, data were based on public mortality files, and
Year analyses involved aggregate mortality counts by state.
FIGURE 3-Rate of quarterly alcohol-related disease mortality per 100000 population aged
15 years and older: Alaska, 1976-2004 References
1. Midanik LT, Chaloupka FJ, Saitz R, et al. Alcohol-
attributable deaths and years of potential life lost-United
States, 2001. M111VR Morb Mortal Wly Rep.
evidence of such dissipation of effect Perhaps the with other efforts to prevent negative outcomes 2004;53:866-870.
sudden decline in drinking caused by increased related to alcohol consumption. Three meta- 2. Mokdad AB, Marks JS, Stroup DF, Gerberding JL.
prices established new normative and behavioral analyses of efforts to prevent individual- and Actual causes of death in the United States, 2000.JAMA.
patterns that then were maintained in the face of 2004;291:1238-1245.
school-level alcohol problems show effect sizes
a gradual elimination of the original price increase 3. National Institute on Alcohol Abuse and Alcohol-
ranging from d at -0.02 to d at -0.3 ,669 ism. I Oth Special Report to the US Congress on Alcohol and
that stimulated the reduction in consumption. meaning that alcohol taxes had an effect 2 to 4 Health. Washington, DC: US Dept of Health and Human
There is a need for additional study of the effects times larger than did other common prevention Services; 2000.
of sudden tax or price increases on drinking- efforts. The size of the alcohol-tax effect is even 4. Giertz JF, Excise taxes. Tax Policy Center Web site.
related normative expectations and behavior Available at: lhttp://www.taxpolicycenter.org/taxtopics/
more noteworthy given that state tax policy encyclopedia/Excise-Taxes.cfm Accessed July 7, 2008.
patterns. The reduction of the real tax rate in affects the entire population of a state, rather 5. Treating alcohol problems and state alcohol tax
Alaska also raises the plausible hypothesis that the than the relatively small numbers of individuals revenues. Ensuring Solutions to Alcohol Problems Web
substantial effects observed here would be sig- affected by most other prevention programs. In site. Available at: http://www.ensuringsolutions.org/
nificantly larger if such tax increases were main- resources/resources show.htm?doc id=339039.
addition, state alcohol taxation systems are al- Accessed July 7, 2008.
tWined in real dollars via indexing to inflation. ready in place, so there are virtually no additional 6. Tremper C, Mosher JF. Assessing State Readiness to
Our study limited its focus to an evaluation of implementation costs associated with the large Act on Alcohol Tax Research Findings.Felton, CA: Pacific
the effects of changing alcohol taxes on alcohol- benefit to public health to be obtained by in- Institute for Research and Evaluation; 2004.
related disease; we did not study mortality creases in alcohol taxes. m 7. Babor T, Caetano R, Casswell S, et al. Alcohol: No
caused by the many categories of unintentional Ordinary Commodity. New York, NY: Oxford University
Press; 2003.
or intentional injury that have substantial frac-
About the Authors 8. Chaloupka FJ, Grossman M, Saffer H- The effects of
tions attributable to alcohol (e.g., traffic crashes, At the time of the study, Alexander C. Wagenaar,Mildred price on alcohol consumption and alcohol related prob-
homicide, suicide). A replication of this research M. Maldonado-Molina,and Bradley H. Wagenaar were lems. Alcohol Res Health. 2002;26:22-34.
focused on injury morbidity and mortality is with the Department of Epidemiology and Health Policy
9. Salomaa J. Neither medium-strength beer nor price
Research, College of Medicine, University of Florida,
warranted. In addition, we limited our scope to explains the discrepancy in alcohol consumption between
Gainesville.
Finland and Sweden. Nordisk Alkoholtidskrift. 1993;10:
mortality changes in Alaska; replication of the Requests for reprintsshould be sent to Alexander C
330-346.
study for other states is also warranted. Wagenaar, College of Medicine, University of Florida,
1329 SW 16th St, Room 5130, Box 100177Z Gaines- 10. Adrian M, Ferguson BS, Her M. Can alcohol price
In conclusion, Alaska's alcohol tax increases ville, FL 32610-0177 (e-mail: wagenaar@gmail.com), policies be used to reduce drunk driving? Evidence from
resulted in large (ranging from 11% to 29%) This article was accepted Apnl 19, 2008. Canada. Subst Use Misuse. 2001;36:1923-1957.
reductions in deaths caused by alcohol-related Note. Findings and conclusions are solely the authors' 11. Chaloupka FJ, Laixuthai A. Do youths substitute
and do not necessarily representthe views of the University alcohol and marijuana? Some econometric evidence.
disease. The effect sizes are large compared of Horida. Eastern Econj 1997;23:253-276.
August 2009, Vol 99, No. 8 I American Journal of Public Health Wagenaar et al. I Peer Reviewed ý Research and Practice 1 1469
7. RESEARCH AND PRACTICE
12. Chaloupka FJ, Saffer H, Grossman M. Alcohol- 34. Markowitz S, Grossman M. Alcohol regulation and implications for prevention and policy. Addiction.
control policies and motor-vehide fatalities. J Legal Stud domestic violence towards children. Contemp Econ Pol. 2006;101:373-384.
1993;22:161-186. 1998;16:309-320. 53. English DR, Holman CDJ, Milne E, et al. The
13. Dee TS. State alcohol policies, teen drinking and 35. Markowitz S, Grossman M. The effects of beer taxes Quantificationof Drug-CausedMorbidity and Mortality in
traffic fatalities. J Public Econ. 1999;72:289-315. onphysical child abuse.jHealth Econ. 2000; 19:271-282. Australia 1995. Canberra, Australia: Commonwealth
Dept of Human Services and Health; 1995.
14. Evans WN, Neville D, Graham JD. General deter- 36. Yamasaki A, Chinami M, Suzuki M, Kaneko Y, Fujita
rence of drunk driving: evaluation of recent American D, Shirakawa T. Tobacco and alcohol tax relationships with 54. Shultz JM, Rice DP, Parker DL, Goodman RA, Stroh
suicide in Switzerland. Psychol Rep. 2005;97:213-216. G, Chalmers N. Quantifying the disease impact of alcohol
policies. Risk Anal. 1991, 11:279-289.
with ARDI software. Public Health Rep. 1991;106:443-
15. Mast BD, Benson BL, Rasmussen DW. Beer taxation 37. Henderson C, Liu XH, Roux AVD, Link BG, Hasin
450.
and alcohol-related traffic fatalities. Southern Econj D. The effects of US state income inequality and alcohol
policies on symptoms of depression and alcohol depen- 55. Intercensal estimates of the total resident population
1999;66:214-249.
dence. Soc Sci Med. 2004;58:565-575. of states: 1970 to 1980. Washington, DC: US Census
16. Mullahy j, Sindelar JL. Do drinkers know when to Bureau; 1995. Available at: http://www.census.gov/
say when? An empirical analysis of drunk driving. Econ 38. Skog 0, Melberg HO. Becker's rational addiction
popest/archives/1 980s/st708Ots.txt. Accessed July 7,
Inq. 1994;32:383-394. theory: an empirical test with price elasticties for distilled 2008.
spirits in Denmark, 1911-31. Addiction. 2006; 10l1
17. Rubin CJ. Economic conditions and alcohol prob- 56. Intercensal estimates of the total resident population
1444-1450.
lems. j Health Econ. 1995;14:583-603. of states: 1980 to 1990. Washington, DC: US Census
39. Cook PJ, Tauchen G. The effect of liquor taxes on
18. Ruhm CJ. Alcohol policies and highway vehicle Bureau; 1996. Available at: http://www.census.gov/
heavy drinking. Bell]Econ. 1982;13:379-390.
fatalities. J Health Econ. 1996;15:435-454. popest/rchives/1980s/st8090ts.txt AccessedJuly 7,2008.
40. Heien D, Pompells G. Stress, ethnic, and distribution
19. Saffer H. Alcohol Consumption and Tax Differentials 57. State population estimates: annual time series, July
factors in a dichotomous response model of alcohol 1, 1990 to July 1, 1999. Washington, DC: US Census
between Beer, Wine and Spirits. Cambridge, MA: National
abuse. J Stud Alcohol. 1987;48:450-455. Bureau; 1999. Available at: http://www.census.gov-
Bureau of Economic Research; 1989. Working paper 3200.
41. Rush B, Steinberg M, Brook R. Relationships popest/archives/1 990s/ST-99-03.txt. Accessed July 7,
20. Saffer H. Alcohol advertising and motor vehicle
among alcohol availability, alcohol consumption and 2008.
fatalities. Review Econ Stat 1997;79:431-442.
alcohol-related damage in the province of Ontario 58. Annual estimates of the population for the United
21. Saffer H, Grossman M. Beer taxes, the legal drinking and the state of Michigan. Adv Alcohol Subst Abuse. States and states, and for Puerto Rico: April 1, 2000 to
age, and youth motor vehicle fatalities.] Legal Stud 1986;5:33-45. July 1, 2004. Washington, DC: US Census Bureau; 2004.
1987;16:351-374.
42. Ponicki WR, Gruenewald PJ. The impact of alcohol Available at: http://www.census.gov/popest/states/
22. Saffer H, Grossman M. Drinking age laws and taxation on liver cirrhosis mortality. ] Stud Alcohol. tables/NST-EST2004-0l.pdf. Accessed July 7, 2008.
highway mortality rates: Cause and effect Econ Inq. 2006;67:934-938. 59. Box GEP, Jenkins G. Time Series Analysis: Fore-
1987;25:403-417.
43. Schweitzer SO, Intriligator MD, Salehi H. Alcohol- casting and Control. New York, NY: Holden-Day; 1976.
23. Smart RG, Mann RE. Treatment, Alcoholics Anon- ism: an econometric model of its causes, its effects, and its 60. Wei WWS. Time Series Analysis: Univariate and
ymous and alcohol controls during the decrease in alco- control. In: Grant M, Williams A, Plant M, eds. Economics MultivariateMethods. 2nd ed. Boston, MA: Pearson; 2006.
hol problems in Alberta: 1975-1993. Alcohol Alcohol. and Alcohol. London, England: Croom Helm;
1998;33:265-272. 1983:107-127. 61. McCleary R, Hay RA. Applied Time Series Analysis
for the Social Sciences. Beverly Hills, CA: Sage; 1980.
24. Young DJ, Bielinska-Kwapisz A. Alcohol prices, 44. Alaska Stat ,j60.010. Alcoholic Beverage Tax Act of
consumption, and traffic fatalities. Southern Econj 62. Cohen J. StatisticalPowerAnalysisfor the Behavioral
1983 and Alcoholic Beverage Tax Act of 2002.
2006;72:690-703. Sciences. 2nd ed. Hillsdale, NJ: Lawrence Erlbaum Asso-
45. Cook TD, Campbell DT. Quasi-Experimentation: dates; 1988.
25. Sloan FA, Reilly BA, Schenzler C. Effects of prices, Design and Analysis Issuesfor Field Settings. Boston, MA:
civil and criminal sanctions, and law enforcement on Houghton Mifflin; 1979. 63. Edwards G, Anderson P, Babor TF, et al. Alcohol
alcohol-related mortality.j Stud Alcohol. 1994;55:454- Policy and the Public Good. New York, NY: Oxford Uni-
46. Campbell DT, Stanley JC. Experimental and Quasi- versity Press; 1994.
465.
experimental Designs for Research. Chicago, IL: Rand
26. Whetten-Goldstein K, Sloan FA, Stout E, Liang L. 64. Viegi G, Maio S, Pistelli F, Baldacci S, Carrozzi L.
McNally; 1963.
Civil liability, criminal law, and other policies and Epidemiology of chronic obstructive pulmonary disease:
47. Alcohol beverage taxes: beer. Alcohol Policy Informa- health effects of air pollution. Respirology. 2006;11:
alcohol-related motor vehicle fatalities in the United States:
tion System Web site. Available at: http://www.alcoholpolicy. 523-532.
1984-1995. Accid Anal Prev. 2000;32:723-733.
niaaa.ni.gov/Tax-Beer. Accessed July 7, 2008.
27. Young D1, Likens TW. Alcohol regulation and auto 65. Pope CA Bates DV III, Raizenne ME. Health effects
48. Alcohol beverage taxes: wine. Alcohol Policy In- of particulate air pollution: time for reassessment? Envi-
fatalities. Int Rev Law Econ. 2000;20:107-126.
formation System Web site. Available at: http://www. ron Health Perspect. 1995;103:472-480.
28. Ohsfeldt RL, Morrisey MA. Beer taxes, workers alcoholpolicyniaaani,.gov/Tax-Wine. Accessed July 7,2008.
compensation, and industrial injury. Rev Econ Stat. 66. Annual average consumer price index, all items-
49. Alcohol beverage taxes: distilled spirits. Alcohol all urban consumers, 1960-present. Alaska Department
1997;1:155-160.
Policy Information System Web site. Available at: http:// of Labor & Workforce Development Web site. Avail-
29. Birckmayer J, Hemenway D. Minimum-age drinking www.alcoholpolicy.niaaa.nih.gov/Tax-Spirits. Accessed able at: http://almis.labor.state.ak.us/?PAGEID=67&
laws and youth suicide, 1970-1990. AmJ Public Health. July 7, 2008. SUBID=241. Accessed July 7, 2008.
1999;89:1365-1368.
50. National Bureau of Economic Research. Mortality 67. Carey KB, Scott-Sheldon LAJ, Carey MP, DeMartini
30. Grossman M, Markowitz S. Alcohol Regulation and data-vital statistics: NCHS's multiple cause of death data, KS. Individual-level interventions to reduce college stu-
Violence on College Campuses. Cambridge, MA: National 1959-2005. Available at: http://www.nber.org/data! dent drinking: a meta-analytic review. Addict Behav.
Bureau of Economic Research; 1999. Working paper multieausehtml. Accessed July 7, 2008. 2007;32:2469-2494.
7129.
51. InternationalClassification of Diseases and Related 68. Tobler NS, Roona MR, Ochshorn P, Marshall DG,
31. Markowitz S. The price of alcohol, wife abuse, and Health Problems, 1Oth Revision. Geneva, Switzerland: Streke AV, Stackpole KM. School-based adolescent drug
husband abuse. Southern Econj 2000;67:279-303. World Health Organization and German Institute of prevention programs: 1998 meta-analysis. J Prim Prev.
32. Markowitz S. Alcohol, drugs and violent crime. Int Medical Documentation and Information; 2007. 2000;20:275-336.
Rev Law Econ. 2005;25:20-44. Available at: http://www.who.int/classifications/apps/
69. Tobler NS, Stratton HH. Effectiveness of school-
icd/icdl 0online. Accessed September 4, 2008.
33. Markowitz S, Chatterji P, Kaestner R. Estimating the based drug prevention programs: a meta-analysis of the
impact of alcohol policies on youth suicides.jMent Health 52. Rehm J, Patra J, Popova S. Alcohol-attributable research. JPnrm Pree. 1997;18:71-128
Policy Econ. 2003;6:37-46. mortality and potential years of life lost in Canada 2001:
1470 1 Research and Practice I Peer Reviewed I Wagenaar et ai. American Journal of Public Health I August 2009, Vol 99, No. 8
8. COPYRIGHT INFORMATION
TITLE: Effects of Alcohol Tax Increases on Alcohol-Related
Disease Mortality in Alaska: Time-Series Analyses From
1976 to 2004
SOURCE: Am J Public Health 99 no8 Ag 2009
The magazine publisher is the copyright holder of this article and it
is reproduced with permission. Further reproduction of this article in
violation of the copyright is prohibited. To contact the publisher:
http://www.apha.org/
![RESEARCH AND PRACTICE
Experimental 01 0, 0 X] 0 0,0
(Alaska) -, . .... 0" 1 ... "
Comparison 0,, 0,: 0,1 ... ... ......... ... ... .. .0
(other states)
Note. Otrepresents an observation at a given time t, with each t being one quarter of a calendar year. The first observation took place at time tj, the first quarter of 1976, and the series
ended at t116,the last quarter of 2004. X,represents an increase inalcohol tax inAugust 1983, when the excise tax on beer increased from $0.25 to $0.35 per gallon, the tax on wine increased
from $0.25 to $0.35 per gallon, and the tax on distilled spirits increased from $4.00 to $5.50 per gallon. 44 X represents a subsequent increase in alcohol tax in October 2002, when the
2
tax on beer increased to $1.07 per gallon. the tax on wine increased to $2.50 per gallon, and the tax on spirits increased to $12.80 per gallon. 44 m represents the number of quarterly observations
before the first tax increase (m=30). n represents the number of quarterly observations after the first tax increase and before the second tax increase (n=77). These 2 sets of observations
are summed with 9 follow-up quarterly observations after the second tax increase, producing a total of 116 observations.
FIGURE 1-Representation of study design.
affect observed alcohol-related mortality States. We obtained the complete annual data addition to analyses of mortality frequency
over time. set containing 1 record on each deceased per- counts, we also used annual estimates of popu-
We further strengthened the study's design son for each year from 1976 through 2004 lation from the US Census Bureau to calculate
by examining 2 separate increases in tax rates from the National Bureau of Economic Re- death rates per 100 000 population aged 15
occurring almost 20 years apart. This element search.5" From these data we created quarterly years and older.' 5-5
of the study allowed us to test the replicability coimts of deaths stratified by underlying cause of
of observed effects, and it ensured that ob- death, first for Alaska and then for the other Statistical Analyses
served effects were not caused by unique states as a group. Given the large number of repeated obser-
circumstances not generalizable overtime, thus We cumulated counts by cause of death into vations, we used an approach that combined a
ruling out the "contemporaneous history" 3 outcome variables. (1) Alcohol-caused mor- Box-Jenkins autoregressive integrated moving
threat to internal validity first articulated by tality, which represents all deaths caused by average (ARIMA) model with structural pa-
Campbell and Stanley.41 Moreover, a simulta-
' diseases for which the alcohol-attributable rameters, 59,6
neous evaluation of the effects of the 2 tax fraction is 1.0 (e.g., alcoholic liver disease,
increases allowed us to perform a long-tern alcohol-induced chronic pancreatitis, alcohol (1) (1 -B 4
) yt =o+o(1 +o,)212t
11, +fiZ,
follow-up evaluation of the earlier tax increase. psychoses, alcohol abuse, alcohol dependence +i/jiX+(f - OB4)u1,
syndrome, alcoholic polyneuropathy, alcoholic
Data Collection cardiomyopathy, alcoholic gastritis, and acute where Y,=I to Yj - are the 3 outcome measures
Data on alcohol tax rates in Alaska were alcohol poisoning). (2) Alcohol-related mortal- by quarter from t= (first quarter 1976) through
collected from a number of sources. The Al- ity, which represents all deaths caused by t=116 (last quarter 2004); a is a constant; ol is
cohol Policy Information System provides diseases with alcohol-attributable fractions the estimated effect of implementation of the
summaries of US state and federal tax rates for 0.35 and higher but less than 1.0 (i.e., other 1983 alcohol tax increase; Iluis a step function
multiple classes of alcoholic beverages, details cirrhosis; cholelithiasis; acute and chronic equal to 0 before the 1983 tax change took effect
on changes in rates, full legal citations, and text pancreatitis; malignant neoplasms of the and 1 after the change; no is the estimated effect
2
from the relevant codified statutes, starting mouth, pharynx, esophagus, liver, and breast; of implementation of the 2002 alcohol tax
with calendar year 2003 .47-'9 Data for the epilepsy; and cardiovascular diseases including increase; 12t is a step function equal to 0 before
period prior to 2003 were collected by experi- hypertension, ischemia, arrhythrnia, cerebro- the 2002 tax change took effect and 1 after the
enced research attorneys who used standard vascular disease, and ischemic and hemor- change; [3 is the estimated effect of Z, the
legal research methods to search the records of rhagic stroke). (3) The third variable is the sum frequency (or rate) of alcohol-related disease in
codified statutes in Westlaw databases (http:// of the first 2 variables. Alcohol-attributable the comparison states; 4, is a vector of estinates
www.westlaw.com, fee-based membership) when fractions for diseases, categorized by Interna- that controls for outliers X,; E)is the first-order
available, and who searched law library hard- tional Classification of Diseases (ICD)5"code, are seasonal moving average parameter; ut is a
copy materials for earlier years. based on RehIm et al.,52 English et al,53 and random (white noise) error component; and B is
Data on alcohol-related mortality outcomes Shultz et al., 54 which in turn were based on the backshift operator such that B4 (yd equals
were based on death-ceitificate data recorded comprehensive reviews and meta-analyses of the YI-4. We used SAS version 9.1 Proc ARIMA
by the National Vital Statistics System of the literature (for the ICD codes used, see the table (SAS Institute Inc, Cary, NC) to estimate all
National Center for Health Statistics. which available as a supplement to the online version of models, and we used a strict significance crite-
includes all deaths occurTing Mithmn the United the article at http://Nw,ww.ajph.oi-g). Finally, in nion of Pat less than .001 to evaluate all models
August 2009, Vol 99, No. 8 1 American Journal of Public Health Wagenaar et aLi. Peer Reviewed I Research and Practice I 1465](data:image/gif;base64,R0lGODlhAQABAIAAAAAAAP///yH5BAEAAAAALAAAAAABAAEAAAIBRAA7)