3. Urban areas depend on the productive
and assimilative capacities of
ecosystems far beyond their formal
boundaries, i.e., land tens to hundreds
of times larger than the area cities
physically occupy are required to
produce the energy, material goods,
and nonmaterial services (including
waste absorption) that sustain cities.
4. Intense urban population growth has occurred over the past
century. Urban areas occupy a small area (< 3% of land) yet
their impact is large, with ~80% of global C emissions, ~80%
of global wood use and ~60% of global residential water use
occurring in cities.
(Grimm et al., 2008)
Land use change directly associated with building cities as well
as supporting the demands of urban populations drives many
types of environmental change.
5. Some people have lived in cities for a long time
but most people have NOT lived in cities.
Do you recognize any of these famous ancient cities?
Ayutthaya (Thailand)Machu Pichu (Peru)
Anthens (Greece) Cahokia (USA)
6. In 1800, only 3 percent of the global population lived in
cities and only 1 city had more than 1 million people.
http://worldkit.org/population/
8. In 1950, 30 percent of the world's population lived in
cities and the number of cities with over 1 million
people had grown to 83.
http://worldkit.org/population/
9. In ~2008, for the first time ever, more people lived in
cities than in rural areas and there were more than 400
cities with over 1 million people!
10. (Grimm et al., 2008)
Global & US trends in urban and rural populations
14. WHICH ARE THE LARGEST? WHY PUBLISHED POPULATIONS
FOR MAJOR WORLD URBAN AREAS VARY SO GREATLY
RL Forstall, RP Greene and JB Pick
Abstract:
Lists of the world’s largest urban areas according to
population size are surprisingly inconsistent in standard
reference sources. They even disagree about which city is the
world’s largest. In this paper we first review the differences
found in the population reporting of the twenty largest world
urban areas by several unofficial sources and by the United
Nations. We then demonstrate that variations in the
populations and rankings stem primarily from differences in
concepts and definitions, not from bad census counts or lack
of basic information about the individual urban areas.
http://www.uic.edu/cuppa/cityfutures/papers/webpapers/cityfuturespapers/session3_4/3_4whicharethe.pdf
15. metropolitan area = a large urban nucleus
together with adjacent areas with a high degree of
economic and social integration
city proper = an incorporated administrative district
with specific boundaries beyond which urban
development has often far overflowed
3 terms used to define urban areas
urban agglomeration = a central city (or cities)
surrounded by continuous urban areas
18. Seattle
3) Chicago metro area
9.4 million 4) Philadelphia
metro area
5.8 million
1) NY City
metro area
18.7 million
5) Dallas-Fort
Worth metro area
5.8 million
2) LA metro
area 12.9
million Honolulu
Puerto
Rico
but only 8 % lived in metro areas
with populations > 1 million.
0 100 10,000
people per sq. mile
http://i.bnet.com/blogs/usa-population-time-2006-joe-lertola-edit.jpg
In 2010, 81 % of Americans lived in cities…
19. Today, ~75 % of the people in
industrialized countries live in urban areas
and ~45% of the people in developing
countries live in urban areas.
It is expected that world population will
be 70 percent urban by 2050!
http://www.prb.org/Educators/TeachersGuides/HumanPopulation/Urbanization.aspx
20. More than 95% of the net increase in the global
population during the 21st century is projected to occur
in cities in developing countries
http://maps.grida.no/go/graphic/urban_population_status_and_trends
21. Almost 40 percent of city dwellers in developing
countries (~ 1 billion people) live in slums
23. If *ALL* the people on planet Earth lived at the density of one city,
how large would that city be?http://marcgawley.com/
24.
25. http://www.nomadicminds.org/blogs/2010/06
Pollen analysis has now established that Easter Island
was almost totally forested until 1200 CE. The tree
pollen disappeared from the record by 1650, and the
statues stopped being made around that time
Almost 900 of these giant stone sculptures were carved
and transported - some weighing over 80 tons
30. Recently, however, ecologists have begun collaborating
with other scientists, planners, and engineers to
understand and even redesign urban ecosystems.
(Grimm et al., 2008)
During the 20th century, most ecologists ignored urban
areas with the result that ecological knowledge contributed
little to solving urban environmental problems.
32. As Phoenix urbanized, native Sonoran desert ecosystems
were replaced by an “urban oasis” with both lush, watered
lawns and managed desert-like landscapes.
Scientists are investigating the household decision-making,
perceptions, and priorities that result in
more ecological vs. less ecological residential landscapes.
Which house/landscape would you choose?
33. Throughout history, most cities have sprung up along rivers,
and other water bodies because of the opportunities
created by the available water.
Within cities, water provides invaluable services (e.g., residential
use, industrial use, transportation, sanitation and recreation but
is also linked to serious challenges (flooding, tsunamis,
subsidence, mosquito vectored disease).
The highly modified streams, rivers, flood channels, canals and other
hydrosystems in urban areas provide few of the ecosystem services
associated with natural aquatic systems (e.g., filtering, flood control,
temperature moderation, habitat…)
34. Low flow events also contribute to water pollution
when automotive chemicals, pet wastes, lawn care
chemicals, persistent organic pollutants (e.g.,
flame retardants) wash off urban surfaces
Stormwater is conveyed separately from sewage in cities
with relatively new infrastructure but older European and
American cities have combined sewer and stormwater
systems resulting in serious pollution events every time
large rainfall events occur
35. How carefully do home
owners apply fertilizers
and pesticides?
Dr. Bernards would
be proud of how
carefully I calibrated
this spreader!
37. Residential lawns occupy > 20 million acres in the US.
US lawn care industry annual revenue exceeds $40 billion.
> $ 5 billion is spent on fertilizer for U.S. lawns.
A typical power lawnmower pollutes as much in one hour as driving
an automobile for 20 miles.
~60 thousand severe accidents result from lawnmower use in the US
each year, as well as significant damage to human hearing.
~ 70 million pounds of pesticides are applied to lawns each year
Some stats to consider
38. Benefits of Turfgrass
• Erosion Control
• Infiltration of water
• Carbon sequestration
• Noise reduction
• Cooling
• Oxygen production
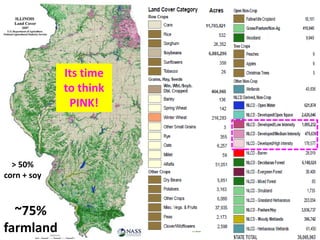
49. Scenic beauty
Reduced mowing costs
Wildlife/pollinator habitat
Increased alertness of drivers
Roadside plantings of
prairie vegetation
have many benefits!
50. INTRODUCTION
The Illinois Department of Transportation (IDOT) has been interested in mapping
roadside prairie since 1992. A formal request was made in 1998 by Rich Nowack to
map prairie while traveling to other IDOT project areas, and as time allowed.
IDOT’s justification for this project was to preserve prairie habitat, and limit
accidental mowing and herbicide spraying of native prairie remnants.
In 2000, IDOT made this project a priority. In the 2001 field season, a more detailed
and systematic approach was taken to survey prairies in Illinois. This report and
final GIS map is the result of the information gathered during the 2003 field season
in IDOT District 4.
Inventory of Roadside Prairies
Illinois Department of Transportation
District 4
Illinois Natural History Survey
Center for Biodiversity
Technical Report (4) 2004
51. Large cities are the most
complex systems that
humanity has ever created
and represent both incredible
efficiencies and failures
LA’s Pregerson
Interchange contains 5
levels and 9 miles of
cloverleaf loops.
52. The CDC reports that more
than 500,000 American
children have significant
levels of lead in their bodies
18 cities in Pennsylvania and
11 in New Jersey may have
an even higher share of
children with dangerously
elevated levels of lead than
does Flint, MI.
55. The health department provided the city with 149 Galesburg
addresses where the worst cases of lead occurred from 1992
to 2015. The city cross-indexed those addresses with its own
database of Galesburg homes to determine that only 60 of
those 149 homes had private lead water service lines.
This evidence, along with what the health department’s
inspectors found in homes, pointed to lead paint fragments
and dust in homes as a larger contributor to the problem than
lead water service lines.
56. Poor planning and governance = many problems
Crime
Congestion
Air pollution
Water pollution
Poverty
Corruption
Inequity
61. Are large farms more efficient than small farms?
Match between
management
opportunities and
management skill is
what matters most
62. University of Minnesota data from 2016 showed the top 20% of farmers had
an average net farm income of $197,000, while the bottom 20% had an
average loss of $61,000.
Drilling through the numbers, Robert Craven from the Center for Farm
Financial Management at the University of Minnesota said the difference
between the top 20% and bottom 20% of producers was not so much yield or
cash price or even owned versus rented acres. The big difference came in
expenses and hedging gains.
Seed, fertilizer, chemicals and rent expenses for corn production in southern
Minnesota differed from an average of $665 per acre for the top 20%
producers to $863 per acre for the bottom 20% group -- a difference of
about $200 per acre… and hedging gains in 2016 were $15,207 for the top
group versus a loss of $7,176 for the bottom group.
“It wasn't just the big guys making money," noted Craven. "When we looked at
number of acres farmed, there wasn't much difference between the 1,000- to
1,500-acre producer and the 2,000- to 5,000-acre farmer in terms of net return.
Farm size did not determine profitability. Cutting expenses and better
marketing was a much bigger factor" Craven reported.
63. Elephants weigh
~10,000 times more
than guinea pigs
but only consume
~ 1000 times as
many calories
WHY?
Slow metabolism
High
metabolism
65. A key concept within the discipline of urban ecology is
urban metabolism which compares the flows of
energy and materials in and out of cities and the
transformation and accumulation of energy and
materials within cities to biological metabolism.
Some scientists debate the appropriateness of the
metabolism analogy but interest in urban metabolism
has led to informative analysis of long-term trends in
the flow of energy, paper, plastics, metals and
food stuffs in, out and within cities.
What is urban metabolism?
69. After studying Australian ant colonies, mathematicians think ants
might have something to teach us about network design, and how
we evaluate priorities in the placement of schools, post offices and
power plants, and the expansion of transportation systems. Models
of ant colony growth, they believe, can be used to improve the
design of human systems.
70. Many factors influence the metabolism of cities
Sprawled, low-density cities have higher per capita
transportation energy requirements than compact cities.
Cities with interior continental climates expend more energy
on winter heating and summer cooling than those with more
temperate climates. Application of technology, appropriate
use of vegetation and the costs of energy influence energy
consumption.
Public policies (e.g., building codes and recycling programs)
and social attitudes impact material and energy flows.
Lastly, the age of a city, the design of its infrastructure, and its
stage of industrial development impact its urban metabolism.
73. The City Solution
Why cities are the best cure for our planet's growing pains
December 2011
74. Large cities are concentrations of human
ingenuity and generally require far fewer
resources on a per capita basis than small
towns or rural areas.
75.
76. “Possibly the most exciting book on ecology or environmentalism
to be published in years, David Owen's Green Metropolis: Why
Living Smaller, Living Closer, and Driving Less Are the Keys to
Sustainability challenges the conventional wisdom of the
environmental movement and uses New York City (not Portland or
rural Vermont) as a model of true sustainability.
Owen's seemingly counter-intuitive argument is supported by the
data: New Yorkers have the lowest per capita energy consumption
and smallest per capita carbon footprint of anyone in the United
States. The key to this isn't that New Yorkers are morally superior
or ideologically predisposed to environmentalism, but simply the
structure of the city: “Manhattan's density is approximately
67,000 people per square mile, or more than eight hundred times
that of the nation as a whole and roughly thirty times that of Los
Angeles.”
http://nefac.net/greenmetro
77. Perhaps most important, people in dense cities
drive less. Their destinations are close enough to
walk to, and enough people are going to the
same places to make public transit practical.
City dwellers tread more lightly in many ways,
David Owen explains in Green Metropolis. Their
roads, sewers, and power lines are shorter and so
use fewer resources. Their apartments take less
energy to heat, cool, and light than do houses.
78. New Delhi car ban yields trove of pollution data
Scramble by researchers to monitor driving restrictions in Indian capital pays off.
New Delhi, India may be the
world’s most polluted city, but
it’s making an effort to
relinquish that title. With
pollution from particulate
matter at potentially lethal
levels early last December,
city officials took a drastic
step: they announced that
they would temporarily
restrict the use of private
vehicles by allowing owners
to drive only on alternate
days, based on the their
number plates #s.
The initial results of that 15-day trial, which began on 1 January, are now in.
Although traffic actually increased in the first week of the ban, the levels of PM2.5 —
particulate matter measuring less than 2.5 microns across — fell by roughly 10%. That is a
victory not just for New Delhi officials, but also for the scientists who sprang into action to
collect the data necessary to determine whether the test had achieved its goal.
79. In December 2015, daily levels of noxious PM2.5 in
New Dehli ranged from 400–600 µg/m3 – much higher
than the Indian legal standard of 60 µg/m3 (which itself
is more than double the 25 µg/m3 target threshold set
by the World Health Organization).
Scientists predict that PM2.5 particles cause more than
600,000 premature deaths annually in India
How serious is air pollution in New Dehli?
80. The high cost of suburban living is heavily subsidized by the
rest of the population in the form of public funds spent on
road construction, extension of utility lines, school buses and
emergency services for new developments.
If the true cost of sprawl were borne by developers and
suburban home-buyers, in the form of increased housing
prices, higher property taxes and infrastructure recovery
costs (e.g., higher utility bills and tolls on roads primarily
used by commuters) suburbs would be much more expensive
places to live.
81. 1.7 million people
3.6 million people
2.9 million people100 people
??? million people
What do
you know
about
Chicago?
82. In the late 19th century, Chicago was a
commercial colossus, a city growing more quickly
than New York, flooded with industrial money
but ravaged by great income disparities, lax
health standards, and labor upheavals.
For Chicago to become the city it could be, civic
leaders recognized the need for urban planning,
both to solve Chicago's existing problems and to
prepare it for a prosperous future. The result was
architect Daniel Burnham's 1909 plan for Chicago,
a model of urban planning, aesthetic
sophistication, and technical achievement.
83.
84. Congress Parkway
Arterial street widening
Civic Center
Chicago River straightening
Roosevelt Road
Grant Park
Northerly Island
New diagonal avenues
Consolidated railroad stations
Two-level riverfront drives
Make no little plans.
They have no magic to stir
men’s blood and probably
themselves will not be
realized. Make big plans; aim
high in hope and work,
remembering that a noble,
logical diagram once
recorded will never die.
D. Burnham
89. The Thornton Reservoir is the
final stage of the TARP tunnel
project's Calumet branch.
When the former limestone
quarry fills, it will add 7.9
billion more gallons of
capacity to Chicago’s
stormwater runoff system.
91. “If you look around at major cities in the
country, Chicago had so much foresight –
and as a result is spending far less, and
benefiting so much more than other
cities,” says David St. Pierre, executive
director of the Metropolitan Water
Reclamation District in regard to efforts to
keep storms from flooding cities.
92. improving stormwater management by
reducing runoff and improving water quality
reducing heating and cooling costs
increasing longevity of roofing membranes
reducing noise and air pollution
increasing urban biodiversity
providing space for urban agriculture
providing a more aesthetically pleasing and healthy
environment to work and live
97. LEED, or Leadership in Energy & Environmental Design,
is a green building certification program that recognizes
best-in-class building strategies and practices. To receive
LEED certification, building projects satisfy prerequisites
and earn points to achieve different levels of certification.
98. LEED v4 is
bolder, more
specialized, and
designed for an
improved user
experience.
There are 4 levels of certification
103. If what you
value most is nature,
cities look like concentrated
piles of damage—until you consider
the alternative, which is
spreading the
damage.
http://www.airphotona.com/image.asp?imageid=15204
104. Cities allow more than
half of humanity
to live on <3% of the
earth’s arable land, leaving
more space for nature.
http://media.treehugger.com/assets/images/2012/03/bishan-park-singapore-aerial-vew.jpg.492x0_q85_crop-smart.jpg
105. Positive human experiences with non-native, global
“homogenizers”, such as pigeons, may be essential for
convincing urbanites of the importance of conserving
global biodiversity.
With an ever-increasing fraction of humans living in cities,
encounters with urban nature have supplanted experiences
with natural biodiversity for many people.
106. Most Americans don’t like cities.
In an annual Gallup poll, from
1966 to the present day, the
number of Americans who have
reported a preference for city
living has never been higher than
20 percent. (The other options
Gallup provides are small town,
farm or suburb.)
Steven Conn’s new book,
Americans Against the City: Anti-
Urbanism in the Twentieth
Century analyzes the causes and
effects of Americans’ anti-city
sentiment.
Despite all their benefits