SlideShare ist ein Scribd-Unternehmen logo
1 von 86
Annual Report to the Nation on the Status of Cancer,
Part I: National Cancer Statistics
Kathleen A. Cronin, PhD, MPH1; Andrew J. Lake, BS2; Susan
Scott, MPH 1; Recinda L. Sherman, MPH, PhD, CTR3;
Anne-Michelle Noone, MS1; Nadia Howlader, MS, PhD1; S.
Jane Henley, MSPH4; Robert N. Anderson, PhD5;
Albert U. Firth, BS2; Jiemin Ma, PhD, MHS6; Betsy A. Kohler,
MPH, CTR3; and Ahmedin Jemal, DVM, PhD 6
BACKGROUND: The American Cancer Society (ACS), the
Centers for Disease Control and Prevention (CDC), the National
Cancer
Institute (NCI), and the North American Association of Central
Cancer Registries (NAACCR) collaborate to provide annual
updates
on cancer occurrence and trends in the United States.
METHODS: Incidence data were obtained from the CDC-funded
and NCI-
funded population-based cancer registry programs and compiled
by NAACCR. Data on cancer deaths were obtained from the
National Center for Health Statistics National Vital Statistics
System. Trends in age-standardized incidence and death rates
for all can-
cers combined and for the leading cancer types by sex, race, and
ethnicity were estimated by joinpoint analysis and expressed as
the
annual percent change. Stage distribution and 5-year survival by
stage at diagnosis were calculated for breast cancer, colon and
rec-
tum (colorectal) cancer, lung and bronchus cancer, and
melanoma of the skin. RESULTS: Overall cancer incidence
rates from 2008 to
2014 decreased by 2.2% per year among men but were stable
among women. Overall cancer death rates from 1999 to 2015
decreased by 1.8% per year among men and by 1.4% per year
among women. Among men, incidence rates during the most
recent 5-
year period (2010-2014) decreased for 7 of the 17 most common
cancer types, and death rates (2011-2015) decreased for 11 of
the 18
most common types. Among women, incidence rates declined
for 7 of the 18 most common cancers, and death rates declined
for 14
of the 20 most common cancers. Death rates decreased for
cancer sites, including lung and bronchus (men and women),
colorectal
(men and women), female breast, and prostate. Death rates
increased for cancers of the liver (men and women); pancreas
(men and
women); brain and other nervous system (men and women); oral
cavity and pharynx (men only); soft tissue, including heart (men
only); nonmelanoma skin (men only); and uterus. Incidence and
death rates were higher among men than among women for all
racial
and ethnic groups. For all cancer sites combined, black men and
white women had the highest incidence rates compared with
other
racial groups, and black men and black women had the highest
death rates compared with other racial groups. Non-Hispanic
men
and women had higher incidence and mortality rates than those
of Hispanic ethnicity. Five-year survival for cases diagnosed
from
2007 through 2013 ranged from 100% (stage I) to 26.5% (stage
IV) for female breast cancer, from 88.1% (stage I) to 12.6%
(stage IV)
for colorectal cancer, from 55.1% (stage I) to 4.2% (stage IV)
for lung and bronchus cancer, and from 99.5% (stage I) to 16%
(stage IV)
for melanoma of the skin. Among children, overall cancer
incidence rates increased by 0.8% per year from 2010 to 2014,
and overall
cancer death rates decreased by 1.5% per year from 2011 to
2015. CONCLUSIONS: For all cancer sites combined, cancer
incidence
rates decreased among men but were stable among women.
Overall, there continue to be significant declines in cancer
death rates
among both men and women. Differences in rates and trends by
race and ethnic group remain. Progress in reducing cancer
mortality
has not occurred for all sites. Examining stage distribution and
5-year survival by stage highlights the potential benefits
associated
with early detection and treatment. Cancer 2018;124:2785-800.
VC 2018 The Authors. Cancer published by Wiley Periodicals,
Inc. on
behalf of American Cancer Society. This is an open access
article under the terms of the Creative Commons Attribution-
NonCommercial
License, which permits use, distribution and reproduction in any
medium, provided the original work is properly cited and is not
used
for commercial purposes.
KEYWORDS: Annual Report to the Nation, cancer, incidence,
mortality, National Program of Cancer Registries (NPCR),
National Vital
Statistics System (NVSS), North American Association of
Central Cancer Registries (NAACCR), Surveillance,
Epidemiology, and End
Results (SEER), survival, trends.
Corresponding author: Kathleen A. Cronin, PhD, MPH, Division
of Cancer Control and Population Sciences, National Cancer
Institute, 9609 Medical Center Drive,
Room 4E454, Bethesda, MD 20892-9765; [email protected]
1
Division of Cancer Control and Population Sciences, National
Cancer Institute, Bethesda, Maryland;
2
Information Management Services, Inc., Rockville, Maryland;
3
North American Association of Central Cancer Registries,
Springfield, Illinois;
4
Division of Cancer Prevention and Control, National Center for
Chronic Disease Pre-
vention and Health Promotion, Centers for Disease Control and
Prevention, Atlanta, Georgia; 5National Center for Health
Statistics, Centers for Disease Control
and Prevention, Hyattsville, Maryland;
6
Surveillance and Health Services Research, American Cancer
Society, Atlanta, Georgia
See companion article on pages 2801-14, this issue.
This article has been contributed to by US Government
employees, and their work is in the public domain in the United
States.
We gratefully acknowledge the contributions of the state and
regional cancer registry staff for their work in collecting the
data used in this report. In addition,
we thank Daniel Miller, Joe Zou, and Steve Scoppa of
Information Management Services, Inc., for assistance in
compiling the data used in this report. We thank
Alyssa Wang, MPH, for assistance with preparation of the
graphics and Trish Murphy, MS, for editorial assistance.
The findings and conclusions in this article are those of the
authors and do not necessarily represent the official positions of
the author’s agencies (the Centers
for Disease Control and Prevention, the National Cancer
Institute, the American Cancer Society, or the North American
Association of Central Cancer Registries).
DOI: 10.1002/cncr.31551, Received: March 22, 2018; Revised:
April 23, 2018; Accepted: April 26, 2018, Published online May
22, 2018 in Wiley Online Library
(wileyonlinelibrary.com)
Cancer July 1, 2018 2785
Original Article
http://orcid.org/0000-0001-5881-8313
http://orcid.org/0000-0002-0000-4111
http://crossmark.crossref.org/dialog/?doi=10.1002%2Fcncr.3155
1&domain=pdf&date_stamp=2018-05-22
INTRODUCTION
The American Cancer Society (ACS), Centers for Disease
Control and Prevention (CDC), National Cancer Insti-
tute (NCI), and North American Association of Central
Cancer Registries (NAACCR) have collaborated annually
since 1998 to provide updates on cancer incidence and
mortality patterns in the United States.1-19 This report
uses a single database to estimate delay-adjusted incidence
to monitor population-based cancer trends. In addition to
reporting on incidence and mortality trends overall and
for common cancer sites, this year’s report highlights 4
cancer sites (female breast, colon and rectum [colorectal],
lung and bronchus, and melanoma of the skin) by pre-
senting the percentage of cases by stage at diagnosis and 5-
year survival estimates by stage at diagnosis.
MATERIALS AND METHODS
Data Sources
Cancer incidence data
Population-based cancer incidence data by age, sex, and
race/ethnicity were obtained from 42 state registries that
participate in the CDC’s National Program of Cancer
Registries (NPCR) and/or the NCI’s Surveillance, Epi-
demiology, and End Results (SEER) Program. The data
satisfied the NAACCR’s data quality criteria and repre-
sented cases diagnosed from 1999 through 2014,20 cover-
ing 89% of the US population. Information on incident
cases came primarily from the abstracts of inpatient and
outpatient medical records but also from a variety of other
sources, including pathology reports and death certifi-
cates. This database of 42 registries was used to derive all
incidence statistics presented in this report.
Anatomic site and histology were coded according
to the International Classification of Diseases for Oncol-
ogy (ICD-O) edition in use at the time of diagnosis and
were converted to the third edition (ICD-O-3) coding21
and categorized according to SEER site groups.22 Only
cases defined as malignant under ICD-O-2 and ICD-O-3
were included in this report, with the exception of bladder
cancer. In situ and malignant cancers were combined
when reporting bladder cancer incidence rates. All case
counts and rates were adjusted for delay in reporting.23
After adjusting for reporting delay, the 5-year fixed inter-
val incidence rates are based on 3.6 million male cases and
3.5 million female cases diagnosed between 2010 and
2014.
Cancer mortality data
Although cancer incidence data were available through
2014, an additional year of data was available for analysis
of mortality. Cause of death by age, sex, and race/ethnicity
(1999-2015) came from the National Vital Statistics Sys-
tem and was based on death certificate information
reported to state vital statistics offices and compiled into a
national file covering all states in the United States by the
National Center for Health Statistics (NCHS).24 Catego-
rization methods for cause of death have been described in
previous reports.19
Race/ethnicity data
In this report, information on race and ethnicity was
based on medical records for incidence or death certifi-
cates from the NCHS for mortality. Race was categorized
as white, black, Asian/Pacific Islander (API), and Ameri-
can Indian/Alaska Native (AI/AN). Race information for
AI/AN, however, was considered reliable only for geo-
graphic areas covered by the Indian Health Service Con-
tract Health Service Delivery Areas (CHSDA)10,25,26;
therefore, incidence and mortality data for AI/AN were
based only on these areas. Overall, 83% of the AI/AN
population lived in CHSDA areas between the years 2010
and 2014. This percentage varied by geographic area,
with 100% or close to 100% of the AI/AN population liv-
ing in CHSDA areas in Alaska, the Pacific Coast, the
Southern Plains, and the East; 67% living in the Northern
Plains; and 60% living in the Southwest. Hispanic ethnic-
ity included individuals from all races identified as His-
panic. Although the accuracy of race and ethnicity
reporting has improved over time, recent studies have
demonstrated that reporting of race in medical records
remains less accurate for API, Hispanic, and AIs/ANs
than for whites and blacks.27,28 We present incidence and
mortality data separately by race and by Hispanic ethnic-
ity. The number of cases included in the 5-year incidence
rate calculation ranged from 12,000 male and 13,500
female AIs/ANs residing in CHSDA areas to almost 3
million white men and women.
Population data
The population estimates used as the denominators to cal-
culate incidence and death rates were a modification of
the intercensal and Vintage 2015 annual times series of
July 1, county population estimates by age, sex, race, and
Hispanic origin produced by the US Census Bureau’s
Population Estimates Program in collaboration with the
NCHS and with support from the NCI.29 The estimates
incorporate intercensal (for July 1, 2000-2009) and Vin-
tage 2015 (for July 1, 2010-2015) bridged, single-race
estimates that are derived from the original multiple-race
categories in the 2000 and 2010 Censuses, as specified in
Original Article
2786 Cancer July 1, 2018
the 1997 Office of Management and Budget standards for
the collection of data on race and ethnicity.30,31 Some
additional adjustments were made to refine the July 1
population estimates, as with previous reports.19
Survival data
Estimates for 5-year relative survival were calculated for
cases diagnosed from 2007 through 2013. We used 34
central cancer registries (33 states and 1 metropolitan
area, referenced hereafter as states) compiled by the
NAACCR (covering 70% of the US population) to
examine survival differences by sex and cancer stage at
diagnosis for cancers of the lung and bronchus, breast,
colon and rectum, and melanoma of the skin.32 These
34 states were considered to have sufficient vital status
follow-up to conduct survival analyses, because they
either conducted recent National Death Index linkages
or they routinely conduct active vital status follow-up of
all cases.33 Cancers that were identified by death certifi-
cate or autopsy only were excluded from the survival
analysis, as were patients who died so soon after diagno-
sis that their survival time was not measurable. The first
site-specific cancer of the analysis period (2007-2013)
was used in the analysis. Patients were followed for vital
status through December 31, 2013, because not all regis-
tries had complete information on vital status through
December 31, 2014.
Statistical Methods
Cancer incidence and death rates and trends
Cross-sectional incidence (2010-2014) and death (2011-
2015) rates for all ages combined were calculated for all
cancer sites combined and for the most common cancer
sites by sex, race, and ethnicity. These rates were calcu-
lated with their 95% confidence intervals using SEER*-
Stat software, version 8.3.4.34,35 Incidence rates were
adjusted for delay in reporting.36 Similarly, we calculated
overall cancer incidence and death rates for children (ages
0-14 years). All rates were age-standardized to the 2000
US standard population and were expressed per 100,000
persons.34 Rates based on fewer than 16 cases were
deemed to be statistically unstable and were suppressed.
Temporal trends in age-standardized, delay-adjusted
cancer incidence (1999-2014) and death (1999-2015)
rates were estimated using joinpoint regression,37,38 with
a maximum of 2 joinpoints (3 line segments) allowed in
each model for incidence and 3 joinpoints (4 line seg-
ments) allowed in each model for mortality. The maxi-
mum number of joinpoints is based on the number of
data points in the series.39 The resultant trends were
described by the annual percent change (APC). The 5-
year average APCs (AAPCs) for 2010 through 2014 (inci-
dence) and for 2011 through 2015 (mortality) were calcu-
lated using a weighted average of the slope coefficients of
the underlying joinpoint regression line, with the weights
equal to the length of each segment over the interval. The
AAPC was equal to the APC when the AAPC was entirely
within the last joinpoint segment.40 Two-sided statistical
significance (P < .05) for the APC and the AAPC was
determined using a t test for the APC and for the AAPC
when it lay entirely within the last joinpoint segment; and
a Z test was used when the AAPC extended beyond the
last joinpoint segment.39
In describing trends, the terms increase and decrease
are used when the slope of the trend (APC or AAPC) was
statistically significant; otherwise, the term stable is used.
Trends based on fewer than 10 cases in any of the data
years (1999-2014 for incidence and 1999-2015 for mor-
tality) were considered statistically unstable and were
suppressed.
RESULTS
Cancer Incidence Rates for All Sites Combined
and for the Most Common Cancers
Figure 1 illustrates trends from 1999 to 2014 in age-
standardized, delay-adjusted incidence rates for all cancer
sites combined among men and among women. Incidence
rates among men decreased throughout the study period,
with the decrease accelerating from 0.6% (on average) per
year during 1999 to 2008 to 2.2% (on average) per year
during 2008 to 2014. In contrast, over the same 15-year
period, incidence rates among women were stable.
Figure 2 presents average annual incidence rates and
5-year AAPCs (2010-2014) for the 17 most common can-
cers among men and the 18 most common cancers among
women. Among men, incidence rates decreased for 7 of
the 17 most common cancers: prostate (5-year AAPC,
27.6%), lung and bronchus (22.4%), colon and rec-
tum (colorectal) (21.9%), urinary bladder (bladder)
(20.8%), esophagus (21.6%), brain and other nervous
system (20.2%), and larynx (22.3%) (Table 1 and Fig.
2). In contrast, incidence rates among men increased for
8 cancers: melanoma of the skin (5-year AAPC, 2.3%),
kidney and renal pelvis (kidney) (1.1%), leukemia
(1.6%), oral cavity and pharynx (1.3%), pancreas (1.0%),
liver and intrahepatic bile duct (liver) (2.8%), myeloma
(2.5%), and thyroid (2.4%). Incidence rates were stable
for non-Hodgkin lymphoma (NHL) and stomach cancer.
Among women, incidence rates decreased for 7 of
the 18 most common cancers: lung and bronchus (5-year
Annual Report National Cancer Statistics/Cronin et al
Cancer July 1, 2018 2787
AAPC, 21.2%), colorectal (21.7%), NHL (20.4%),
ovary (21.6%), bladder (20.8%), cervix uteri (cervix)
(21.0%), and brain and other nervous system (20.7%).
However, incidence rates increased for 10 cancers: breast
(0.4%), corpus and uterus not otherwise specified (uterus)
(1.2%), thyroid (1.9%), melanoma of the skin (1.2%),
leukemia (1.4%), kidney (0.4%), pancreas (1.1%), oral
cavity and pharynx (0.8%), myeloma (1.6%), and liver
(3.8%). Incidence rates remained unchanged for stomach
cancer (Table 1 and Fig. 2). Liver cancer replaced thyroid
cancer as the most rapidly increasing incident cancer
among women. For most cancer sites, the increasing or
decreasing trends from 2010 to 2014 among men and
among women were continuations of past trends (Sup-
porting Table 1).
At the end of this Results section, incidence and
mortality trends for female breast cancer, colorectal can-
cer, lung and bronchus cancer, and melanoma of the
skin are discussed in greater detail—along with stage at
diagnosis and survival by stage. Prostate cancer inci-
dence and mortality are examined in detail in Part II of
this report.
Cancer Death Rates for All Sites Combined
and for the Most Common Cancers
Figure 1 illustrates trends in death rates from 1999 to
2015 for all cancer sites combined, by sex. Death rates
decreased during this period by 1.8% on average per year
among men and by 1.4% on average per year among
women.
Figure 3 presents average annual death rates and 5-
year AAPCs (2011-2015) for the 18 most common can-
cers among men and the 20 most common cancers among
women. Among men, death rates during this period
decreased for 11 of the 18 cancers: lung and bronchus (5-
year AAPC, 23.8%), prostate (22.2%), colorectal
(22.5%), leukemia (22.2%), NHL (22.0%), esophagus
(21.1%), kidney (20.5%), stomach (21.6%), myeloma
(20.9%), melanoma of the skin (23.0%), and larynx
(22.5%). In contrast, death rates among men increased
for cancers of the pancreas (0.2%), liver (1.6%), brain and
other nervous system (0.5%), oral cavity and pharynx
(1.0%), nonmelanoma skin (2.8%), and soft tissue
(including heart) (0.8%). The death rate among men was
stable for bladder cancer (Fig. 3 and Table 2).
Figure 1. Trends in age-standardized incidence (1999-2014) and
mortality rates (1999-2015) are illustrated for all cancer sites
combined, all races/ethnicities combined, and by sex. An
asterisk indicates that the annual percent change (APC) or the
average
APC (AAPC) is statistically significantly different from zero
(2-sided t test; P <.05). UNK indicates unknown. Rates were
age-
standardized to the 2000 US standard population (19 age
groups; Bureau of the Census. Current Population Reports,
Publication
25-1130. Washington, DC: US Government Printing Office;
2000 [Census 25-1130]). Scattered points indicate observed
rates, and
lines are fitted rates according to joinpoint regression.
Incidence rates were delay-adjusted and covered 89% of the US
popula-
tion, and mortality covered the entire United States. The
following registries were included for incidence: Alabama,
Alaska, Ari-
zona, Arkansas, California, Colorado, Connecticut, Delaware,
Florida, Georgia, Hawaii, Idaho, Illinois, Indiana, Iowa,
Kentucky,
Louisiana, Maine, Maryland, Massachusetts, Michigan,
Missouri, Montana, Nebraska, New Hampshire, New Jersey,
New York, North
Carolina, North Dakota, Ohio, Oklahoma, Oregon,
Pennsylvania, Rhode Island, South Carolina, Texas, Utah,
Vermont, Washington,
West Virginia, Wisconsin, and Wyoming. The AAPC is a
weighted average of the APCs over the fixed interval (2010-
2014 for inci-
dence; 2011-2015 for mortality) using the underlying Joinpoint
model for the period from 1999 to 2014 for incidence and the
period from 1999 to 2015 for mortality. Joinpoint models with
up to 2 joinpoints for incidence and up to 3 joinpoints for
mortality
are based on rates per 100,000 persons age standardized to the
2000 US standard population (19 age groups; Census P25-
1130). For joinpoint analysis, the Joinpoint Regression Program
was used (version 4.5.01; Bethesda, MD: Statistical Research
and
Applications Branch, National Cancer Institute; June 2017).
Original Article
2788 Cancer July 1, 2018
Among women, during the same time period, death
rates decreased for 14 of the 20 most common cancer
types: lung and bronchus (5-year AAPC, 22.4%), breast
(21.6%), colorectal (22.7%), ovary (22.3%), leukemia
(22.3%), NHL (22.7%), kidney (21.4%), stomach
(21.8%), cervix (20.7%), bladder (20.5%), melanoma
of the skin (22.6%), esophagus (21.6%), oral cavity and
pharynx (21.3%), and gallbladder (21.3%) (Fig. 3 and
Table 2). In contrast, death rates among women increased
for cancers of the pancreas (0.2%), uterus (1.9%), liver
(2.7%), and brain and other nervous system (0.5%).
Death rates among women were stable for myeloma and
soft tissue (including heart). Like the incidence trends,
increases or decreases in death rates for most cancers
among men and women were continuations of past trends
(Supporting Table 2).
Current Cancer Incidence Rates and Trends
by Sex, Race, and Ethnicity
Table 1 lists average annual age-standardized, delay-
adjusted incidence rates and trends for the most recent 5-
year period (2010-2014) by cancer site, sex, race, and eth-
nicity. For all cancer sites combined, rates were higher
among men than among women overall (all races/ethnici-
ties combined; 502.0 vs 420.6 per 100,000 persons) and
among persons in every racial/ethnic group. Black men
and white women had higher overall cancer incidence
rates than other racial groups. Non-Hispanic men and
women had higher incidence rates than those of Hispanic
ethnicity. API men and API women had the lowest rates
relative to other racial and ethnic groups. In every racial
and ethnic group, prostate cancer among men and breast
cancer among women were the most frequent incident
cancers, followed by lung and bronchus cancer, and colo-
rectal cancer, except among Hispanics. Among Hispanic
men and Hispanic women, colorectal cancer was more
frequent than lung and bronchus cancer. Rankings for
several other cancers varied substantially by race and eth-
nicity among both men and women. Among men, for
example, melanoma of the skin ranked fifth in whites and
19th in blacks; and liver cancer ranked 11th in whites,
sixth in blacks, and fourth in APIs.
Among men in each racial/ethnic group, incidence
trends during 2010 to 2014 for all cancer sites combined
and for each of the 17 most common cancers were gener-
ally similar in direction (decrease or increase) to those for
all races/ethnicities combined (Table 1). Incidence rates
among men in each racial and ethnic group decreased for
all cancers combined and for each of the 3 most common
cancers (prostate, lung and bronchus, colorectal), except
that the rate was stable for lung and bronchus cancer
among AIs/ANs. Rates also decreased among men in each
racial/ethnic group for cancers of the bladder, stomach,
Figure 2. Age-standardized, delay-adjusted incidence rates
and recent trends (2010-2014) are illustrated for the 17 most
common cancers in men and the 18 most common cancers in
women for all races/ethnicities combined and by sex. The 5-
year average annual percent change (AAPC) is based on the
joinpoint trend from 1999 to 2014. An asterisk indicates that
the AAPC is statistically significantly different from zero (2-
sided t test or Z test; P <.05). Rates were age-standardized to
the 2000 US standard population (19 age groups; Census P25-
1130), were delay-adjusted, and covered 89% of the US popula-
tion. The following registries were included in the analyses:
Ala-
bama, Alaska, Arizona, Arkansas, California, Colorado,
Connecticut, Delaware, Florida, Georgia, Hawaii, Idaho,
Illinois,
Indiana, Iowa, Kentucky, Louisiana, Maine, Maryland,
Massachu-
setts, Michigan, Missouri, Montana, Nebraska, New Hampshire,
New Jersey, New York, North Carolina, North Dakota, Ohio,
Oklahoma, Oregon, Pennsylvania, Rhode Island, South Caro-
lina, Texas, Utah, Vermont, Washington, West Virginia,
Wiscon-
sin, and Wyoming. The AAPC is a weighted average of the
annual percent changes (APCs) over the fixed interval (2010-
2014) using the underlying joinpoint model for the period from
1999 to 2014. Joinpoint models with up to 2 joinpoints are
based on rates per 100,000 persons age standardized to the
2000 US standard population (19 age groups; Census P25-
1130). For joinpoint analysis, the Joinpoint Regression Program
was used (version 4.5.0.1; Bethesda, MD: Statistical Research
and Applications Branch, National Cancer Institute; June 2017).
Annual Report National Cancer Statistics/Cronin et al
Cancer July 1, 2018 2789
T
A
B
L
E
1.
A
g
e
-S
ta
n
d
a
rd
iz
e
d
,
D
e
la
y
-A
d
ju
s
te
d
In
c
id
e
n
c
e
R
a
te
s
a
n
d
F
ix
e
d
-I
n
te
rv
a
l
T
re
n
d
s
(2
0
10
-2
0
14
)
fo
r
th
e
M
o
s
t
C
o
m
m
o
n
C
a
n
c
e
rs
b
y
S
e
x
,
R
a
c
e
,
a
n
d
E
th
n
ic
it
y
fo
r
A
re
a
s
in
th
e
U
n
it
e
d
S
ta
te
s
W
it
h
H
ig
h
-Q
u
a
li
ty
In
c
id
e
n
c
e
D
a
ta
a
,b
A
ll
R
a
c
e
s
c
W
h
it
e
c
B
la
c
k
c
A
P
Ic
A
I/
A
N
(C
H
S
D
A
)c
H
is
p
a
n
ic
c
N
o
n
-H
is
p
a
n
ic
c
S
e
x
/C
a
n
c
e
r
S
it
e
o
r
T
y
p
e
d
R
a
n
k
R
a
te
e
2
0
1
0
-2
0
1
4
A
A
P
C
f
P
R
a
n
k
R
a
te
e
2
0
1
0
-2
0
1
4
A
A
P
C
f
P
R
a
n
k
R
a
te
e
2
0
1
0
-2
0
1
4
A
A
P
C
f
P
R
a
n
k
R
a
te
e
2
0
1
0
-2
0
1
4
A
A
P
C
f
P
R
a
n
k
R
a
te
e
2
0
1
0
-2
0
1
4
A
A
P
C
f
P
R
a
n
k
R
a
te
e
2
0
1
0
-2
0
1
4
A
A
P
C
f
P
R
a
n
k
R
a
te
e
2
0
1
0
-2
0
1
4
A
A
P
C
f
P
A
ll
s
it
e
s
g
B
o
th
s
e
x
e
s
4
5
3
.8
2
1
.0
h
.0
0
1
4
5
7
.3
2
1
.0
h
.0
0
1
4
6
7
.5
2
1
.4
h
<
.0
0
1
2
9
9
.1
2
0
.4
h
<
.0
0
1
4
2
3
.4
0
.1
.4
3
3
5
6
.2
2
1
.2
h
<
.0
0
1
4
6
5
.7
2
0
.9
h
.0
0
2
M
a
le
s
5
0
2
.0
2
2
.2
h
<
.0
0
1
5
0
0
.1
2
2
.1
h
<
.0
0
1
5
5
8
.2
2
3
.0
h
<
.0
0
1
3
0
9
.0
2
2
.6
h
<
.0
0
1
4
4
6
.8
2
0
.5
h
.0
4
3
9
2
.6
2
2
.8
h
<
.0
0
1
5
1
4
.7
2
2
.1
h
<
.0
0
1
F
e
m
a
le
s
4
2
0
.6
0
.0
.9
6
4
2
8
.7
0
.0
.5
9
4
0
6
.8
0
.3
h
<
.0
0
1
2
9
5
.8
0
.7
h
<
.0
0
1
4
0
9
.9
0
.6
h
<
.0
0
1
3
3
5
.3
0
.6
.1
4
4
3
1
.5
0
.1
.0
7
M
a
le
s
P
ro
s
ta
te
1
1
1
8
.2
2
7
.6
h
<
.0
0
1
1
1
1
0
.1
2
7
.0
h
<
.0
0
1
1
1
9
3
.5
2
6
.0
h
<
.0
0
1
1
6
2
.5
2
9
.5
h
<
.0
0
1
1
8
6
.6
2
9
.0
h
<
.0
0
1
1
1
0
1
.6
2
7
.8
h
<
.0
0
1
1
1
2
0
.2
2
7
.6
h
<
.0
0
1
L
u
n
g
a
n
d
b
ro
n
c
h
u
s
2
7
3
.2
2
2
.4
h
<
.0
0
1
2
7
3
.1
2
2
.3
h
<
.0
0
1
2
8
5
.8
2
3
.0
h
<
.0
0
1
2
4
6
.4
2
1
.5
h
<
.0
0
1
2
7
4
.4
2
0
.5
.1
6
3
4
1
.4
2
2
.6
h
<
.0
0
1
2
7
6
.3
2
2
.2
h
<
.0
0
1
C
o
lo
n
a
n
d
re
c
tu
m
3
4
6
.5
2
1
.9
h
.0
0
4
3
4
5
.5
2
1
.9
h
.0
0
5
3
5
6
.1
2
2
.8
h
<
.0
0
1
3
3
8
.2
2
2
.2
h
<
.0
0
1
3
5
3
.2
2
1
.8
h
.0
1
2
4
3
.0
2
2
.7
h
<
.0
0
1
3
4
7
.0
2
1
.8
h
.0
0
3
U
ri
n
a
ry
b
la
d
d
e
r
4
3
6
.8
2
0
.8
h
<
.0
0
1
4
3
9
.3
2
0
.7
h
<
.0
0
1
5
2
0
.3
0
.7
h
<
.0
0
1
6
1
5
.6
2
0
.4
h
.0
3
5
2
1
.5
0
.4
.3
8
7
2
0
.2
2
1
.9
h
<
.0
0
1
4
3
8
.3
2
0
.6
h
<
.0
0
1
M
e
la
n
o
m
a
o
f
th
e
s
k
in
5
2
7
.4
2
.3
h
<
.0
0
1
5
3
1
.1
2
.5
h
<
.0
0
1
1
9
1
.2
2
0
.3
.5
2
1
8
1
.6
0
.2
.7
2
1
2
1
0
.1
1
1
.7
.1
2
1
5
5
.1
3
.1
.1
0
5
3
0
.0
2
.6
h
<
.0
0
1
N
o
n
-H
o
d
g
k
in
ly
m
p
h
o
m
a
6
2
3
.7
2
0
.2
.1
1
6
2
4
.4
2
0
.4
h
.0
2
7
1
7
.6
0
.2
.1
2
5
1
6
.4
0
.4
.1
4
7
1
8
.1
0
.1
.9
4
5
2
0
.6
2
0
.2
.3
2
6
2
4
.1
2
0
.2
.8
5
K
id
n
e
y
a
n
d
re
n
a
l
p
e
lv
is
7
2
2
.3
1
.1
h
.0
0
1
7
2
2
.5
0
.7
h
.0
0
1
4
2
4
.7
1
.0
h
.0
3
9
1
1
.4
2
.3
h
<
.0
0
1
4
3
1
.9
2
.1
h
.0
0
2
4
2
1
.5
1
.0
.2
1
7
2
2
.5
1
.2
h
.0
0
1
L
e
u
k
e
m
ia
8
1
9
.0
1
.6
h
<
.0
0
1
8
1
9
.8
1
.6
h
<
.0
0
1
1
1
1
4
.7
1
.0
h
<
.0
0
1
1
0
1
0
.4
0
.8
h
.0
3
9
1
4
.0
0
.5
.5
5
8
1
4
.1
0
.5
h
.0
3
8
1
9
.3
1
.7
h
<
.0
0
1
O
ra
l
c
a
v
it
y
a
n
d
p
h
a
ry
n
x
9
1
7
.7
1
.3
h
<
.0
0
1
9
1
8
.3
1
.6
h
<
.0
0
1
1
0
1
4
.8
2
1
.9
h
<
.0
0
1
8
1
1
.7
0
.5
.1
3
8
1
7
.1
1
.3
.0
7
1
1
1
0
.9
2
0
.9
h
.0
0
3
9
1
8
.6
1
.6
h
<
.0
0
1
P
a
n
c
re
a
s
1
0
1
4
.5
1
.0
h
<
.0
0
1
1
0
1
4
.4
1
.1
h
<
.0
0
1
8
1
7
.0
0
.6
h
.0
0
3
1
1
1
0
.3
0
.5
h
.0
4
1
0
1
2
.6
1
.3
.1
9
1
0
1
2
.3
0
.5
h
.0
3
1
0
1
4
.7
1
.1
h
<
.0
0
1
L
iv
e
r
a
n
d
in
tr
a
h
e
p
a
ti
c
b
ile
d
u
c
t
1
1
1
2
.5
2
.8
h
<
.0
0
1
1
1
1
1
.3
3
.3
h
<
.0
0
1
6
1
7
.7
2
.6
h
.0
0
2
4
2
0
.6
2
1
.7
h
.0
0
3
6
2
0
.7
4
.6
h
<
.0
0
1
6
2
0
.4
1
.1
.1
8
1
1
1
1
.7
2
.9
h
<
.0
0
1
S
to
m
a
c
h
1
2
9
.4
2
0
.3
.1
3
…
Brisia Rivera
Cultural Immersion
April 27, 2020
Introduction:
I am merging my Global and Cultural Studies major with the
The Latina Love Movement
internship both my research and resources will exemplify and
discuss woman’s empowerment in
the business corporate cultural atmosphere. (topic)In a world of
gender imbalance women in
business is a form of empowerment.
Body:
As countries all over the world continue to participate in the
global market, the Latina
Love Movement has shed light on:
Job Segregation
•
•
Women Absent on Corporation Boards
•
•
Women Under Represented in Business Education
•
•
Conclusion:
• Organizations are more successful as they leverage innovation
and multiple viewpoints,
and are more reflective of their actual customers
• Effective ways to change minds and provoke action. That’s
why pairing up women with
strong female role models is one of the many ways to empower
your employees to
succeed in both your company and their industries.
• Women are to be respected for who they are, their unique
perspective, skills,
dedication, and strong work ethic.
How does this relate to Woman’s empowerment?
1. JOB SEGREGATION
2. WOMEN ABSENT ON CORPORATE BOARDS
3. WOMEN UNDERREPRESENTED IN BUSSINESS
EDUCATION
What culture are you being immersed in?
BUSSINESS ARENA
1. Culture of Diversity,
2. Culture on inclusion, and
3. Culture of fairness
Topic: A professional setting to discuss your business’s stance
on women’s equality in the
workplace
Note:
Incorporate Women’s Empowerment though business with
statical sociological data.
Highlight the Economic benefits of women in the work force in
the U.S. and compare it to
countries where women are academically and professionally
limited lunch as middle Eastern
countries any country with limited female rights
Provide an overview of the Hindu religion with an emphasis on
the chakras and reflect on how
the full synchronization of the mind body and soul are vital to
your proffessional pdevelopment
progress and development.
JOB SEGREGATION
WOMEN ABSENT ON CORPORATE BOARDS
WOMEN UNDERREPRESENTED IN BUSSINESS
EDUCATION
With 7 out of 10 women age 25 to 54 in the labor force today,
women make up nearly half of all
paid workers. Women now comprise 45.4% of employed
workers, compared to 38% in 1970.
Roughly two-thirds of all new entrants in the workforce from
now through the year 1100 will be
women, and the labor force participation rates of women will
reach over 80% by 1995.
Yet, women continue to be highly segregated in the workforce.
Ninety-nine percent of secretaries
are women, as are 93% of bookkeepers, 93% of nurses, and 82%
of administrative/clerical
support workers. Women are the majority of textile workers
(91%) and housekeepers (82%).
Job segregation translates into lower earnings for women. Full-
time employed women still earn
considerably less than men. The average man with a high school
education working full- time
earns more than the average woman fulltime worker with a
college degree, and the situation is
even worse for African-American, Asian-American, and Latina
women.
Although women comprise 40% of all executive, management,
and administrative positions (up
from 24% in 1976), they remain confined mostly to the middle
and lower ranks, and the senior
levels of management are almost exclusively male domains. A
1990 study of the top Fortune 500
companies by Mary Ann Von Glinow of the University of
Southern California, showed that
women were only 2.6% of corporate officers (the vice
presidential level up). Of the Fortune
Service 500, only 4.3% of corporate officers were women --
even though women are 61% of all
service workers.
More shocking is that these numbers have shown very little
improvement in the 25 years that
these statistics have been tracked (University of Michigan,
Korn/Ferry International). This means
that at the current rate of increase, it will be 475 years - or not
until the year 2466 before women
reach equality with men in the executive suite.
Women Absent on Corporate Boards
The story is not much better on corporate boards:only 4.5% of
the Fortune 500 industrial
directorships are held by women. On Fortune Service 500
companies, 5.6% of corporate
directors are women. The rate of increase is so slow that parity
with men on corporate board will
not be achieved until the year 2116 - or for 125 years.
Recently published studies purport to show that women are
making significant gains on
corporate boards: a 1988 Korn/Ferry survey reported that 52.8%
of major U.S. corporations had
women board members, up from the 42.9% in 1986. But only
25% of the Fortune 1000
companies in 1986 had more than one woman on their board,
according to the Wall Street
Journal. In fact, there is such a huge overlap among women
sitting on corporate boards, that just
39 directors account for 33% of the 652 Fortune 1000
directorships held by women.
In 1980, only one woman held the rank of CEO of a Fortune
500* company. She came into the
top management by inheriting the company from her father and
husband. In 1985, this executive
was joined by a second woman who reached the top - by
founding the company she headed.
Today, there is again only one woman at the top of a Fortune
500 company.
For African-American, Asian-American and Latina women, the
situation at the top is even worse.
A 1986 survey by the Equal Employment Opportunity
Commission (as reported in Morrison and
Von Glinow) showed that between 1974 and 1984, the
percentage of African-American women
executives grew at a snail's pace of 0.7% of the total, to 1.7%.
By comparison, African-American
and Latina women constitute about 7% of the total workforce.
The pay gap exists even at the executive level: a May 1987
report by Nation's Business showed
that "women at the vice-presidential levels and above earn 42%
less than their male peers."
According to a 1984 Wall Street Journal/Gallup poll, 70% of
executive women believe they are
"paid less than men of equal ability."
Women Under-Represented in Business Education
Women have done somewhat better in gaining access to a
business education: in 1970, women
comprised 3.5% of all MBA graduates; whereas in 1989, 33.6%
of the MBA graduates were
women. Women received 46.7% of all bachelors degrees in
business yet only 26.6% of the
doctorates. At the most prestigious business graduate schools -
Harvard, Columbia, Mihigan,
M.I.T. - women make up a smaller percentage of the student
body.
Despite the changes in the student body, the faculty and
administration of business schools
remain predominantly white and male, not unlike corporate
management where women are
grossly under-represented. Women account for only 4% of
business school deans and there are
no women presidents.
*Note: The Fortune 500 represents the largest industrial
corporations. The Fortune Service 500
is separate listing including only the service industries such as
retailing, banking, insurance, and
finance.
Annual Report to the Nation on the Status of Cancer,Part I .docx

Weitere ähnliche Inhalte

Ähnlich wie Annual Report to the Nation on the Status of Cancer,Part I .docx

National Cancer Registry 2014-2018 - UAE
National Cancer Registry 2014-2018 - UAENational Cancer Registry 2014-2018 - UAE
National Cancer Registry 2014-2018 - UAEAnjalaNizam
 
Cancer prevalence & causative agents 2018
Cancer prevalence & causative agents 2018Cancer prevalence & causative agents 2018
Cancer prevalence & causative agents 2018Birendra Bhatt
 
Athanasios Andriopoulos_final (2)
Athanasios Andriopoulos_final (2)Athanasios Andriopoulos_final (2)
Athanasios Andriopoulos_final (2)Thanos Andriopoulos
 
Cancer survival mortality_and_incidence_7_countries_1568689974
Cancer survival mortality_and_incidence_7_countries_1568689974Cancer survival mortality_and_incidence_7_countries_1568689974
Cancer survival mortality_and_incidence_7_countries_1568689974RamiroCazco2
 
factores de riesgo DM2
factores de riesgo DM2factores de riesgo DM2
factores de riesgo DM2MelendiNavarro
 
Transition from film to digital mammography
Transition from film to digital mammographyTransition from film to digital mammography
Transition from film to digital mammographyLisanne van Lier
 
Women's Access to Healthcare - GRU Cancer Center Presentation
Women's Access to Healthcare - GRU Cancer Center PresentationWomen's Access to Healthcare - GRU Cancer Center Presentation
Women's Access to Healthcare - GRU Cancer Center PresentationGeorgia Commission on Women
 
Glucose Metabolism in Cancer The Warburg Effect and Beyond.pdf
Glucose Metabolism in Cancer The Warburg Effect and Beyond.pdfGlucose Metabolism in Cancer The Warburg Effect and Beyond.pdf
Glucose Metabolism in Cancer The Warburg Effect and Beyond.pdfBkesNar
 
Miners and quarry workers have the highest suicide rates of any job in the U.S.
Miners and quarry workers have the highest suicide rates of any job in the U.S.Miners and quarry workers have the highest suicide rates of any job in the U.S.
Miners and quarry workers have the highest suicide rates of any job in the U.S.Δρ. Γιώργος K. Κασάπης
 
Cancer RegistriesObjectives• Cancer registry definition• P.docx
Cancer RegistriesObjectives• Cancer registry definition• P.docxCancer RegistriesObjectives• Cancer registry definition• P.docx
Cancer RegistriesObjectives• Cancer registry definition• P.docxhumphrieskalyn
 
Breast cancer survival and race
Breast cancer survival and raceBreast cancer survival and race
Breast cancer survival and raceMadhav Kc
 
A new research paper published by Dr. Suheil Simaan and Dr. Feras Al Jerf
A new research paper published by Dr. Suheil Simaan and Dr. Feras Al JerfA new research paper published by Dr. Suheil Simaan and Dr. Feras Al Jerf
A new research paper published by Dr. Suheil Simaan and Dr. Feras Al JerfCancer Care Specilties
 
Cancer incidence in Malawi: Time trends in Blantyre 1996-2005 and predictions...
Cancer incidence in Malawi: Time trends in Blantyre 1996-2005 and predictions...Cancer incidence in Malawi: Time trends in Blantyre 1996-2005 and predictions...
Cancer incidence in Malawi: Time trends in Blantyre 1996-2005 and predictions...Humphrey Misiri
 

Ähnlich wie Annual Report to the Nation on the Status of Cancer,Part I .docx (20)

National Cancer Registry 2014-2018 - UAE
National Cancer Registry 2014-2018 - UAENational Cancer Registry 2014-2018 - UAE
National Cancer Registry 2014-2018 - UAE
 
Aging oncologists in US could spell a shortage9
Aging oncologists in US could spell a shortage9Aging oncologists in US could spell a shortage9
Aging oncologists in US could spell a shortage9
 
Cancer Statistics 2006 Presentation
Cancer Statistics 2006 PresentationCancer Statistics 2006 Presentation
Cancer Statistics 2006 Presentation
 
Cancer
CancerCancer
Cancer
 
Cancer prevalence & causative agents 2018
Cancer prevalence & causative agents 2018Cancer prevalence & causative agents 2018
Cancer prevalence & causative agents 2018
 
Athanasios Andriopoulos_final (2)
Athanasios Andriopoulos_final (2)Athanasios Andriopoulos_final (2)
Athanasios Andriopoulos_final (2)
 
Cancer survival mortality_and_incidence_7_countries_1568689974
Cancer survival mortality_and_incidence_7_countries_1568689974Cancer survival mortality_and_incidence_7_countries_1568689974
Cancer survival mortality_and_incidence_7_countries_1568689974
 
Cancer cases in Canada are projected to rise
Cancer cases in Canada are projected to riseCancer cases in Canada are projected to rise
Cancer cases in Canada are projected to rise
 
factores de riesgo DM2
factores de riesgo DM2factores de riesgo DM2
factores de riesgo DM2
 
Transition from film to digital mammography
Transition from film to digital mammographyTransition from film to digital mammography
Transition from film to digital mammography
 
Women's Access to Healthcare - GRU Cancer Center Presentation
Women's Access to Healthcare - GRU Cancer Center PresentationWomen's Access to Healthcare - GRU Cancer Center Presentation
Women's Access to Healthcare - GRU Cancer Center Presentation
 
Glucose Metabolism in Cancer The Warburg Effect and Beyond.pdf
Glucose Metabolism in Cancer The Warburg Effect and Beyond.pdfGlucose Metabolism in Cancer The Warburg Effect and Beyond.pdf
Glucose Metabolism in Cancer The Warburg Effect and Beyond.pdf
 
Miners and quarry workers have the highest suicide rates of any job in the U.S.
Miners and quarry workers have the highest suicide rates of any job in the U.S.Miners and quarry workers have the highest suicide rates of any job in the U.S.
Miners and quarry workers have the highest suicide rates of any job in the U.S.
 
cancer facts.pdf
cancer facts.pdfcancer facts.pdf
cancer facts.pdf
 
Cancer RegistriesObjectives• Cancer registry definition• P.docx
Cancer RegistriesObjectives• Cancer registry definition• P.docxCancer RegistriesObjectives• Cancer registry definition• P.docx
Cancer RegistriesObjectives• Cancer registry definition• P.docx
 
TNBC Giraldo-Cabanillas
TNBC Giraldo-CabanillasTNBC Giraldo-Cabanillas
TNBC Giraldo-Cabanillas
 
Breast cancer survival and race
Breast cancer survival and raceBreast cancer survival and race
Breast cancer survival and race
 
A new research paper published by Dr. Suheil Simaan and Dr. Feras Al Jerf
A new research paper published by Dr. Suheil Simaan and Dr. Feras Al JerfA new research paper published by Dr. Suheil Simaan and Dr. Feras Al Jerf
A new research paper published by Dr. Suheil Simaan and Dr. Feras Al Jerf
 
Cancer incidence in Malawi: Time trends in Blantyre 1996-2005 and predictions...
Cancer incidence in Malawi: Time trends in Blantyre 1996-2005 and predictions...Cancer incidence in Malawi: Time trends in Blantyre 1996-2005 and predictions...
Cancer incidence in Malawi: Time trends in Blantyre 1996-2005 and predictions...
 
5.14.11.public health
5.14.11.public health5.14.11.public health
5.14.11.public health
 

Mehr von jack60216

Anorexia1-Definition2-Epidemiology in united states2.docx
Anorexia1-Definition2-Epidemiology in united states2.docxAnorexia1-Definition2-Epidemiology in united states2.docx
Anorexia1-Definition2-Epidemiology in united states2.docxjack60216
 
Annotated BibliographyIn preparation of next weeks final as.docx
Annotated BibliographyIn preparation of next weeks final as.docxAnnotated BibliographyIn preparation of next weeks final as.docx
Annotated BibliographyIn preparation of next weeks final as.docxjack60216
 
Annotated BibliographyDue 1212019 @ 12pm Eastern Time (Unite.docx
Annotated BibliographyDue 1212019 @ 12pm Eastern Time (Unite.docxAnnotated BibliographyDue 1212019 @ 12pm Eastern Time (Unite.docx
Annotated BibliographyDue 1212019 @ 12pm Eastern Time (Unite.docxjack60216
 
Annotated BibliographyFor this assignment, you will create an .docx
Annotated BibliographyFor this assignment, you will create an .docxAnnotated BibliographyFor this assignment, you will create an .docx
Annotated BibliographyFor this assignment, you will create an .docxjack60216
 
Annotated bibliography due in 36 hours. MLA format Must incl.docx
Annotated bibliography due in 36 hours. MLA format Must incl.docxAnnotated bibliography due in 36 hours. MLA format Must incl.docx
Annotated bibliography due in 36 hours. MLA format Must incl.docxjack60216
 
Analyzing a Short Story- The Necklace by Guy de MaupassantIntro.docx
Analyzing a Short Story- The Necklace by Guy de MaupassantIntro.docxAnalyzing a Short Story- The Necklace by Guy de MaupassantIntro.docx
Analyzing a Short Story- The Necklace by Guy de MaupassantIntro.docxjack60216
 
Andy Sylvan was the assistant director of the community developm.docx
Andy Sylvan was the assistant director of the community developm.docxAndy Sylvan was the assistant director of the community developm.docx
Andy Sylvan was the assistant director of the community developm.docxjack60216
 
Annotated Bibliography Althaus, F. U.S. Maternal Morta.docx
Annotated Bibliography  Althaus, F. U.S. Maternal Morta.docxAnnotated Bibliography  Althaus, F. U.S. Maternal Morta.docx
Annotated Bibliography Althaus, F. U.S. Maternal Morta.docxjack60216
 
Ann, a community nurse, made an afternoon home visit with Susan and .docx
Ann, a community nurse, made an afternoon home visit with Susan and .docxAnn, a community nurse, made an afternoon home visit with Susan and .docx
Ann, a community nurse, made an afternoon home visit with Susan and .docxjack60216
 
Andrea Walters Week 2 Main Post       The key functional area of n.docx
Andrea Walters Week 2 Main Post       The key functional area of n.docxAndrea Walters Week 2 Main Post       The key functional area of n.docx
Andrea Walters Week 2 Main Post       The key functional area of n.docxjack60216
 
and emergency CPR all changed ways of thinking about risk of death.docx
and emergency CPR all changed ways of thinking about risk of death.docxand emergency CPR all changed ways of thinking about risk of death.docx
and emergency CPR all changed ways of thinking about risk of death.docxjack60216
 
analyze, and discuss emerging ICT tools and technologies present.docx
analyze, and discuss emerging ICT tools and technologies present.docxanalyze, and discuss emerging ICT tools and technologies present.docx
analyze, and discuss emerging ICT tools and technologies present.docxjack60216
 
Analyzing a Research ArticleNote Please complete this dis.docx
Analyzing a Research ArticleNote Please complete this dis.docxAnalyzing a Research ArticleNote Please complete this dis.docx
Analyzing a Research ArticleNote Please complete this dis.docxjack60216
 
Analyze the Civil Rights Movement of the 1950s and 1960s. What p.docx
Analyze the Civil Rights Movement of the 1950s and 1960s. What p.docxAnalyze the Civil Rights Movement of the 1950s and 1960s. What p.docx
Analyze the Civil Rights Movement of the 1950s and 1960s. What p.docxjack60216
 
Analytical Research Project InstructionsINFA 630 – Intrusion.docx
Analytical Research Project InstructionsINFA 630 – Intrusion.docxAnalytical Research Project InstructionsINFA 630 – Intrusion.docx
Analytical Research Project InstructionsINFA 630 – Intrusion.docxjack60216
 
Analyze the performance of the leadership of an organization (Netfli.docx
Analyze the performance of the leadership of an organization (Netfli.docxAnalyze the performance of the leadership of an organization (Netfli.docx
Analyze the performance of the leadership of an organization (Netfli.docxjack60216
 
Analyze the subjective portion of the note. List additiona.docx
Analyze the subjective portion of the note. List additiona.docxAnalyze the subjective portion of the note. List additiona.docx
Analyze the subjective portion of the note. List additiona.docxjack60216
 
Analyze the measures your state and local community have in pl.docx
Analyze the measures your state and local community have in pl.docxAnalyze the measures your state and local community have in pl.docx
Analyze the measures your state and local community have in pl.docxjack60216
 
Analyze two (2) advantages and two (2) disadvantages of creati.docx
Analyze two (2) advantages and two (2) disadvantages of creati.docxAnalyze two (2) advantages and two (2) disadvantages of creati.docx
Analyze two (2) advantages and two (2) disadvantages of creati.docxjack60216
 
Analyze the performance of the leadership of an organization (Huawei.docx
Analyze the performance of the leadership of an organization (Huawei.docxAnalyze the performance of the leadership of an organization (Huawei.docx
Analyze the performance of the leadership of an organization (Huawei.docxjack60216
 

Mehr von jack60216 (20)

Anorexia1-Definition2-Epidemiology in united states2.docx
Anorexia1-Definition2-Epidemiology in united states2.docxAnorexia1-Definition2-Epidemiology in united states2.docx
Anorexia1-Definition2-Epidemiology in united states2.docx
 
Annotated BibliographyIn preparation of next weeks final as.docx
Annotated BibliographyIn preparation of next weeks final as.docxAnnotated BibliographyIn preparation of next weeks final as.docx
Annotated BibliographyIn preparation of next weeks final as.docx
 
Annotated BibliographyDue 1212019 @ 12pm Eastern Time (Unite.docx
Annotated BibliographyDue 1212019 @ 12pm Eastern Time (Unite.docxAnnotated BibliographyDue 1212019 @ 12pm Eastern Time (Unite.docx
Annotated BibliographyDue 1212019 @ 12pm Eastern Time (Unite.docx
 
Annotated BibliographyFor this assignment, you will create an .docx
Annotated BibliographyFor this assignment, you will create an .docxAnnotated BibliographyFor this assignment, you will create an .docx
Annotated BibliographyFor this assignment, you will create an .docx
 
Annotated bibliography due in 36 hours. MLA format Must incl.docx
Annotated bibliography due in 36 hours. MLA format Must incl.docxAnnotated bibliography due in 36 hours. MLA format Must incl.docx
Annotated bibliography due in 36 hours. MLA format Must incl.docx
 
Analyzing a Short Story- The Necklace by Guy de MaupassantIntro.docx
Analyzing a Short Story- The Necklace by Guy de MaupassantIntro.docxAnalyzing a Short Story- The Necklace by Guy de MaupassantIntro.docx
Analyzing a Short Story- The Necklace by Guy de MaupassantIntro.docx
 
Andy Sylvan was the assistant director of the community developm.docx
Andy Sylvan was the assistant director of the community developm.docxAndy Sylvan was the assistant director of the community developm.docx
Andy Sylvan was the assistant director of the community developm.docx
 
Annotated Bibliography Althaus, F. U.S. Maternal Morta.docx
Annotated Bibliography  Althaus, F. U.S. Maternal Morta.docxAnnotated Bibliography  Althaus, F. U.S. Maternal Morta.docx
Annotated Bibliography Althaus, F. U.S. Maternal Morta.docx
 
Ann, a community nurse, made an afternoon home visit with Susan and .docx
Ann, a community nurse, made an afternoon home visit with Susan and .docxAnn, a community nurse, made an afternoon home visit with Susan and .docx
Ann, a community nurse, made an afternoon home visit with Susan and .docx
 
Andrea Walters Week 2 Main Post       The key functional area of n.docx
Andrea Walters Week 2 Main Post       The key functional area of n.docxAndrea Walters Week 2 Main Post       The key functional area of n.docx
Andrea Walters Week 2 Main Post       The key functional area of n.docx
 
and emergency CPR all changed ways of thinking about risk of death.docx
and emergency CPR all changed ways of thinking about risk of death.docxand emergency CPR all changed ways of thinking about risk of death.docx
and emergency CPR all changed ways of thinking about risk of death.docx
 
analyze, and discuss emerging ICT tools and technologies present.docx
analyze, and discuss emerging ICT tools and technologies present.docxanalyze, and discuss emerging ICT tools and technologies present.docx
analyze, and discuss emerging ICT tools and technologies present.docx
 
Analyzing a Research ArticleNote Please complete this dis.docx
Analyzing a Research ArticleNote Please complete this dis.docxAnalyzing a Research ArticleNote Please complete this dis.docx
Analyzing a Research ArticleNote Please complete this dis.docx
 
Analyze the Civil Rights Movement of the 1950s and 1960s. What p.docx
Analyze the Civil Rights Movement of the 1950s and 1960s. What p.docxAnalyze the Civil Rights Movement of the 1950s and 1960s. What p.docx
Analyze the Civil Rights Movement of the 1950s and 1960s. What p.docx
 
Analytical Research Project InstructionsINFA 630 – Intrusion.docx
Analytical Research Project InstructionsINFA 630 – Intrusion.docxAnalytical Research Project InstructionsINFA 630 – Intrusion.docx
Analytical Research Project InstructionsINFA 630 – Intrusion.docx
 
Analyze the performance of the leadership of an organization (Netfli.docx
Analyze the performance of the leadership of an organization (Netfli.docxAnalyze the performance of the leadership of an organization (Netfli.docx
Analyze the performance of the leadership of an organization (Netfli.docx
 
Analyze the subjective portion of the note. List additiona.docx
Analyze the subjective portion of the note. List additiona.docxAnalyze the subjective portion of the note. List additiona.docx
Analyze the subjective portion of the note. List additiona.docx
 
Analyze the measures your state and local community have in pl.docx
Analyze the measures your state and local community have in pl.docxAnalyze the measures your state and local community have in pl.docx
Analyze the measures your state and local community have in pl.docx
 
Analyze two (2) advantages and two (2) disadvantages of creati.docx
Analyze two (2) advantages and two (2) disadvantages of creati.docxAnalyze two (2) advantages and two (2) disadvantages of creati.docx
Analyze two (2) advantages and two (2) disadvantages of creati.docx
 
Analyze the performance of the leadership of an organization (Huawei.docx
Analyze the performance of the leadership of an organization (Huawei.docxAnalyze the performance of the leadership of an organization (Huawei.docx
Analyze the performance of the leadership of an organization (Huawei.docx
 

Kürzlich hochgeladen

Food safety_Challenges food safety laboratories_.pdf
Food safety_Challenges food safety laboratories_.pdfFood safety_Challenges food safety laboratories_.pdf
Food safety_Challenges food safety laboratories_.pdfSherif Taha
 
SOC 101 Demonstration of Learning Presentation
SOC 101 Demonstration of Learning PresentationSOC 101 Demonstration of Learning Presentation
SOC 101 Demonstration of Learning Presentationcamerronhm
 
General Principles of Intellectual Property: Concepts of Intellectual Proper...
General Principles of Intellectual Property: Concepts of Intellectual  Proper...General Principles of Intellectual Property: Concepts of Intellectual  Proper...
General Principles of Intellectual Property: Concepts of Intellectual Proper...Poonam Aher Patil
 
Grant Readiness 101 TechSoup and Remy Consulting
Grant Readiness 101 TechSoup and Remy ConsultingGrant Readiness 101 TechSoup and Remy Consulting
Grant Readiness 101 TechSoup and Remy ConsultingTechSoup
 
Dyslexia AI Workshop for Slideshare.pptx
Dyslexia AI Workshop for Slideshare.pptxDyslexia AI Workshop for Slideshare.pptx
Dyslexia AI Workshop for Slideshare.pptxcallscotland1987
 
Unit-V; Pricing (Pharma Marketing Management).pptx
Unit-V; Pricing (Pharma Marketing Management).pptxUnit-V; Pricing (Pharma Marketing Management).pptx
Unit-V; Pricing (Pharma Marketing Management).pptxVishalSingh1417
 
How to Create and Manage Wizard in Odoo 17
How to Create and Manage Wizard in Odoo 17How to Create and Manage Wizard in Odoo 17
How to Create and Manage Wizard in Odoo 17Celine George
 
Understanding Accommodations and Modifications
Understanding  Accommodations and ModificationsUnderstanding  Accommodations and Modifications
Understanding Accommodations and ModificationsMJDuyan
 
1029-Danh muc Sach Giao Khoa khoi 6.pdf
1029-Danh muc Sach Giao Khoa khoi  6.pdf1029-Danh muc Sach Giao Khoa khoi  6.pdf
1029-Danh muc Sach Giao Khoa khoi 6.pdfQucHHunhnh
 
Micro-Scholarship, What it is, How can it help me.pdf
Micro-Scholarship, What it is, How can it help me.pdfMicro-Scholarship, What it is, How can it help me.pdf
Micro-Scholarship, What it is, How can it help me.pdfPoh-Sun Goh
 
Magic bus Group work1and 2 (Team 3).pptx
Magic bus Group work1and 2 (Team 3).pptxMagic bus Group work1and 2 (Team 3).pptx
Magic bus Group work1and 2 (Team 3).pptxdhanalakshmis0310
 
1029 - Danh muc Sach Giao Khoa 10 . pdf
1029 -  Danh muc Sach Giao Khoa 10 . pdf1029 -  Danh muc Sach Giao Khoa 10 . pdf
1029 - Danh muc Sach Giao Khoa 10 . pdfQucHHunhnh
 
psychiatric nursing HISTORY COLLECTION .docx
psychiatric  nursing HISTORY  COLLECTION  .docxpsychiatric  nursing HISTORY  COLLECTION  .docx
psychiatric nursing HISTORY COLLECTION .docxPoojaSen20
 
Key note speaker Neum_Admir Softic_ENG.pdf
Key note speaker Neum_Admir Softic_ENG.pdfKey note speaker Neum_Admir Softic_ENG.pdf
Key note speaker Neum_Admir Softic_ENG.pdfAdmir Softic
 
Activity 01 - Artificial Culture (1).pdf
Activity 01 - Artificial Culture (1).pdfActivity 01 - Artificial Culture (1).pdf
Activity 01 - Artificial Culture (1).pdfciinovamais
 
ICT Role in 21st Century Education & its Challenges.pptx
ICT Role in 21st Century Education & its Challenges.pptxICT Role in 21st Century Education & its Challenges.pptx
ICT Role in 21st Century Education & its Challenges.pptxAreebaZafar22
 
The basics of sentences session 3pptx.pptx
The basics of sentences session 3pptx.pptxThe basics of sentences session 3pptx.pptx
The basics of sentences session 3pptx.pptxheathfieldcps1
 
TỔNG ÔN TẬP THI VÀO LỚP 10 MÔN TIẾNG ANH NĂM HỌC 2023 - 2024 CÓ ĐÁP ÁN (NGỮ Â...
TỔNG ÔN TẬP THI VÀO LỚP 10 MÔN TIẾNG ANH NĂM HỌC 2023 - 2024 CÓ ĐÁP ÁN (NGỮ Â...TỔNG ÔN TẬP THI VÀO LỚP 10 MÔN TIẾNG ANH NĂM HỌC 2023 - 2024 CÓ ĐÁP ÁN (NGỮ Â...
TỔNG ÔN TẬP THI VÀO LỚP 10 MÔN TIẾNG ANH NĂM HỌC 2023 - 2024 CÓ ĐÁP ÁN (NGỮ Â...Nguyen Thanh Tu Collection
 

Kürzlich hochgeladen (20)

Mehran University Newsletter Vol-X, Issue-I, 2024
Mehran University Newsletter Vol-X, Issue-I, 2024Mehran University Newsletter Vol-X, Issue-I, 2024
Mehran University Newsletter Vol-X, Issue-I, 2024
 
Food safety_Challenges food safety laboratories_.pdf
Food safety_Challenges food safety laboratories_.pdfFood safety_Challenges food safety laboratories_.pdf
Food safety_Challenges food safety laboratories_.pdf
 
SOC 101 Demonstration of Learning Presentation
SOC 101 Demonstration of Learning PresentationSOC 101 Demonstration of Learning Presentation
SOC 101 Demonstration of Learning Presentation
 
General Principles of Intellectual Property: Concepts of Intellectual Proper...
General Principles of Intellectual Property: Concepts of Intellectual  Proper...General Principles of Intellectual Property: Concepts of Intellectual  Proper...
General Principles of Intellectual Property: Concepts of Intellectual Proper...
 
Grant Readiness 101 TechSoup and Remy Consulting
Grant Readiness 101 TechSoup and Remy ConsultingGrant Readiness 101 TechSoup and Remy Consulting
Grant Readiness 101 TechSoup and Remy Consulting
 
Dyslexia AI Workshop for Slideshare.pptx
Dyslexia AI Workshop for Slideshare.pptxDyslexia AI Workshop for Slideshare.pptx
Dyslexia AI Workshop for Slideshare.pptx
 
Unit-V; Pricing (Pharma Marketing Management).pptx
Unit-V; Pricing (Pharma Marketing Management).pptxUnit-V; Pricing (Pharma Marketing Management).pptx
Unit-V; Pricing (Pharma Marketing Management).pptx
 
How to Create and Manage Wizard in Odoo 17
How to Create and Manage Wizard in Odoo 17How to Create and Manage Wizard in Odoo 17
How to Create and Manage Wizard in Odoo 17
 
Understanding Accommodations and Modifications
Understanding  Accommodations and ModificationsUnderstanding  Accommodations and Modifications
Understanding Accommodations and Modifications
 
1029-Danh muc Sach Giao Khoa khoi 6.pdf
1029-Danh muc Sach Giao Khoa khoi  6.pdf1029-Danh muc Sach Giao Khoa khoi  6.pdf
1029-Danh muc Sach Giao Khoa khoi 6.pdf
 
Micro-Scholarship, What it is, How can it help me.pdf
Micro-Scholarship, What it is, How can it help me.pdfMicro-Scholarship, What it is, How can it help me.pdf
Micro-Scholarship, What it is, How can it help me.pdf
 
Magic bus Group work1and 2 (Team 3).pptx
Magic bus Group work1and 2 (Team 3).pptxMagic bus Group work1and 2 (Team 3).pptx
Magic bus Group work1and 2 (Team 3).pptx
 
1029 - Danh muc Sach Giao Khoa 10 . pdf
1029 -  Danh muc Sach Giao Khoa 10 . pdf1029 -  Danh muc Sach Giao Khoa 10 . pdf
1029 - Danh muc Sach Giao Khoa 10 . pdf
 
psychiatric nursing HISTORY COLLECTION .docx
psychiatric  nursing HISTORY  COLLECTION  .docxpsychiatric  nursing HISTORY  COLLECTION  .docx
psychiatric nursing HISTORY COLLECTION .docx
 
Key note speaker Neum_Admir Softic_ENG.pdf
Key note speaker Neum_Admir Softic_ENG.pdfKey note speaker Neum_Admir Softic_ENG.pdf
Key note speaker Neum_Admir Softic_ENG.pdf
 
Activity 01 - Artificial Culture (1).pdf
Activity 01 - Artificial Culture (1).pdfActivity 01 - Artificial Culture (1).pdf
Activity 01 - Artificial Culture (1).pdf
 
ICT Role in 21st Century Education & its Challenges.pptx
ICT Role in 21st Century Education & its Challenges.pptxICT Role in 21st Century Education & its Challenges.pptx
ICT Role in 21st Century Education & its Challenges.pptx
 
Spatium Project Simulation student brief
Spatium Project Simulation student briefSpatium Project Simulation student brief
Spatium Project Simulation student brief
 
The basics of sentences session 3pptx.pptx
The basics of sentences session 3pptx.pptxThe basics of sentences session 3pptx.pptx
The basics of sentences session 3pptx.pptx
 
TỔNG ÔN TẬP THI VÀO LỚP 10 MÔN TIẾNG ANH NĂM HỌC 2023 - 2024 CÓ ĐÁP ÁN (NGỮ Â...
TỔNG ÔN TẬP THI VÀO LỚP 10 MÔN TIẾNG ANH NĂM HỌC 2023 - 2024 CÓ ĐÁP ÁN (NGỮ Â...TỔNG ÔN TẬP THI VÀO LỚP 10 MÔN TIẾNG ANH NĂM HỌC 2023 - 2024 CÓ ĐÁP ÁN (NGỮ Â...
TỔNG ÔN TẬP THI VÀO LỚP 10 MÔN TIẾNG ANH NĂM HỌC 2023 - 2024 CÓ ĐÁP ÁN (NGỮ Â...
 

Annual Report to the Nation on the Status of Cancer,Part I .docx

  • 1. Annual Report to the Nation on the Status of Cancer, Part I: National Cancer Statistics Kathleen A. Cronin, PhD, MPH1; Andrew J. Lake, BS2; Susan Scott, MPH 1; Recinda L. Sherman, MPH, PhD, CTR3; Anne-Michelle Noone, MS1; Nadia Howlader, MS, PhD1; S. Jane Henley, MSPH4; Robert N. Anderson, PhD5; Albert U. Firth, BS2; Jiemin Ma, PhD, MHS6; Betsy A. Kohler, MPH, CTR3; and Ahmedin Jemal, DVM, PhD 6 BACKGROUND: The American Cancer Society (ACS), the Centers for Disease Control and Prevention (CDC), the National Cancer Institute (NCI), and the North American Association of Central Cancer Registries (NAACCR) collaborate to provide annual updates on cancer occurrence and trends in the United States. METHODS: Incidence data were obtained from the CDC-funded and NCI- funded population-based cancer registry programs and compiled by NAACCR. Data on cancer deaths were obtained from the National Center for Health Statistics National Vital Statistics System. Trends in age-standardized incidence and death rates for all can- cers combined and for the leading cancer types by sex, race, and
  • 2. ethnicity were estimated by joinpoint analysis and expressed as the annual percent change. Stage distribution and 5-year survival by stage at diagnosis were calculated for breast cancer, colon and rec- tum (colorectal) cancer, lung and bronchus cancer, and melanoma of the skin. RESULTS: Overall cancer incidence rates from 2008 to 2014 decreased by 2.2% per year among men but were stable among women. Overall cancer death rates from 1999 to 2015 decreased by 1.8% per year among men and by 1.4% per year among women. Among men, incidence rates during the most recent 5- year period (2010-2014) decreased for 7 of the 17 most common cancer types, and death rates (2011-2015) decreased for 11 of the 18 most common types. Among women, incidence rates declined for 7 of the 18 most common cancers, and death rates declined for 14 of the 20 most common cancers. Death rates decreased for cancer sites, including lung and bronchus (men and women), colorectal (men and women), female breast, and prostate. Death rates increased for cancers of the liver (men and women); pancreas (men and women); brain and other nervous system (men and women); oral cavity and pharynx (men only); soft tissue, including heart (men
  • 3. only); nonmelanoma skin (men only); and uterus. Incidence and death rates were higher among men than among women for all racial and ethnic groups. For all cancer sites combined, black men and white women had the highest incidence rates compared with other racial groups, and black men and black women had the highest death rates compared with other racial groups. Non-Hispanic men and women had higher incidence and mortality rates than those of Hispanic ethnicity. Five-year survival for cases diagnosed from 2007 through 2013 ranged from 100% (stage I) to 26.5% (stage IV) for female breast cancer, from 88.1% (stage I) to 12.6% (stage IV) for colorectal cancer, from 55.1% (stage I) to 4.2% (stage IV) for lung and bronchus cancer, and from 99.5% (stage I) to 16% (stage IV) for melanoma of the skin. Among children, overall cancer incidence rates increased by 0.8% per year from 2010 to 2014, and overall cancer death rates decreased by 1.5% per year from 2011 to 2015. CONCLUSIONS: For all cancer sites combined, cancer incidence rates decreased among men but were stable among women. Overall, there continue to be significant declines in cancer death rates
  • 4. among both men and women. Differences in rates and trends by race and ethnic group remain. Progress in reducing cancer mortality has not occurred for all sites. Examining stage distribution and 5-year survival by stage highlights the potential benefits associated with early detection and treatment. Cancer 2018;124:2785-800. VC 2018 The Authors. Cancer published by Wiley Periodicals, Inc. on behalf of American Cancer Society. This is an open access article under the terms of the Creative Commons Attribution- NonCommercial License, which permits use, distribution and reproduction in any medium, provided the original work is properly cited and is not used for commercial purposes. KEYWORDS: Annual Report to the Nation, cancer, incidence, mortality, National Program of Cancer Registries (NPCR), National Vital Statistics System (NVSS), North American Association of Central Cancer Registries (NAACCR), Surveillance, Epidemiology, and End Results (SEER), survival, trends. Corresponding author: Kathleen A. Cronin, PhD, MPH, Division of Cancer Control and Population Sciences, National Cancer Institute, 9609 Medical Center Drive,
  • 5. Room 4E454, Bethesda, MD 20892-9765; [email protected] 1 Division of Cancer Control and Population Sciences, National Cancer Institute, Bethesda, Maryland; 2 Information Management Services, Inc., Rockville, Maryland; 3 North American Association of Central Cancer Registries, Springfield, Illinois; 4 Division of Cancer Prevention and Control, National Center for Chronic Disease Pre- vention and Health Promotion, Centers for Disease Control and Prevention, Atlanta, Georgia; 5National Center for Health Statistics, Centers for Disease Control and Prevention, Hyattsville, Maryland; 6 Surveillance and Health Services Research, American Cancer Society, Atlanta, Georgia See companion article on pages 2801-14, this issue. This article has been contributed to by US Government employees, and their work is in the public domain in the United States. We gratefully acknowledge the contributions of the state and regional cancer registry staff for their work in collecting the data used in this report. In addition, we thank Daniel Miller, Joe Zou, and Steve Scoppa of
  • 6. Information Management Services, Inc., for assistance in compiling the data used in this report. We thank Alyssa Wang, MPH, for assistance with preparation of the graphics and Trish Murphy, MS, for editorial assistance. The findings and conclusions in this article are those of the authors and do not necessarily represent the official positions of the author’s agencies (the Centers for Disease Control and Prevention, the National Cancer Institute, the American Cancer Society, or the North American Association of Central Cancer Registries). DOI: 10.1002/cncr.31551, Received: March 22, 2018; Revised: April 23, 2018; Accepted: April 26, 2018, Published online May 22, 2018 in Wiley Online Library (wileyonlinelibrary.com) Cancer July 1, 2018 2785 Original Article http://orcid.org/0000-0001-5881-8313 http://orcid.org/0000-0002-0000-4111 http://crossmark.crossref.org/dialog/?doi=10.1002%2Fcncr.3155 1&domain=pdf&date_stamp=2018-05-22 INTRODUCTION The American Cancer Society (ACS), Centers for Disease Control and Prevention (CDC), National Cancer Insti- tute (NCI), and North American Association of Central Cancer Registries (NAACCR) have collaborated annually since 1998 to provide updates on cancer incidence and mortality patterns in the United States.1-19 This report
  • 7. uses a single database to estimate delay-adjusted incidence to monitor population-based cancer trends. In addition to reporting on incidence and mortality trends overall and for common cancer sites, this year’s report highlights 4 cancer sites (female breast, colon and rectum [colorectal], lung and bronchus, and melanoma of the skin) by pre- senting the percentage of cases by stage at diagnosis and 5- year survival estimates by stage at diagnosis. MATERIALS AND METHODS Data Sources Cancer incidence data Population-based cancer incidence data by age, sex, and race/ethnicity were obtained from 42 state registries that participate in the CDC’s National Program of Cancer Registries (NPCR) and/or the NCI’s Surveillance, Epi- demiology, and End Results (SEER) Program. The data satisfied the NAACCR’s data quality criteria and repre- sented cases diagnosed from 1999 through 2014,20 cover- ing 89% of the US population. Information on incident cases came primarily from the abstracts of inpatient and outpatient medical records but also from a variety of other sources, including pathology reports and death certifi- cates. This database of 42 registries was used to derive all incidence statistics presented in this report. Anatomic site and histology were coded according to the International Classification of Diseases for Oncol- ogy (ICD-O) edition in use at the time of diagnosis and were converted to the third edition (ICD-O-3) coding21 and categorized according to SEER site groups.22 Only cases defined as malignant under ICD-O-2 and ICD-O-3 were included in this report, with the exception of bladder
  • 8. cancer. In situ and malignant cancers were combined when reporting bladder cancer incidence rates. All case counts and rates were adjusted for delay in reporting.23 After adjusting for reporting delay, the 5-year fixed inter- val incidence rates are based on 3.6 million male cases and 3.5 million female cases diagnosed between 2010 and 2014. Cancer mortality data Although cancer incidence data were available through 2014, an additional year of data was available for analysis of mortality. Cause of death by age, sex, and race/ethnicity (1999-2015) came from the National Vital Statistics Sys- tem and was based on death certificate information reported to state vital statistics offices and compiled into a national file covering all states in the United States by the National Center for Health Statistics (NCHS).24 Catego- rization methods for cause of death have been described in previous reports.19 Race/ethnicity data In this report, information on race and ethnicity was based on medical records for incidence or death certifi- cates from the NCHS for mortality. Race was categorized as white, black, Asian/Pacific Islander (API), and Ameri- can Indian/Alaska Native (AI/AN). Race information for AI/AN, however, was considered reliable only for geo- graphic areas covered by the Indian Health Service Con- tract Health Service Delivery Areas (CHSDA)10,25,26; therefore, incidence and mortality data for AI/AN were based only on these areas. Overall, 83% of the AI/AN population lived in CHSDA areas between the years 2010
  • 9. and 2014. This percentage varied by geographic area, with 100% or close to 100% of the AI/AN population liv- ing in CHSDA areas in Alaska, the Pacific Coast, the Southern Plains, and the East; 67% living in the Northern Plains; and 60% living in the Southwest. Hispanic ethnic- ity included individuals from all races identified as His- panic. Although the accuracy of race and ethnicity reporting has improved over time, recent studies have demonstrated that reporting of race in medical records remains less accurate for API, Hispanic, and AIs/ANs than for whites and blacks.27,28 We present incidence and mortality data separately by race and by Hispanic ethnic- ity. The number of cases included in the 5-year incidence rate calculation ranged from 12,000 male and 13,500 female AIs/ANs residing in CHSDA areas to almost 3 million white men and women. Population data The population estimates used as the denominators to cal- culate incidence and death rates were a modification of the intercensal and Vintage 2015 annual times series of July 1, county population estimates by age, sex, race, and Hispanic origin produced by the US Census Bureau’s Population Estimates Program in collaboration with the NCHS and with support from the NCI.29 The estimates incorporate intercensal (for July 1, 2000-2009) and Vin- tage 2015 (for July 1, 2010-2015) bridged, single-race estimates that are derived from the original multiple-race categories in the 2000 and 2010 Censuses, as specified in Original Article 2786 Cancer July 1, 2018
  • 10. the 1997 Office of Management and Budget standards for the collection of data on race and ethnicity.30,31 Some additional adjustments were made to refine the July 1 population estimates, as with previous reports.19 Survival data Estimates for 5-year relative survival were calculated for cases diagnosed from 2007 through 2013. We used 34 central cancer registries (33 states and 1 metropolitan area, referenced hereafter as states) compiled by the NAACCR (covering 70% of the US population) to examine survival differences by sex and cancer stage at diagnosis for cancers of the lung and bronchus, breast, colon and rectum, and melanoma of the skin.32 These 34 states were considered to have sufficient vital status follow-up to conduct survival analyses, because they either conducted recent National Death Index linkages or they routinely conduct active vital status follow-up of all cases.33 Cancers that were identified by death certifi- cate or autopsy only were excluded from the survival analysis, as were patients who died so soon after diagno- sis that their survival time was not measurable. The first site-specific cancer of the analysis period (2007-2013) was used in the analysis. Patients were followed for vital status through December 31, 2013, because not all regis- tries had complete information on vital status through December 31, 2014.
  • 11. Statistical Methods Cancer incidence and death rates and trends Cross-sectional incidence (2010-2014) and death (2011- 2015) rates for all ages combined were calculated for all cancer sites combined and for the most common cancer sites by sex, race, and ethnicity. These rates were calcu- lated with their 95% confidence intervals using SEER*- Stat software, version 8.3.4.34,35 Incidence rates were adjusted for delay in reporting.36 Similarly, we calculated overall cancer incidence and death rates for children (ages 0-14 years). All rates were age-standardized to the 2000 US standard population and were expressed per 100,000 persons.34 Rates based on fewer than 16 cases were deemed to be statistically unstable and were suppressed. Temporal trends in age-standardized, delay-adjusted cancer incidence (1999-2014) and death (1999-2015) rates were estimated using joinpoint regression,37,38 with a maximum of 2 joinpoints (3 line segments) allowed in each model for incidence and 3 joinpoints (4 line seg- ments) allowed in each model for mortality. The maxi- mum number of joinpoints is based on the number of data points in the series.39 The resultant trends were described by the annual percent change (APC). The 5- year average APCs (AAPCs) for 2010 through 2014 (inci- dence) and for 2011 through 2015 (mortality) were calcu- lated using a weighted average of the slope coefficients of the underlying joinpoint regression line, with the weights equal to the length of each segment over the interval. The AAPC was equal to the APC when the AAPC was entirely within the last joinpoint segment.40 Two-sided statistical
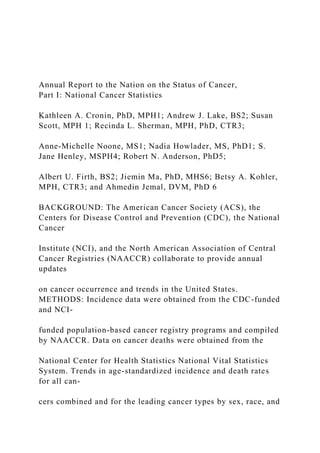
  • 12. significance (P < .05) for the APC and the AAPC was determined using a t test for the APC and for the AAPC when it lay entirely within the last joinpoint segment; and a Z test was used when the AAPC extended beyond the last joinpoint segment.39 In describing trends, the terms increase and decrease are used when the slope of the trend (APC or AAPC) was statistically significant; otherwise, the term stable is used. Trends based on fewer than 10 cases in any of the data years (1999-2014 for incidence and 1999-2015 for mor- tality) were considered statistically unstable and were suppressed. RESULTS Cancer Incidence Rates for All Sites Combined and for the Most Common Cancers Figure 1 illustrates trends from 1999 to 2014 in age- standardized, delay-adjusted incidence rates for all cancer sites combined among men and among women. Incidence rates among men decreased throughout the study period, with the decrease accelerating from 0.6% (on average) per year during 1999 to 2008 to 2.2% (on average) per year during 2008 to 2014. In contrast, over the same 15-year period, incidence rates among women were stable. Figure 2 presents average annual incidence rates and 5-year AAPCs (2010-2014) for the 17 most common can- cers among men and the 18 most common cancers among women. Among men, incidence rates decreased for 7 of the 17 most common cancers: prostate (5-year AAPC, 27.6%), lung and bronchus (22.4%), colon and rec- tum (colorectal) (21.9%), urinary bladder (bladder) (20.8%), esophagus (21.6%), brain and other nervous
  • 13. system (20.2%), and larynx (22.3%) (Table 1 and Fig. 2). In contrast, incidence rates among men increased for 8 cancers: melanoma of the skin (5-year AAPC, 2.3%), kidney and renal pelvis (kidney) (1.1%), leukemia (1.6%), oral cavity and pharynx (1.3%), pancreas (1.0%), liver and intrahepatic bile duct (liver) (2.8%), myeloma (2.5%), and thyroid (2.4%). Incidence rates were stable for non-Hodgkin lymphoma (NHL) and stomach cancer. Among women, incidence rates decreased for 7 of the 18 most common cancers: lung and bronchus (5-year Annual Report National Cancer Statistics/Cronin et al Cancer July 1, 2018 2787 AAPC, 21.2%), colorectal (21.7%), NHL (20.4%), ovary (21.6%), bladder (20.8%), cervix uteri (cervix) (21.0%), and brain and other nervous system (20.7%). However, incidence rates increased for 10 cancers: breast (0.4%), corpus and uterus not otherwise specified (uterus) (1.2%), thyroid (1.9%), melanoma of the skin (1.2%), leukemia (1.4%), kidney (0.4%), pancreas (1.1%), oral cavity and pharynx (0.8%), myeloma (1.6%), and liver (3.8%). Incidence rates remained unchanged for stomach cancer (Table 1 and Fig. 2). Liver cancer replaced thyroid cancer as the most rapidly increasing incident cancer among women. For most cancer sites, the increasing or decreasing trends from 2010 to 2014 among men and among women were continuations of past trends (Sup- porting Table 1). At the end of this Results section, incidence and mortality trends for female breast cancer, colorectal can-
  • 14. cer, lung and bronchus cancer, and melanoma of the skin are discussed in greater detail—along with stage at diagnosis and survival by stage. Prostate cancer inci- dence and mortality are examined in detail in Part II of this report. Cancer Death Rates for All Sites Combined and for the Most Common Cancers Figure 1 illustrates trends in death rates from 1999 to 2015 for all cancer sites combined, by sex. Death rates decreased during this period by 1.8% on average per year among men and by 1.4% on average per year among women. Figure 3 presents average annual death rates and 5- year AAPCs (2011-2015) for the 18 most common can- cers among men and the 20 most common cancers among women. Among men, death rates during this period decreased for 11 of the 18 cancers: lung and bronchus (5- year AAPC, 23.8%), prostate (22.2%), colorectal (22.5%), leukemia (22.2%), NHL (22.0%), esophagus (21.1%), kidney (20.5%), stomach (21.6%), myeloma (20.9%), melanoma of the skin (23.0%), and larynx
  • 15. (22.5%). In contrast, death rates among men increased for cancers of the pancreas (0.2%), liver (1.6%), brain and other nervous system (0.5%), oral cavity and pharynx (1.0%), nonmelanoma skin (2.8%), and soft tissue (including heart) (0.8%). The death rate among men was stable for bladder cancer (Fig. 3 and Table 2). Figure 1. Trends in age-standardized incidence (1999-2014) and mortality rates (1999-2015) are illustrated for all cancer sites combined, all races/ethnicities combined, and by sex. An asterisk indicates that the annual percent change (APC) or the average APC (AAPC) is statistically significantly different from zero (2-sided t test; P <.05). UNK indicates unknown. Rates were age- standardized to the 2000 US standard population (19 age groups; Bureau of the Census. Current Population Reports, Publication 25-1130. Washington, DC: US Government Printing Office; 2000 [Census 25-1130]). Scattered points indicate observed rates, and lines are fitted rates according to joinpoint regression. Incidence rates were delay-adjusted and covered 89% of the US popula- tion, and mortality covered the entire United States. The following registries were included for incidence: Alabama, Alaska, Ari- zona, Arkansas, California, Colorado, Connecticut, Delaware, Florida, Georgia, Hawaii, Idaho, Illinois, Indiana, Iowa, Kentucky, Louisiana, Maine, Maryland, Massachusetts, Michigan,
  • 16. Missouri, Montana, Nebraska, New Hampshire, New Jersey, New York, North Carolina, North Dakota, Ohio, Oklahoma, Oregon, Pennsylvania, Rhode Island, South Carolina, Texas, Utah, Vermont, Washington, West Virginia, Wisconsin, and Wyoming. The AAPC is a weighted average of the APCs over the fixed interval (2010- 2014 for inci- dence; 2011-2015 for mortality) using the underlying Joinpoint model for the period from 1999 to 2014 for incidence and the period from 1999 to 2015 for mortality. Joinpoint models with up to 2 joinpoints for incidence and up to 3 joinpoints for mortality are based on rates per 100,000 persons age standardized to the 2000 US standard population (19 age groups; Census P25- 1130). For joinpoint analysis, the Joinpoint Regression Program was used (version 4.5.01; Bethesda, MD: Statistical Research and Applications Branch, National Cancer Institute; June 2017). Original Article 2788 Cancer July 1, 2018 Among women, during the same time period, death rates decreased for 14 of the 20 most common cancer types: lung and bronchus (5-year AAPC, 22.4%), breast (21.6%), colorectal (22.7%), ovary (22.3%), leukemia (22.3%), NHL (22.7%), kidney (21.4%), stomach (21.8%), cervix (20.7%), bladder (20.5%), melanoma of the skin (22.6%), esophagus (21.6%), oral cavity and pharynx (21.3%), and gallbladder (21.3%) (Fig. 3 and Table 2). In contrast, death rates among women increased
  • 17. for cancers of the pancreas (0.2%), uterus (1.9%), liver (2.7%), and brain and other nervous system (0.5%). Death rates among women were stable for myeloma and soft tissue (including heart). Like the incidence trends, increases or decreases in death rates for most cancers among men and women were continuations of past trends (Supporting Table 2). Current Cancer Incidence Rates and Trends by Sex, Race, and Ethnicity Table 1 lists average annual age-standardized, delay- adjusted incidence rates and trends for the most recent 5- year period (2010-2014) by cancer site, sex, race, and eth- nicity. For all cancer sites combined, rates were higher among men than among women overall (all races/ethnici- ties combined; 502.0 vs 420.6 per 100,000 persons) and among persons in every racial/ethnic group. Black men and white women had higher overall cancer incidence rates than other racial groups. Non-Hispanic men and women had higher incidence rates than those of Hispanic ethnicity. API men and API women had the lowest rates relative to other racial and ethnic groups. In every racial and ethnic group, prostate cancer among men and breast cancer among women were the most frequent incident cancers, followed by lung and bronchus cancer, and colo- rectal cancer, except among Hispanics. Among Hispanic men and Hispanic women, colorectal cancer was more frequent than lung and bronchus cancer. Rankings for several other cancers varied substantially by race and eth- nicity among both men and women. Among men, for example, melanoma of the skin ranked fifth in whites and 19th in blacks; and liver cancer ranked 11th in whites, sixth in blacks, and fourth in APIs. Among men in each racial/ethnic group, incidence
  • 18. trends during 2010 to 2014 for all cancer sites combined and for each of the 17 most common cancers were gener- ally similar in direction (decrease or increase) to those for all races/ethnicities combined (Table 1). Incidence rates among men in each racial and ethnic group decreased for all cancers combined and for each of the 3 most common cancers (prostate, lung and bronchus, colorectal), except that the rate was stable for lung and bronchus cancer among AIs/ANs. Rates also decreased among men in each racial/ethnic group for cancers of the bladder, stomach, Figure 2. Age-standardized, delay-adjusted incidence rates and recent trends (2010-2014) are illustrated for the 17 most common cancers in men and the 18 most common cancers in women for all races/ethnicities combined and by sex. The 5- year average annual percent change (AAPC) is based on the joinpoint trend from 1999 to 2014. An asterisk indicates that the AAPC is statistically significantly different from zero (2- sided t test or Z test; P <.05). Rates were age-standardized to the 2000 US standard population (19 age groups; Census P25- 1130), were delay-adjusted, and covered 89% of the US popula- tion. The following registries were included in the analyses: Ala- bama, Alaska, Arizona, Arkansas, California, Colorado, Connecticut, Delaware, Florida, Georgia, Hawaii, Idaho, Illinois, Indiana, Iowa, Kentucky, Louisiana, Maine, Maryland, Massachu- setts, Michigan, Missouri, Montana, Nebraska, New Hampshire, New Jersey, New York, North Carolina, North Dakota, Ohio, Oklahoma, Oregon, Pennsylvania, Rhode Island, South Caro- lina, Texas, Utah, Vermont, Washington, West Virginia, Wiscon- sin, and Wyoming. The AAPC is a weighted average of the annual percent changes (APCs) over the fixed interval (2010- 2014) using the underlying joinpoint model for the period from
  • 19. 1999 to 2014. Joinpoint models with up to 2 joinpoints are based on rates per 100,000 persons age standardized to the 2000 US standard population (19 age groups; Census P25- 1130). For joinpoint analysis, the Joinpoint Regression Program was used (version 4.5.0.1; Bethesda, MD: Statistical Research and Applications Branch, National Cancer Institute; June 2017). Annual Report National Cancer Statistics/Cronin et al Cancer July 1, 2018 2789 T A B L E 1. A g e -S ta n d a rd iz
  • 80. 2 0 .3 .1 3 … Brisia Rivera Cultural Immersion April 27, 2020 Introduction: I am merging my Global and Cultural Studies major with the The Latina Love Movement internship both my research and resources will exemplify and discuss woman’s empowerment in the business corporate cultural atmosphere. (topic)In a world of gender imbalance women in business is a form of empowerment. Body: As countries all over the world continue to participate in the global market, the Latina Love Movement has shed light on: Job Segregation •
  • 81. • Women Absent on Corporation Boards • • Women Under Represented in Business Education • • Conclusion: • Organizations are more successful as they leverage innovation and multiple viewpoints, and are more reflective of their actual customers • Effective ways to change minds and provoke action. That’s why pairing up women with strong female role models is one of the many ways to empower your employees to succeed in both your company and their industries. • Women are to be respected for who they are, their unique perspective, skills, dedication, and strong work ethic. How does this relate to Woman’s empowerment? 1. JOB SEGREGATION 2. WOMEN ABSENT ON CORPORATE BOARDS 3. WOMEN UNDERREPRESENTED IN BUSSINESS EDUCATION What culture are you being immersed in?
  • 82. BUSSINESS ARENA 1. Culture of Diversity, 2. Culture on inclusion, and 3. Culture of fairness Topic: A professional setting to discuss your business’s stance on women’s equality in the workplace Note: Incorporate Women’s Empowerment though business with statical sociological data. Highlight the Economic benefits of women in the work force in the U.S. and compare it to countries where women are academically and professionally limited lunch as middle Eastern countries any country with limited female rights Provide an overview of the Hindu religion with an emphasis on the chakras and reflect on how the full synchronization of the mind body and soul are vital to your proffessional pdevelopment progress and development. JOB SEGREGATION WOMEN ABSENT ON CORPORATE BOARDS WOMEN UNDERREPRESENTED IN BUSSINESS EDUCATION With 7 out of 10 women age 25 to 54 in the labor force today, women make up nearly half of all paid workers. Women now comprise 45.4% of employed workers, compared to 38% in 1970. Roughly two-thirds of all new entrants in the workforce from now through the year 1100 will be
  • 83. women, and the labor force participation rates of women will reach over 80% by 1995. Yet, women continue to be highly segregated in the workforce. Ninety-nine percent of secretaries are women, as are 93% of bookkeepers, 93% of nurses, and 82% of administrative/clerical support workers. Women are the majority of textile workers (91%) and housekeepers (82%). Job segregation translates into lower earnings for women. Full- time employed women still earn considerably less than men. The average man with a high school education working full- time earns more than the average woman fulltime worker with a college degree, and the situation is even worse for African-American, Asian-American, and Latina women. Although women comprise 40% of all executive, management, and administrative positions (up from 24% in 1976), they remain confined mostly to the middle and lower ranks, and the senior levels of management are almost exclusively male domains. A 1990 study of the top Fortune 500 companies by Mary Ann Von Glinow of the University of Southern California, showed that women were only 2.6% of corporate officers (the vice presidential level up). Of the Fortune Service 500, only 4.3% of corporate officers were women -- even though women are 61% of all service workers. More shocking is that these numbers have shown very little improvement in the 25 years that these statistics have been tracked (University of Michigan, Korn/Ferry International). This means that at the current rate of increase, it will be 475 years - or not until the year 2466 before women
  • 84. reach equality with men in the executive suite. Women Absent on Corporate Boards The story is not much better on corporate boards:only 4.5% of the Fortune 500 industrial directorships are held by women. On Fortune Service 500 companies, 5.6% of corporate directors are women. The rate of increase is so slow that parity with men on corporate board will not be achieved until the year 2116 - or for 125 years. Recently published studies purport to show that women are making significant gains on corporate boards: a 1988 Korn/Ferry survey reported that 52.8% of major U.S. corporations had women board members, up from the 42.9% in 1986. But only 25% of the Fortune 1000 companies in 1986 had more than one woman on their board, according to the Wall Street Journal. In fact, there is such a huge overlap among women sitting on corporate boards, that just 39 directors account for 33% of the 652 Fortune 1000 directorships held by women. In 1980, only one woman held the rank of CEO of a Fortune 500* company. She came into the top management by inheriting the company from her father and husband. In 1985, this executive was joined by a second woman who reached the top - by founding the company she headed. Today, there is again only one woman at the top of a Fortune 500 company. For African-American, Asian-American and Latina women, the situation at the top is even worse. A 1986 survey by the Equal Employment Opportunity Commission (as reported in Morrison and
  • 85. Von Glinow) showed that between 1974 and 1984, the percentage of African-American women executives grew at a snail's pace of 0.7% of the total, to 1.7%. By comparison, African-American and Latina women constitute about 7% of the total workforce. The pay gap exists even at the executive level: a May 1987 report by Nation's Business showed that "women at the vice-presidential levels and above earn 42% less than their male peers." According to a 1984 Wall Street Journal/Gallup poll, 70% of executive women believe they are "paid less than men of equal ability." Women Under-Represented in Business Education Women have done somewhat better in gaining access to a business education: in 1970, women comprised 3.5% of all MBA graduates; whereas in 1989, 33.6% of the MBA graduates were women. Women received 46.7% of all bachelors degrees in business yet only 26.6% of the doctorates. At the most prestigious business graduate schools - Harvard, Columbia, Mihigan, M.I.T. - women make up a smaller percentage of the student body. Despite the changes in the student body, the faculty and administration of business schools remain predominantly white and male, not unlike corporate management where women are grossly under-represented. Women account for only 4% of business school deans and there are no women presidents. *Note: The Fortune 500 represents the largest industrial corporations. The Fortune Service 500 is separate listing including only the service industries such as retailing, banking, insurance, and finance.