The Rise of Enterprise Data Stories in Data Visualization by Erik Laurijssen (Datylon) at #BIDASUMMIT #dataviz
•
0 gefällt mir•111 views

Presentation by Erik Laurijssen (CEO, Datylon): "The Rise of Data Stories in the Enterprise for Data Visualization" at the BI & Data Analytics Summit on June 13th in Diegem (Belgium)

Empfohlen
Empfohlen
Weitere ähnliche Inhalte
Was ist angesagt?
Was ist angesagt? (20)
Ähnlich wie The Rise of Enterprise Data Stories in Data Visualization by Erik Laurijssen (Datylon) at #BIDASUMMIT #dataviz
Ähnlich wie The Rise of Enterprise Data Stories in Data Visualization by Erik Laurijssen (Datylon) at #BIDASUMMIT #dataviz (20)
Mehr von Patrick Van Renterghem
Mehr von Patrick Van Renterghem (20)
Kürzlich hochgeladen
Kürzlich hochgeladen (20)
The Rise of Enterprise Data Stories in Data Visualization by Erik Laurijssen (Datylon) at #BIDASUMMIT #dataviz
- 2. 6/18/19 2
- 3. 6/18/19 3
- 4. 6/18/19 4
- 5. 6/18/19 5 17.000 YEARS AGO 4.300 YEARS AGO 2.700 YEARS AGO TELLING STORIES WITH IMAGES WORDS DATA
- 6. 6/18/19 6
- 7. 6/18/19 7
- 8. 6/18/19 8
- 9. 6/18/19 9
- 10. 6/18/19 10
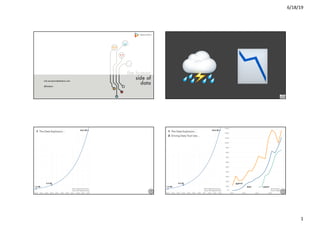
- 11. 6/18/19 11 Amount of data Amount of people Understand ProcessGather Insights Information Producers Information Consumers From data exploration… Amount of data Amount of people Understand ProcessGather Visualize CommunicateInsights Information Producers Information Consumers From data exploration to data communication Value From data … Narrative Visuals Data Explain Narrative Visuals Data Engage Narrative Visuals Data Enlighten
- 12. 6/18/19 12 INFLUENCE Tell a Story Draw Attention PERSUADE Show benefits that cover needs and trigger engagement CALL TO ACTION Show concrete steps PUTTING INFORMATION INTO CIRCULATION Transparency Dialogues INFLUENCE Tell a Story Draw Attention PERSUADE Show benefits that cover needs and trigger engagement CALL TO ACTION Show concrete steps PUTTING INFORMATION INTO CIRCULATION Transparency Dialogues INFLUENCE Tell a Story Draw Attention PERSUADE Show benefits that cover needs and trigger engagement CALL TO ACTION Show concrete steps PUTTING INFORMATION INTO CIRCULATION Transparency Dialogues INFLUENCE Tell a Story Draw Attention PERSUADE Show benefits that cover needs and trigger engagement CALL TO ACTION Show concrete steps PUTTING INFORMATION INTO CIRCULATION Transparency Dialogues
- 13. 6/18/19 13 PERSUADE Show benefits that cover needs and trigger engagement CALL TO ACTION Show concrete steps PUTTING INFORMATION INTO CIRCULATION Transparency Dialogues INFLUENCE Tell a Story Draw Attention EngageEngage
- 14. 6/18/19 14 Mobile Phone users generate data … … by using their phone for texting, calling & surfing. Data can deliver location insights … … as every user action is coupled to the users location. This is Big Data This is Analytics Location Insights Platform Customer: Proximus Sector: Telco Producer: Datylon Tool: Custom built Application: Proximus MyAnalytics Helps companies and organizations to understand people flows, movements & attendance to attract more business & improve service Parade Red Devils in Brussels Location Insights Platform Customer: Proximus Sector: Telco Producer: Datylon Tool: Custom built Application: Proximus MyAnalytics Helps companies and organizations to understand people flows, movements & attendance to attract more business & improve service Parade Red Devils in Brussels
- 15. 6/18/19 15 Real-Time Crowd Management Challenges • Shorten lag time for location insight • Input data: antenna location and mobile phone connection time stamps • Every minute location data of 5Mmobile phones in a GDPR safe way • Target users are no data scientists Solution • Real-Time Crowd Management dashboards • Thresholds and alerts (upcoming) IoT Platform Customer: CMC Sector: Industry. Manufacturer of air compressor controllers. Producer: Datylon Tool: Custom built Application: IoT platform helping service organizations maintain hundreds of thousands of compressors worldwide. Reporting: Use human centric explanatory dataviz to give every stakeholder the right insights Reports-as-a-Service Challenges • Monitoring worldwide media coverage is part of NATO’s defense strategy • Articles on 30.000 news sites together with video’s on youtube and content on twitter are daily scanned, filtered segmented and analyzed together with Datylon partners • Target users are NATO analysts and Generals during NATO operations Solution • Reports-as-a-Service • Media Coverage Data Stories are created on demand and distributed to the right audience
- 16. 6/18/19 16 Mobility Insights Customer: Ringland Academie and Straten vol Leuven, in cooperation with KU Leuven & Universiteit Antwerpen Sector: Environment Producer: Datylon Tool: Custom built Application: straatvinken.be Report on traffic survey conducted by thousands of city inhabitants. Objective is to create awareness about traffic in the city and stimulate the use of clean transport. We design, develop, host and support solutions that make data more actionable • Help enterprises become more data-driven • Make it easier to communicate (big) data insights with a focus on actions • Using explanatory dataviz to reach more people