Suche senden
Hochladen
Rainfall Forecasting : A Regression Case Study
•
0 gefällt mir
•
142 views
IRJET Journal
Folgen
https://irjet.net/archives/V4/i8/IRJET-V4I8399.pdf
Weniger lesen
Mehr lesen
Ingenieurwesen
Melden
Teilen
Melden
Teilen
1 von 4
Jetzt herunterladen
Downloaden Sie, um offline zu lesen
Empfohlen
Time Series Least Square Forecasting Analysis and Evaluation for Natural Gas ...
rahulmonikasharma
Short Term Load Forecasting Using ARIMA Technique
rahulmonikasharma
IRJET - Analysis of Crop Yield Prediction by using Machine Learning Algorithms
IRJET Journal
Analysis of crop yield prediction using data mining techniques
eSAT Journals
IRJET- Agricultural Crop Yield Prediction using Deep Learning Approach
IRJET Journal
IRJET- Smart Farming Crop Yield Prediction using Machine Learning
IRJET Journal
IRJET- Analysis of Crop Yield Prediction using Data Mining Technique to Predi...
IRJET Journal
Predicting Agricultural Products Volume With APC ERP Data
QUESTJOURNAL
Multiple imputation for hydrological missing data by using a regression metho...
eSAT Journals
Data wrangling IN R LANGUAGE
LOVELY PROFESSIONAL UNIVERSITY
Scatter diagram and control chart
nithyanithi26
Crop predction ppt using ANN
Astha Jain
Data Warehousing and Business Intelligence Project on Smart Agriculture and M...
Kaushik Rajan
Portfolio Three
Portfolio Three
Chris Worledge
Analysis of Crime Big Data using MapReduce
Kaushik Rajan
March 2, 2018 - Machine Learning for Production Forecasting
David Fulford
Portfolio3
Portfolio3
Chris Worledge
Scatter Diagram
Scatter Diagram
Sun Technologies
Data summary metrics
Mandar Gadre
Scatter plot- Complete
Irfan Yaqoob
GurminderBharani_Masters_Thesis
bharanigurminder
Data Configuration for Analysis with Matt Hansen at StatStuff
Matt Hansen
Advanced Excel Features with Matt Hansen at StatStuff
Matt Hansen
Graphs, pareto
Graphs, pareto
nithyanithi26
Business Analytics Foundation with R Tools - Part 3
Beamsync
IRJET-Analysis of Storm Water Drain in 1410 Acres, Palasamudram Site
IRJET Journal
A Comparative Study for Anomaly Detection in Data Mining
IRJET Journal
IRJET- Analysis of Crucial Oil Gas and Liquid Sensor Statistics and Productio...
IRJET Journal
IRJET- Rainfall Prediction by using Time-Series Data in Analysis of Artif...
IRJET Journal
IRJET- Estimation of Water Level Variations in Dams Based on Rainfall Dat...
IRJET Journal
Weitere ähnliche Inhalte
Was ist angesagt?
Multiple imputation for hydrological missing data by using a regression metho...
eSAT Journals
Data wrangling IN R LANGUAGE
LOVELY PROFESSIONAL UNIVERSITY
Scatter diagram and control chart
nithyanithi26
Crop predction ppt using ANN
Astha Jain
Data Warehousing and Business Intelligence Project on Smart Agriculture and M...
Kaushik Rajan
Portfolio Three
Portfolio Three
Chris Worledge
Analysis of Crime Big Data using MapReduce
Kaushik Rajan
March 2, 2018 - Machine Learning for Production Forecasting
David Fulford
Portfolio3
Portfolio3
Chris Worledge
Scatter Diagram
Scatter Diagram
Sun Technologies
Data summary metrics
Mandar Gadre
Scatter plot- Complete
Irfan Yaqoob
GurminderBharani_Masters_Thesis
bharanigurminder
Data Configuration for Analysis with Matt Hansen at StatStuff
Matt Hansen
Advanced Excel Features with Matt Hansen at StatStuff
Matt Hansen
Graphs, pareto
Graphs, pareto
nithyanithi26
Business Analytics Foundation with R Tools - Part 3
Beamsync
Was ist angesagt?
(17)
Multiple imputation for hydrological missing data by using a regression metho...
Data wrangling IN R LANGUAGE
Scatter diagram and control chart
Crop predction ppt using ANN
Data Warehousing and Business Intelligence Project on Smart Agriculture and M...
Portfolio Three
Portfolio Three
Analysis of Crime Big Data using MapReduce
March 2, 2018 - Machine Learning for Production Forecasting
Portfolio3
Portfolio3
Scatter Diagram
Scatter Diagram
Data summary metrics
Scatter plot- Complete
GurminderBharani_Masters_Thesis
Data Configuration for Analysis with Matt Hansen at StatStuff
Advanced Excel Features with Matt Hansen at StatStuff
Graphs, pareto
Graphs, pareto
Business Analytics Foundation with R Tools - Part 3
Ähnlich wie Rainfall Forecasting : A Regression Case Study
IRJET-Analysis of Storm Water Drain in 1410 Acres, Palasamudram Site
IRJET Journal
A Comparative Study for Anomaly Detection in Data Mining
IRJET Journal
IRJET- Analysis of Crucial Oil Gas and Liquid Sensor Statistics and Productio...
IRJET Journal
IRJET- Rainfall Prediction by using Time-Series Data in Analysis of Artif...
IRJET Journal
IRJET- Estimation of Water Level Variations in Dams Based on Rainfall Dat...
IRJET Journal
ANALYSIS AND PREDICTION OF RAINFALL USING MACHINE LEARNING TECHNIQUES
IRJET Journal
IRJET- Probability based Missing Value Imputation Method and its Analysis
IRJET Journal
IRJET- Rainfall Forecasting using Regression Techniques
IRJET Journal
Linear Regressions of Predicting Rainfall over Kalay Region
ijtsrd
Data Analysis for Solar Energy Generation in a University Microgrid
IJECEIAES
IRJET- Analyze Weather Condition using Machine Learning Algorithms
IRJET Journal
Integrated Water Resources Management Using Rainfall Forecasting With Artific...
IRJET Journal
Graphical Analysis of Simulated Financial Data Using R
IRJET Journal
MFBLP Method Forecast for Regional Load Demand System
CSCJournals
IEOR 265 Final Paper_Minchao Lin
Minchao Lin
IRJET- Indian Water Pollution Monitoring and Forecasting for Anomaly with...
IRJET Journal
IRJET- Agricultural Crop Classification Models in Data Mining Techniques
IRJET Journal
IRJET- Supervised Learning Classification Algorithms Comparison
IRJET Journal
IRJET- Supervised Learning Classification Algorithms Comparison
IRJET Journal
Ground measured data vs meteo data sets:57 locations in India_01.01.2020
Gensol Engineering Limited
Ähnlich wie Rainfall Forecasting : A Regression Case Study
(20)
IRJET-Analysis of Storm Water Drain in 1410 Acres, Palasamudram Site
A Comparative Study for Anomaly Detection in Data Mining
IRJET- Analysis of Crucial Oil Gas and Liquid Sensor Statistics and Productio...
IRJET- Rainfall Prediction by using Time-Series Data in Analysis of Artif...
IRJET- Estimation of Water Level Variations in Dams Based on Rainfall Dat...
ANALYSIS AND PREDICTION OF RAINFALL USING MACHINE LEARNING TECHNIQUES
IRJET- Probability based Missing Value Imputation Method and its Analysis
IRJET- Rainfall Forecasting using Regression Techniques
Linear Regressions of Predicting Rainfall over Kalay Region
Data Analysis for Solar Energy Generation in a University Microgrid
IRJET- Analyze Weather Condition using Machine Learning Algorithms
Integrated Water Resources Management Using Rainfall Forecasting With Artific...
Graphical Analysis of Simulated Financial Data Using R
MFBLP Method Forecast for Regional Load Demand System
IEOR 265 Final Paper_Minchao Lin
IRJET- Indian Water Pollution Monitoring and Forecasting for Anomaly with...
IRJET- Agricultural Crop Classification Models in Data Mining Techniques
IRJET- Supervised Learning Classification Algorithms Comparison
Ground measured data vs meteo data sets:57 locations in India_01.01.2020
Mehr von IRJET Journal
TUNNELING IN HIMALAYAS WITH NATM METHOD: A SPECIAL REFERENCES TO SUNGAL TUNNE...
IRJET Journal
STUDY THE EFFECT OF RESPONSE REDUCTION FACTOR ON RC FRAMED STRUCTURE
IRJET Journal
A COMPARATIVE ANALYSIS OF RCC ELEMENT OF SLAB WITH STARK STEEL (HYSD STEEL) A...
IRJET Journal
Effect of Camber and Angles of Attack on Airfoil Characteristics
IRJET Journal
A Review on the Progress and Challenges of Aluminum-Based Metal Matrix Compos...
IRJET Journal
Dynamic Urban Transit Optimization: A Graph Neural Network Approach for Real-...
IRJET Journal
Structural Analysis and Design of Multi-Storey Symmetric and Asymmetric Shape...
IRJET Journal
A Review of “Seismic Response of RC Structures Having Plan and Vertical Irreg...
IRJET Journal
A REVIEW ON MACHINE LEARNING IN ADAS
IRJET Journal
Long Term Trend Analysis of Precipitation and Temperature for Asosa district,...
IRJET Journal
P.E.B. Framed Structure Design and Analysis Using STAAD Pro
IRJET Journal
A Review on Innovative Fiber Integration for Enhanced Reinforcement of Concre...
IRJET Journal
Survey Paper on Cloud-Based Secured Healthcare System
IRJET Journal
Review on studies and research on widening of existing concrete bridges
IRJET Journal
React based fullstack edtech web application
IRJET Journal
A Comprehensive Review of Integrating IoT and Blockchain Technologies in the ...
IRJET Journal
A REVIEW ON THE PERFORMANCE OF COCONUT FIBRE REINFORCED CONCRETE.
IRJET Journal
Optimizing Business Management Process Workflows: The Dynamic Influence of Mi...
IRJET Journal
Multistoried and Multi Bay Steel Building Frame by using Seismic Design
IRJET Journal
Cost Optimization of Construction Using Plastic Waste as a Sustainable Constr...
IRJET Journal
Mehr von IRJET Journal
(20)
TUNNELING IN HIMALAYAS WITH NATM METHOD: A SPECIAL REFERENCES TO SUNGAL TUNNE...
STUDY THE EFFECT OF RESPONSE REDUCTION FACTOR ON RC FRAMED STRUCTURE
A COMPARATIVE ANALYSIS OF RCC ELEMENT OF SLAB WITH STARK STEEL (HYSD STEEL) A...
Effect of Camber and Angles of Attack on Airfoil Characteristics
A Review on the Progress and Challenges of Aluminum-Based Metal Matrix Compos...
Dynamic Urban Transit Optimization: A Graph Neural Network Approach for Real-...
Structural Analysis and Design of Multi-Storey Symmetric and Asymmetric Shape...
A Review of “Seismic Response of RC Structures Having Plan and Vertical Irreg...
A REVIEW ON MACHINE LEARNING IN ADAS
Long Term Trend Analysis of Precipitation and Temperature for Asosa district,...
P.E.B. Framed Structure Design and Analysis Using STAAD Pro
A Review on Innovative Fiber Integration for Enhanced Reinforcement of Concre...
Survey Paper on Cloud-Based Secured Healthcare System
Review on studies and research on widening of existing concrete bridges
React based fullstack edtech web application
A Comprehensive Review of Integrating IoT and Blockchain Technologies in the ...
A REVIEW ON THE PERFORMANCE OF COCONUT FIBRE REINFORCED CONCRETE.
Optimizing Business Management Process Workflows: The Dynamic Influence of Mi...
Multistoried and Multi Bay Steel Building Frame by using Seismic Design
Cost Optimization of Construction Using Plastic Waste as a Sustainable Constr...
Kürzlich hochgeladen
Call Girls in Netaji Nagar, Delhi 💯 Call Us 🔝9953056974 🔝 Escort Service
9953056974 Low Rate Call Girls In Saket, Delhi NCR
COST-EFFETIVE and Energy Efficient BUILDINGS ptx
JIT KUMAR GUPTA
Bhosari ( Call Girls ) Pune 6297143586 Hot Model With Sexy Bhabi Ready For ...
tanu pandey
Thermal Engineering-R & A / C - unit - V
DineshKumar4165
Top Rated Call Girls In chittoor 📱 {7001035870} VIP Escorts chittoor
dharasingh5698
Integrated Test Rig For HTFE-25 - Neometrix
Neometrix_Engineering_Pvt_Ltd
2016EF22_0 solar project report rooftop projects
smsksolar
Standard vs Custom Battery Packs - Decoding the Power Play
Epec Engineered Technologies
Call Now ≽ 9953056974 ≼🔝 Call Girls In New Ashok Nagar ≼🔝 Delhi door step de...
9953056974 Low Rate Call Girls In Saket, Delhi NCR
Navigating Complexity: The Role of Trusted Partners and VIAS3D in Dassault Sy...
Arindam Chakraborty, Ph.D., P.E. (CA, TX)
Call Girls Wakad Call Me 7737669865 Budget Friendly No Advance Booking
roncy bisnoi
FEA Based Level 3 Assessment of Deformed Tanks with Fluid Induced Loads
Arindam Chakraborty, Ph.D., P.E. (CA, TX)
Thermal Engineering Unit - I & II . ppt
DineshKumar4165
22-prompt engineering noted slide shown.pdf
203318pmpc
XXXXXXXXXXXXXXXXXXXXXXXXXXXXXXXXXXXXXXXXXXXXXXXXXXXX
ssuser89054b
notes on Evolution Of Analytic Scalability.ppt
MsecMca
Work-Permit-Receiver-in-Saudi-Aramco.pptx
JuliansyahHarahap1
Cara Menggugurkan Sperma Yang Masuk Rahim Biyar Tidak Hamil
Cara Menggugurkan Kandungan 087776558899
Employee leave management system project.
Kamal Acharya
KubeKraft presentation @CloudNativeHooghly
sanyuktamishra911
Kürzlich hochgeladen
(20)
Call Girls in Netaji Nagar, Delhi 💯 Call Us 🔝9953056974 🔝 Escort Service
COST-EFFETIVE and Energy Efficient BUILDINGS ptx
Bhosari ( Call Girls ) Pune 6297143586 Hot Model With Sexy Bhabi Ready For ...
Thermal Engineering-R & A / C - unit - V
Top Rated Call Girls In chittoor 📱 {7001035870} VIP Escorts chittoor
Integrated Test Rig For HTFE-25 - Neometrix
2016EF22_0 solar project report rooftop projects
Standard vs Custom Battery Packs - Decoding the Power Play
Call Now ≽ 9953056974 ≼🔝 Call Girls In New Ashok Nagar ≼🔝 Delhi door step de...
Navigating Complexity: The Role of Trusted Partners and VIAS3D in Dassault Sy...
Call Girls Wakad Call Me 7737669865 Budget Friendly No Advance Booking
FEA Based Level 3 Assessment of Deformed Tanks with Fluid Induced Loads
Thermal Engineering Unit - I & II . ppt
22-prompt engineering noted slide shown.pdf
XXXXXXXXXXXXXXXXXXXXXXXXXXXXXXXXXXXXXXXXXXXXXXXXXXXX
notes on Evolution Of Analytic Scalability.ppt
Work-Permit-Receiver-in-Saudi-Aramco.pptx
Cara Menggugurkan Sperma Yang Masuk Rahim Biyar Tidak Hamil
Employee leave management system project.
KubeKraft presentation @CloudNativeHooghly
Rainfall Forecasting : A Regression Case Study
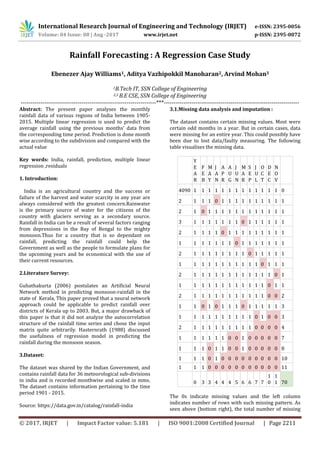
1.
International Research Journal
of Engineering and Technology (IRJET) e-ISSN: 2395-0056 Volume: 04 Issue: 08 | Aug -2017 www.irjet.net p-ISSN: 2395-0072 © 2017, IRJET | Impact Factor value: 5.181 | ISO 9001:2008 Certified Journal | Page 2211 Rainfall Forecasting : A Regression Case Study Ebenezer Ajay Williams1, Aditya Vazhipokkil Manoharan2, Arvind Mohan3 1B.Tech IT, SSN College of Engineering 2,3 B.E CSE, SSN College of Engineering ---------------------------------------------------------------------***--------------------------------------------------------------------- Abstract: The present paper analyses the monthly rainfall data of various regions of India between 1905- 2015. Multiple linear regression is used to predict the average rainfall using the previous months’ data from the corresponding time period. Prediction is done month wise according to the subdivision and compared with the actual value Key words: India, rainfall, prediction, multiple linear regression ,residuals 1. Introduction: India is an agricultural country and the success or failure of the harvest and water scarcity in any year are always considered with the greatest concern.Rainwater is the primary source of water for the citizens of the country with glaciers serving as a secondary source. Rainfall in India can be a result of several factors ranging from depressions in the Bay of Bengal to the mighty monsoon.Thus for a country that is so dependant on rainfall, predicting the rainfall could help the Government as well as the people to formulate plans for the upcoming years and be economical with the use of their current resources. 2.Literature Survey: Guhathakurta (2006) postulates an Artificial Neural Network method in predicting monsoon-rainfall in the state of Kerala, This paper proved that a neural network approach could be applicable to predict rainfall over districts of Kerala up to 2003. But, a major drawback of this paper is that it did not analyze the autocorrelation structure of the rainfall time series and chose the input matrix quite arbitrarily. Hasternrath (1988) discussed the usefulness of regression model in predicting the rainfall during the monsoon season. 3.Dataset: The dataset was shared by the Indian Government, and contains rainfall data for 36 meteorological sub-divisions in india and is recorded monthwise and scaled in mms. The dataset contains information pertaining to the time period 1901 - 2015. Source: https://data.gov.in/catalog/rainfall-india 3.1.Missing data analysis and imputation : The dataset contains certain missing values. Most were certain odd months in a year. But in certain cases, data were missing for an entire year. This could possibly have been due to lost data/faulty measuring. The following table visualises the missing data. Y E A R F E B M A Y J A N A P R A U G J U N M A R S E P J U L O C T D E C N O V 4090 1 1 1 1 1 1 1 1 1 1 1 1 1 0 2 1 1 1 0 1 1 1 1 1 1 1 1 1 1 2 1 0 1 1 1 1 1 1 1 1 1 1 1 1 3 1 1 1 1 1 1 1 0 1 1 1 1 1 1 2 1 1 1 1 0 1 1 1 1 1 1 1 1 1 1 1 1 1 1 1 1 0 1 1 1 1 1 1 1 2 1 1 1 1 1 1 1 1 0 1 1 1 1 1 1 1 1 1 1 1 1 1 1 1 1 0 1 1 1 2 1 1 1 1 1 1 1 1 1 1 1 1 0 1 1 1 1 1 1 1 1 1 1 1 1 1 0 1 1 2 1 1 1 1 1 1 1 1 1 1 1 0 0 2 1 1 0 1 0 1 1 1 0 1 1 1 1 1 3 1 1 1 1 1 1 1 1 1 1 0 1 0 0 3 2 1 1 1 1 1 1 1 1 1 0 0 0 0 4 1 1 1 1 1 1 0 0 1 0 0 0 0 0 7 1 1 1 0 1 1 0 0 1 0 0 0 0 0 8 1 1 1 0 1 0 0 0 0 0 0 0 0 0 10 1 1 1 0 0 0 0 0 0 0 0 0 0 0 11 0 3 3 4 4 4 5 6 6 7 7 1 0 1 1 70 The 0s indicate missing values and the left column indicates number of rows with such missing pattern. As seen above (bottom right), the total number of missing
2.
International Research Journal
of Engineering and Technology (IRJET) e-ISSN: 2395-0056 Volume: 04 Issue: 08 | Aug -2017 www.irjet.net p-ISSN: 2395-0072 © 2017, IRJET | Impact Factor value: 5.181 | ISO 9001:2008 Certified Journal | Page 2212 entries is 70. Since this is a small number compared to the total number of entries - 49392 (~0.41%), we decide to impute the missing data based on the rest of it. Since there is an adequate amount of data to gather the information, we use predictive mean matching to impute the data. This uses chained equations so that the predicted values are more like real since they are drawn directly from the existing data. 4.Initial Analysis : Analysis of the data is done by visualizing the data through a series of plots to gain knowledge of the data. On analysing month wise, we find that the highest amount of rainfall is in July and May, and the lowest in December. Statewise: As seen above, Karnataka and Arunachal get the most amount of rainfall throughout the year, followed by Kerala, Goa and Bengal. Scatter plot: (Scatter plot:1) The first thing noticeable from the plot above is how the areas with low rainfall are visibly separated from the areas with high rainfall visibly the ones with low rainfall range from 0-2000 and the ones above 2000 are high. As evident above, the annual rainfall over the years for most states has remained the same for the most part. However, in Arunachal Pradesh, the rainfall was remarkably high from 1925 to 1950 and then went down in the succeeding years. (Orange line) Similarly, in Orissa, it rose, peaking around 1940, and then fell again ( Blue line).Additionally Konkan and Goa have experienced a variable range of rainfall throughout the period. 5.Rainfall Prediction using Regression : Given the dataset , we can predict the rainfall month wise for every year. The prediction is done for the months June to December. As there are 36 different subdivisions there may be 36 different models for prediction.Since there may be more than one independent variable ,we may use multiple linear regression.There may be six columns of which the first five represent independent variables and the sixth represents the dependant variable. For every month predicted ,the values may be appended on to the dataset . There may be a total of eight iterations to predict the rainfall from May to December. The Mean Absolute Difference is calculated as the Absolute difference between the predicted values and the actual values. The difference between the observed value of the dependent variable (y) and the predicted value (ŷ) is called the residual (e). Each data point has one residual. Residual = Observed value - Predicted value e = y - ŷ
3.
International Research Journal
of Engineering and Technology (IRJET) e-ISSN: 2395-0056 Volume: 04 Issue: 08 | Aug -2017 www.irjet.net p-ISSN: 2395-0072 © 2017, IRJET | Impact Factor value: 5.181 | ISO 9001:2008 Certified Journal | Page 2213 In other words the distance between the regression function line and the plotted data would be termed as the residual. The Mean absolute difference serves as the residual in this case. During statistical analysis it is important to evaluate how well the model fits the data and that the data meet the assumptions of the model. The dataset is split up into a training set and testing set with 60 percent randomly chosen for training and 40 percent randomly chosen for testing. This split is done so in order to perform a classification of high,medium or low rainfall. However this paper does not include classification which is a topic of further research. 6.Results Mean Absolute Difference in Training set: 75.5054636791 Mean Absolute Difference in Testing set: 76.8001644151 7.Python Code for Regression : subdivs = df['SUBDIVISION'].unique() num_of_subdivs = subdivs.size df_res_training = pd.DataFrame(columns=np.array(['Residuals'])) df_res_testing = pd.DataFrame(columns=np.array(['Residuals'])) list_mad_training = [] mean_abs_diff_training = 0 list_mad_testing = [] mean_abs_diff_testing = 0 for subd in subdivs: df1 = df[df['SUBDIVISION']==subd] df2 = df1[[months[0],months[1],months[2],months[3],months [4]]] df2.columns = np.array(['x1','x2','x3','x4','x5']) for k in range(1,8): df3 = df1[[months[k],months[k+1],months[k+2],months[k+3], months[k+4]]] df3.columns = np.array(['x1','x2','x3','x4','x5']) df2 = df2.append(df3) df2.index = range(df2.shape[0]) msk = np.random.rand(len(df2)) < 0.6 df_train = df2[msk] df_test = df2[~msk] df_train.index = range(df_train.shape[0]) df_test.index = range(df_test.shape[0]) reg = linear_model.LinearRegression() reg.fit(df_train.drop('x5',axis=1),df_train['x5']) predicted_values = reg.predict(df_train.drop('x5',axis=1)) residuals = predicted_values-df_train['x5'].values df_res_training = df_res_training.append(pd.DataFrame(residuals,columns =np.array(['Residuals']))) mean_abs_diff_training = mean_abs_diff_training + np.sum(np.abs(residuals)) list_mad_training.append(np.mean(np.abs(residuals))) predicted_values = reg.predict(df_test.drop('x5',axis=1)) residuals = predicted_values-df_test['x5'].values df_res_testing = df_res_testing.append(pd.DataFrame(residuals,columns= np.array(['Residuals']))) mean_abs_diff_testing = mean_abs_diff_testing + np.sum(np.abs(residuals)) list_mad_testing.append(np.mean(np.abs(residuals))) df_res_training.index = range(df_res_training.shape[0]) mean_abs_diff_training = mean_abs_diff_training/df_res_training.shape[0] print('Overall (Training): ' + str(mean_abs_diff_training)) fig = plt.figure(figsize=(18,10)) ax = fig.add_subplot(111) df_res_training.plot.line(title='Residuals (Training)', color='c',ax=ax,fontsize=20) #ax.xaxis.set_ticklabels([]) plt.ylabel('Residual') ax.title.set_fontsize(30) ax.xaxis.label.set_fontsize(20) ax.yaxis.label.set_fontsize(20) df_res_testing.index = range(df_res_testing.shape[0]) mean_abs_diff_testing = mean_abs_diff_testing/df_res_testing.shape[0]
4.
International Research Journal
of Engineering and Technology (IRJET) e-ISSN: 2395-0056 Volume: 04 Issue: 08 | Aug -2017 www.irjet.net p-ISSN: 2395-0072 © 2017, IRJET | Impact Factor value: 5.181 | ISO 9001:2008 Certified Journal | Page 2214 lesser than 75 which is the overall Mean Absolute Difference. Hence it can be safely assumed that the annual rainfall in higher rainfall regions may vary by higher values each year . In contrast regions with lower average rainfall have lesser variations in their annual rainfall and thus this linear regression model may work perfectly in those regions. The high variations in the rainfall over the period in the given data can be seen in the (scatter plot:1) above. For example the region of Arunachal Pradesh experienced very high rainfall from 1925 to 1950 and later took a down slope. This could be a reason why the prediction of the rainfall in that region has the highest residue. References ● Guhathakurta, P (2005) “Long-range monsoon rainfall prediction of 2005 for the districts and sub-division Kerala with artificial neural network”, Current Science, 90, 773-779 ● Hastenrath, S (1988) “Prediction of Indian Monsoon Rainfall: Further Exploration”, Journal of Climate, 1, 298-304. ● Abdouramane Gado Djibo 1, 2,*, Harouna Karambiri 1, Ousmane Seidou 2, Ketvara Sittichok 2, Nathalie Philippon 3, Jean Emmanuel Paturel 4 and Hadiza Moussa Saley 5 (2015) ● ”Linear and Non-Linear Approaches for Statistical Seasonal Rainfall Forecast in the Sirba Watershed Region (SAHEL)“Climate 2015, 3, 727-752; doi:10.3390/cli3030727 print('Overall MAD (Testing): ' + str(mean_abs_diff_testing)) fig = plt.figure(figsize=(18,10)) ax = fig.add_subplot(111) df_res_testing.plot.line(title='Residuals (Testing)', color='m',ax=ax,fontsize=20) #ax.xaxis.set_ticklabels([]) plt.ylabel('Residual') ax.title.set_fontsize(30) ax.xaxis.label.set_fontsize(20) ax.yaxis.label.set_fontsize(20) apd_mad = pd.DataFrame(data=list_mad_training,columns=["Mean Absolute Distance (Train)"]) pd_mad["Mean Absolute Difference (Test)"] = list_mad_testing; pd_mad['Subdivisions'] = subdivs; fig = plt.figure(figsize=(16,8)) ax = fig.add_subplot(111) #pd_mad.groupby('Subdivisions').mean().plot(title='Overa ll Rainfall in Each Month of Year', ax=ax,fontsize=20) pd_mad.groupby('Subdivisions').mean().plot.bar( width=0.5,title='Mean Absolute Difference for Subdivisions',ax=ax, fontsize=20) plt.xticks(rotation = 90) plt.ylabel('Mean Abs. Difference') ax.title.set_fontsize(30) ax.xaxis.label.set_fontsize(20) ax.yaxis.label.set_fontsize(20) 8. Inference: It can be inferred that the error difference may just be about 75-76 % for the entire set if taken together. However these results may be justified as they are for predicting the rainfall for seven months given the data for five months for a period of over 100 years in 36 different regions. Additionally while plotting the the mean absolute differences between the test and train data in a bar chart we can see that the regions with higher annual rainfall are the regions where the residuals were the highest. From the bar plot of the mean annual rainfall of every region we can see that the six regions with the highest rainfall are Arunachal Pradesh,Coastal Karnataka , Kerala ,Konkan & Goa,Andaman and Nicobar Islands and the Sub- Himalayan Regions and Sikkim. In the bar chart of the residuals also it may be seen that the regions with highest mean absolute difference are the same regions with the highest rainfall. Other regions have a residual
Jetzt herunterladen