SlideShare ist ein Scribd-Unternehmen logo
1 von 8
Downloaden Sie, um offline zu lesen
International Research Journal of Engineering and Technology (IRJET) e-ISSN: 2395-0056
Volume: 09 Issue: 09 | Sep 2022 www.irjet.net p-ISSN: 2395-0072
© 2022, IRJET | Impact Factor value: 7.529 | ISO 9001:2008 Certified Journal | Page 1310
Carbon Emission Forecasting using ARIMA
Anshumaan Phukan1, Varad Vinayak Godse 2
1 Dept. of Computer Science Engineering, Bennett University, Greater Noida, Uttar Pradesh, India
2 Dept. of Computer Science Engineering, Bennett University, Greater Noida, Uttar Pradesh, India
-----------------------------------------------------------------------***-----------------------------------------------------------------------
Abstract - Global warming has become a growing
concern in recent times. The root cause of the problem
directs toward carbon emissions in the form of greenhouse
gas. The increasing human activities intervene in the earth's
natural carbon-absorbing capacity. It leads to unwanted
situations like the melting of ice caps, increasing sea levels,
extreme weather conditions, and many others. The
contributors to carbon emissions vary across industries
ranging from electricity and heat production,
transportation, agriculture, forestry, fossil fuel, and many
more.
The idea behind our project is to run a prediction, analysis,
and forecasting system over datasets related to carbon
emissions. We will focus on certain core factors causing
carbon emissions. It would include trends over the years,
maximum and minimum contributors, etc. The analysis can
be a foundation for predicting the future trends of these
contributors.
1.INTRODUCTION
1.1 PROBLEM AND MOTIVATION
The distribution of carbon emissions across sectors has
different aspects and consequences. It is essential to
concentrate on the existing numbers and statistics to
understand the scale of the issue.
According to the article from World Resources Institute,
agriculture has become the second-largest emitter by
releasing 6 billion tons of greenhouse gases. The
emissions increased by 8 percent from 1990 to 2010, with
a projection of a 15 percent rise till 2030. The sources
range from fuel use on farms, fertilizers, manure
management, urea, field burning of crop residue.
1.2 BACKGROUND KNOWLEDGE
Transportation has become a large-scale contributor as
well. The data from Oxford Martin School account for
transportation for around one-fifth of carbon dioxide
(CO2) emissions. A majority of it comes from passenger
vehicles like cars, and buses- about 45.1%. The entire
transportation sector involving road, air, and rail travel
contributes to 21% of total carbon emissions. The use of
gasoline (fossil fuel) engines across vehicles has become
the root cause.
Electricity is a widely used resource across industries and
daily life. Its production from primary energy sources like
coal, uranium, and natural gas contributes to emissions.
According to a report from Planete Energy, electricity
forms 42.5% of CO2 emissions. From this the amount, 41 %
is produced from coal, 16% from hydropower, 22% from
gas, 11% from nuclear power, and 10% percent from oil
and renewables. The growing population and technology
have triggered an exponential need for electricity. It has
caused growing concerns.
The carbon emissions from commercial and residential
construction materials have become prominent as well. A
report from nature communications sees a rapid emission
increase of 750 Mt(22% globally) in 2020. It predicts the
range of emissions to be 3.5 to 4.6 Gt in the upcoming 30
years.
The statistical numbers of the contributors are significantly
large. The current scenario hints at the growing concerns of
the future. The idea behind our effort will be to use the
latest technology for developing an analysis and prediction
model that provides concrete insights over different
contributors.
Fig. 1. Top industries responsible for emissions
International Research Journal of Engineering and Technology (IRJET) e-ISSN: 2395-0056
Volume: 09 Issue: 09 | Sep 2022 www.irjet.net p-ISSN: 2395-0072
© 2022, IRJET | Impact Factor value: 7.529 | ISO 9001:2008 Certified Journal | Page 1311
As seen in the scan to the right, the patient has abnormal
tissue in the brain, which can be spotted as a white
highlight towards the center of the scan. Unique patterns
such as these can be used to detect any malignant in the
brain, further helping us classify whether the brain is
abnormal.
2. RELATED WORK
CO2 emissions is a big problem all around the planet.
There are numerous studies begin conducted to reduce
the CO2 emissions. There is an urgent need for a system
that can estimate CO2 emissions and allow us to take
appropriate actions to minimise the CO2 emissions. IN
order to solve this problem machine learning can be used.
The process of creating algorithms which can improve
through experience is known as machine learning. For
example, training a model which could automatically
recognise fraud mails. Some models for prediction of CO2
emissions have been created employing machine learning.
In 2015 Researcher Chairul Saleh created a model which
predicted the CO2 emissions that make use of the Support
Vector Machine algorithm in machine learning. Coal
combustion and electrical energy were the input
parameters for the model, both of which play a major role
in CO2 emissions. In order to evaluate and train the model,
the data from the Alcohol industry was obtained. In May of
2017, another team of researchers developed a model that
described the quantity of CO2 released during the
manufacturing of raw milk. Data from various milk
manufacturing processes such as dairy processing and
packaging waste disposal were provided to the model for
predictions of CO2 emissions. According to the findings of
the research, 1120 g CO2 is released per litre in
manufacturing of raw milk products.
3.SYNOPSIS OF DATA
The trends in carbon emissions depend on certain baseline
core factors that cause larger impacts.
The core factors vary as below-
1)Coal Sector (CO2 Emissions)
2)Natural Gas Sector CO2 Emissions
3)Distillate Fuel, Including Kerosene-Type Jet Fuel, Oil
Sector CO2 Emissions
4)Petroleum Coke Sector CO2 Emissions
5)Residual Fuel Oil Sector CO2 Emissions
6)Petroleum Sector CO2 Emissions
7)Geothermal Energy Sector CO2 Emissions
8)Non-Biomass Waste Sector CO2 Emissions
9)Total Energy Sector CO2 Emissions
The use of coal across various industries grew to 45 %
globally between 2001 and 2010. The burning of coal to
generate steams to run turbines for electricity, as a raw
material for agricultural fertilizers, as core material for
cement production in constructions, as a combustion
source in railway and water transport made it a prominent
source of carbon emissions.
It is responsible for 46% of global carbon emissions and
72% of total Green House Gas(GHG) emissions.
The emissions from natural gas are comparatively low but
account for around half of what is caused by coal. A
widescale use for generating electricity(steam generation
units), fuel for transport (Compressed Natural Gas- CNG),
heat for buildings, household use(refrigerator cooling),
agriculture inputs(Pesticides, fertilizers, irrigation- cheaper
than electricity) has caused a 43 percent increase since
2005. Although it contributes less compared to coal, it
requires significant attention.
Distillate fuels are fractions of petroleum formed as a result
of distillation subdues. It includes diesel fuels, jet fuel, and
fuel oil(marine fuel, furnace oil, heavy oil). In 2021, the
sector emitted 81.92 metric tons of carbon. It causes
emissions almost four times that of petroleum. The recent
days witnessed limited use of diesel vehicles(not including
heavy vehicles) and purer alternatives for jet and marine
fuels.
Petroleum coke is a carbon-rich by-product of crude oil
refining. Its use in the aluminum industry, graphite
electrodes for the steel industry, and fuel for cement kilns
has caused growing concerns. It emits more greenhouse
gases and air pollutants than raw coal. China initiated the
early use, with an 18.9 percent rise between 2010-and
2016. The economic advantages of petroleum coke benefit
many industries across the globe.
Petroleum is a widely used resource across industries and
daily lives. A largescale application as fuel for vehicles
extends to ammonia for fertilizers, heating furnaces,
petrochemical industry, and Lubricants. It also produces
many harmful by-products. The sector emitted 1.22 million
metric tons of carbon dioxide in 2013. In 2020, a 6.3
percent decline in emissions marked the growth rate over
the decade.
International Research Journal of Engineering and Technology (IRJET) e-ISSN: 2395-0056
Volume: 09 Issue: 09 | Sep 2022 www.irjet.net p-ISSN: 2395-0072
© 2022, IRJET | Impact Factor value: 7.529 | ISO 9001:2008 Certified Journal | Page 1312
Geothermal energy uses heat from the earth's core by
producing minimal waste products. It emits 38 grams of
Carbon dioxide per kilowatt of electricity produced. The
minimal emissions from the sector introduce the need to
monitor to avoid overexploitation.
Non-biomass sectors like nuclear energy produce zero
carbon emissions, but the production processes(extraction
and transport of uranium, nuclear waste generation) cause
harmful effects.
The data is from the US Energy Information
Administration, and it is a time series data that spans from
January 1973 to July 2016. It is a comprehensive collection
of carbon emission values spanning several years and
involves various energy sectors such as geothermal energy,
natural gas, petroleum coke, and so on. With the use of such
data throughout constant time intervals, we may run
carbon emission forecasting models like ARIMA. It would
be useful in cases when vital decisions must be made based
on predicted emission values.
4.INTRODUCTION
Approach
We plan to achieve our goal by using a combination of
machine learning and neural networks to forecast carbon
emissions based on meaningful data.
Hypothesis testing would play a prominent role in our
data analysis section. Hypothesis testing is a type of
statistical method of drawing conclusions about a
probability distribution or population parameter using
data from a designated sample. It would be useful for our
scenario because it allows us to evaluate 2 mutual
exclusive statements, create an assumption and perform
statistical analysis to reject or accept the hypothesis. In
our use case, tests such as the Chi-Square test, T-Test, and
Annova Test will be used. The null hypothesis, abbreviated
as H0, would be our assumption. If statistical testing
rejects our null hypothesis, we will define an alternate
hypothesis. As a result, we can clearly deduce the
relationships between individual carbon emission
variables and total emission levels using these
methodologies.
After understanding our data, the necessary feature
engineering and selection procedures would be followed
to ensure our model can predict carbon emissions with
maximum accuracy. Techniques like mutual info index,
correlation matrix, and variance threshold would play a
huge role in selecting features that affect our prediction
the most. Taking too many useful features can also result
in a dimensionality curse. Feature extraction techniques
like principal component analysis could help us in
reducing dimensions by creating eigenvalues and
eigenvectors. After acquiring the preprocessed data,
numerous statistical models and neural networks will be
trained on it. This study will employ models such as linear
regression, polynomial regression, locally weighted
regression, KNN, naive Bayes, SVM with different kernels,
ensemble approaches with different base learners, and
ANN. The base machine learning models like regression
will be our introductory approach, which would be
followed by the implementation of advanced techniques. If
the scatter plot portrays clear subdivisions among our
dataset, models like KNN and SVM would be our first
priority. Bagging and boosting ensemble techniques like
decision tree, AdaBoost, gradient boost, and xgboost will
help us combine several base models to produce one
optimal predictive model. These techniques are also called
as free lunch model as no single model wins. The aim of
ensemble models is to build strong learning based on weak
learners.
The final model would be the custom neural network with
different experimental optimizers, activation functions, and
weight initialization techniques. Finally, we will perform a
detailed investigation of our findings and discoveries using
visualizations and hyperparameter tuning to determine the
parameters and model combinations that will provide the
best forecast.
5.PROPOSED METHODOLGY
The dataset consists of time-series data points collected
at constant time intervals. The time-dependent or dynamic
nature of the problem requires time-series modeling. It is a
powerful tool for extracting current data and making future
predictions and forecasting.
The overview of the steps for the final output involves the
retrieval of the CSV time-series data, transforming or pre-
processing of the data for suitable input, visualizing the
data, applying different methods for testing whether it is
stationary, transforming time-series data to stationary,
finding optimal parameters to build SARIMA model,
diagnosing, and validating the predictions and forecasting.
RETRIEVAL
The read_csv function of pandas extracts the data in the
form of a data frame. The info() function provides
specifications describing 5096 observations with six
columns. The data type of four columns is an object, while
two have an integer. The current data frame does not
International Research Journal of Engineering and Technology (IRJET) e-ISSN: 2395-0056
Volume: 09 Issue: 09 | Sep 2022 www.irjet.net p-ISSN: 2395-0072
© 2022, IRJET | Impact Factor value: 7.529 | ISO 9001:2008 Certified Journal | Page 1313
represent a time series. The read_csv function needs
specialized arguments to bring the data in the form of time
series. The arguments go as follows-
 parse_dates: Identifies the key for the date-time
column. The initial dates come in string format.
For example 'YYYYMM'
 index_col: Shifts DateTime column into index
column.
 date_parser: Converts an input string into a
DateTime variable.
Further pre-processing involves dropping null rows and
null values in the index column using functions like
notNull() and dropNa(). The coerce property with setting
errors converts columns to float and fills problematic
entries with Null(NaN). The to_numeric function converts
the emission value column from object to numeric.
ANAYLYSIS
TEST STATIONARY
The dataset is analyzed to observe any trends and
seasonality. The presence makes it nonstationary data.
The removal of nonstationary elements converts the
dataset into stationary. The residuals from the process
form the base for further analysis.
Stationary Process- A stationary process has a probability
distribution that remains unchanged with time. The
parameters like mean and variance do not change over
time.
The most common violation of stationarity comes from
trends in mean. If the cause of non-stationarity is the unit
root, then it is not mean-reverting. If it is a deterministic
trend, it can transform to stationarity.
The analysis occurs with a single category of Natural gas
CO2 emissions. The same steps can repeat for others.
The group-by function creates data frames with columns
corresponding to the categories and having emission
values. The index column has date-time entries.
GRAPH METHOD
The plot method from MatPlotlib generates a graph. It has
emission values on the y-axis and DateTime(in years) data
on the x-axis. The structure and trends of the plot can help
to observe stationarity.
DICKY-FULLER TEST
The test considers a null hypothesis. In this case, the null
hypothesis is- that the time series is nonstationary. A Test
statistic gets compared with critical values at different
confidence values. If the critical value exceeds the Statistic,
the null hypothesis gets rejected. The time series is
stationary.
The opposite case accepts the null hypothesis keeping the
time-series data non-stationary.
The Adler function from python takes the data and lag
parameters. A lag describes the delay time between two
sets of observations. Methods like Akaike Information
Criterion(AIC) determine the optimal number of lags. The
auto lag parameters set the number of lags to minimize the
AIC.
The test provides a p-value which gets compared to the
user-provided cutoff.
It also gives a test statistic that compares critical values at
different confidence levels.
CONVERSION TO STATIONARY
The technique focuses on taking the mean of a set of
consecutive values.
We target a yearly trend that requires an average of 12
consecutive values or months. The value in each entry in
the column is the mean of the previous 12 values. The first
11 values remain null as they do not have a sufficient
number of values prior(12). The original data gets
subtracted from the new data of the moving average. It gets
tested through the dicky fuller test that tells whether the
conversion to stationarity is successful.
The technique uses the rolling method from python.
Adding seasonal terms to an ARIMA model results in a
model called SARIMA. This model is characterized by 3
terms:
P: order of the auto regressive term
Q: order of moving average term
D: number of differencing required to convert non
stationary time series data to stationary.
When a seasonal ARIMA model needs to be fitted, our goal
should be to determine the parameters that are responsible
for optimizing the metric of interest. While implementing
International Research Journal of Engineering and Technology (IRJET) e-ISSN: 2395-0056
Volume: 09 Issue: 09 | Sep 2022 www.irjet.net p-ISSN: 2395-0072
© 2022, IRJET | Impact Factor value: 7.529 | ISO 9001:2008 Certified Journal | Page 1314
seasonal ARIMA, we considered two possible scenarios.
First one being a stationary time series data with no
dependence. In this case, residuals were modeled as white
noise. The second case would involve a time series data
with noticeable dependence among values. We specifically
needed to implement statistical model like ARIMA in the
second scenario.
For forecasting stationary time series data, the ARIMA
model, which is a linear function akin to linear regression,
is commonly utilized.
For finding optimal parameters, we implemented two
major techniques: Plotting of ACF and PACF curve.
Autocorrelation Function and Partial Autocorrelation
Function are both responsible for measuring correlation
between ts (time series) with a lagged version of itself. But
in the case of PACF, elimination of variations are already
explained beforehand by intervening comparisons. As a
result, these two graphs will be used to determine the
model's tuning parameters (p and q).
Second method involves Grid Search for optimizing
parameters. This method was included as it a more
systematic approach compared to the previous one. It is
an iterative technique of exploring all possible
combination of parameters of our forecasting model.
Seasonal ARIMA model will be fitted all combinations.
After exploration, parameters that yield the best
performance will be opted. A function called SARIMAX()
was used in our case to perform hyperparameter
optimization.
6.RESULTS
STATIONARITY
The result of the first adder fuller test yielded a greater val
ue of -1.827631 for Test Static compared to the critical val
ues at different confidence levels. The initial critical value
was set at 0.01. The confidence levels were set at 95, 90%,
99%. It means 5%( -2.867303), 10%(-2.569840) and 1% (
-3.443418)of the critical value.
The moving average method results in test static(-5.98541
9e+00) lesser than critical values 10%(-2.569840), 1% (-3.
443418) and 5%( -2.867303)
EVALUATION
For performing evaluation, we first plotted the
Autocorrelation Function (ACF) and Partial
Autocorrelation Function (PACF) curve for our seasonal
ARIMA model. As finding the optimal parameters manually
graphs is time consuming, we opted for grid search
method. Using this method, we explored each and every
possible combination of parameters possible. When
analyzing and comparing statistical models with various
parameters, each can be rated against the others based on
how well they fit the data or their ability to properly
forecast future data points. A statistical value called AIC
was used for the scenario. For this example, we are taking
emission values only for Coal Electric Power Sector. The
Akaike Information Criterion value measures how well a
model fits our training data. It is calculated using the
number of independent variables, and the maximum
likelihood estimate of the model. AIC values are only useful
in comparison scenarios. A lower score of AIC indicates our
model is performing well. After performing
hyperparameter tuning through grid search, the SARIMAX
International Research Journal of Engineering and Technology (IRJET) e-ISSN: 2395-0056
Volume: 09 Issue: 09 | Sep 2022 www.irjet.net p-ISSN: 2395-0072
© 2022, IRJET | Impact Factor value: 7.529 | ISO 9001:2008 Certified Journal | Page 1315
(1, 1, 1)x(0, 1, 1, 12) yielded the lowest AIC score of
2003.553. Hence, we considered these conditions for our
proposed model. Next step we went for in-depth analysis
of the model with the above-mentioned parameters.
Fig: State-space model result for Coal Electric Power
Sector
The next analysis would plot the residual errors for our
seasonal ARIMA model.
Fig: Residual errors for SARIMA for coal power generation
The residual error distribution is depicted in the diagram.
It shows that the prediction is a little skewed.
Fig: Diagnostic Plot
The red KDE line in the top right plot closely resembles the
N(0,1) line. This indicates the residual residuals are
normally distributed. However, we can observe some
deviations in the straight line, indicating the normal
distribution is not perfect for the distribution of errors in
the forecast, but it is defiantly acceptable. The qq-plot at
the bottom left again indicated our residuals are normally
distributed.
After we obtained our model for time series forecasting, we
started comparing the predicted and real values of the data.
We got the values and accompanying confidence intervals
for time series forecasts using the get prediction() and
conf_int() properties.
Fig: One step ahead forecast
The table above portrays one-step forecasts at each point
using the entire historical data until the current point.
International Research Journal of Engineering and Technology (IRJET) e-ISSN: 2395-0056
Volume: 09 Issue: 09 | Sep 2022 www.irjet.net p-ISSN: 2395-0072
© 2022, IRJET | Impact Factor value: 7.529 | ISO 9001:2008 Certified Journal | Page 1316
Fig: Real vs Forecasted values of CO2 emissions for coal
power generation
Overall, our forecasts closely match the true numbers,
indicating a similar pattern of behavior.
The model we built gave us an MSE score of 14.39 and an
RMSE score of 3.7936, which is fairly low. The model's pur
pose was to achieve high-quality predictive power throug
h dynamic forecasting.
FORECASTING
The get_forecast method undertakes the total number of st
eps to forecast. The conf_init() method provides confidenc
e intervals . A confidence interval has a set of values withi
n which the parameter can lie.
The data from the above function is used to draw the plots
to display the forecast for different categories.
The highlighted area in green color represents the other p
ossible variations in the forecasted values. The forecasting
model performs better when it is less.
The natural gas forecast shows an upward trend for the ne
xt ten years. The green area remains shorter as a result of
a good prediction.
The coal forecast shows a downward trend highlighting th
e decreased use of coal in the future. The shorter green are
a corresponds to a good prediction.
The distillate fuel category witnesses a slightly decreasing
but almost constant trend. The larger green area suggests
more variations in the forecasted line.
The petroleum category witnesses a slightly decreasing tr
end.
It consists of variations in the forecasted line.
The total energy plot combining every sector shows a down
ward trend with negligible variations.
7.CONCLUSION
The categories like natural gas and coal are used widely an
d have led to environmental consequences. The growing tre
nd in natural gas is alarming, but a decreasing trend in coal
highlights an improved scenario.
Other categories like petroleum and distillate have
constant growth.
The patterns and trends forecasted by the model prove ess
ential as it helps to understand the future. The global aim of
achieving net carbon emission to zero by 2050 needs conti
nuous analysis and predictions over the current scenarios.
The current emission trend might seem constant or decrea
sing, but the situation will deteriorate because the present
emissions have effects in the far future. Hypothetically, if w
e reduce the net emissions to zero at once, the impact of rec
ent emissions will trigger the problem again.
The use of technology to analyze datasets for generating ins
ights plays a significant role. The various machine learning
techniques extended by python libraries help run efficient
and useful predictions and forecasts.
We focussed on the techniques to generate a forecasting an
alysis that is useful to environmentalists, researchers, and
others working towards the cause.
International Research Journal of Engineering and Technology (IRJET) e-ISSN: 2395-0056
Volume: 09 Issue: 09 | Sep 2022 www.irjet.net p-ISSN: 2395-0072
© 2022, IRJET | Impact Factor value: 7.529 | ISO 9001:2008 Certified Journal | Page 1317
REFERENCES
 https://www.wri.org/insights/4-charts-
explain-greenhouse-gas-emissions-countries-
and-sectors
 http://www.annualreviews.org/doi/abs/10.1
146/annurev-environ-032310-112100
 https://www.planete-
energies.com/en/medias/close/electricity-
generation-and-related-co2-emissions
 https://machinelearningmastery.com/arima-
for-time-series-forecasting-with-python/
 https://www.machinelearningplus.com/time-
series/augmented-dickey-fuller-test/
 https://machinelearningmastery.com/moving
-average-smoothing-for-time-series-
forecasting-python/
 https://neptune.ai/blog/select-model-for-
time-series-prediction-task
 https://towardsdatascience.com/identifying-
ar-and-ma-terms-using-acf-and-pacf-plots-in-
time-series-forecasting-
ccb9fd073db8?gi=e940575f86f8
 https://www.yourdatateacher.com/2021/05/
19/hyperparameter-tuning-grid-search-and-
random-search/
 https://robert-alvarez.github.io/2018-06-04-
diagnostic_plots/
 https://pandas.pydata.org/docs/reference/api
/pandas.read_csv.html

Weitere ähnliche Inhalte

Ähnlich wie Carbon Emission Forecasting using ARIMA

Green Industry Policy in support of Net-Zero Emission achievements: Astika An...
Green Industry Policy in support of Net-Zero Emission achievements: Astika An...Green Industry Policy in support of Net-Zero Emission achievements: Astika An...
Green Industry Policy in support of Net-Zero Emission achievements: Astika An...OECD Environment
 
IRJET- Deep Learning in Greenhouse Gases Emissions from Agriculture Activitie...
IRJET- Deep Learning in Greenhouse Gases Emissions from Agriculture Activitie...IRJET- Deep Learning in Greenhouse Gases Emissions from Agriculture Activitie...
IRJET- Deep Learning in Greenhouse Gases Emissions from Agriculture Activitie...IRJET Journal
 
EmissionsfromOilandGasOperationsinNetZeroTransitions.pdf
EmissionsfromOilandGasOperationsinNetZeroTransitions.pdfEmissionsfromOilandGasOperationsinNetZeroTransitions.pdf
EmissionsfromOilandGasOperationsinNetZeroTransitions.pdfKhaled Al Awadi
 
IRJET- Are Electric Vehicles Real Alternative for Petroleum based Vehicles? a...
IRJET- Are Electric Vehicles Real Alternative for Petroleum based Vehicles? a...IRJET- Are Electric Vehicles Real Alternative for Petroleum based Vehicles? a...
IRJET- Are Electric Vehicles Real Alternative for Petroleum based Vehicles? a...IRJET Journal
 
carbon_capture_utilisation_and_sequestration_168027343619588444126426f01c0c21...
carbon_capture_utilisation_and_sequestration_168027343619588444126426f01c0c21...carbon_capture_utilisation_and_sequestration_168027343619588444126426f01c0c21...
carbon_capture_utilisation_and_sequestration_168027343619588444126426f01c0c21...20JE0369GAURAVKUMAR
 
GHG Science based targets
GHG Science based targetsGHG Science based targets
GHG Science based targetsLeonardo ENERGY
 
Waste to energy market
Waste to energy marketWaste to energy market
Waste to energy marketamanjaincmi
 
IRJET- Vehicular Exhaust Emission Estimation and Control Modelling
IRJET- Vehicular Exhaust Emission Estimation and Control ModellingIRJET- Vehicular Exhaust Emission Estimation and Control Modelling
IRJET- Vehicular Exhaust Emission Estimation and Control ModellingIRJET Journal
 
Green it governance cio-club
Green it governance cio-clubGreen it governance cio-club
Green it governance cio-clubTanguy Swinnen
 
Externalities of the Car Industry - First Ch. MSc Thesis
Externalities of the Car Industry - First Ch. MSc ThesisExternalities of the Car Industry - First Ch. MSc Thesis
Externalities of the Car Industry - First Ch. MSc Thesisserena boccardo
 
Waste heat recovery dynamics an analogy of electricity generation & emiss...
Waste heat recovery dynamics an analogy of electricity generation & emiss...Waste heat recovery dynamics an analogy of electricity generation & emiss...
Waste heat recovery dynamics an analogy of electricity generation & emiss...Arya Jena
 
ENV GLOBAL FORUM OCT 2016 - Session 3 - Timur Gül
ENV GLOBAL FORUM OCT 2016 - Session 3 - Timur GülENV GLOBAL FORUM OCT 2016 - Session 3 - Timur Gül
ENV GLOBAL FORUM OCT 2016 - Session 3 - Timur GülOECD Environment
 
Conference Paper: Exploring the effects of ICT solutions on GHG emissions in ...
Conference Paper: Exploring the effects of ICT solutions on GHG emissions in ...Conference Paper: Exploring the effects of ICT solutions on GHG emissions in ...
Conference Paper: Exploring the effects of ICT solutions on GHG emissions in ...Ericsson
 
CCUS-2021 FactBook.pdf
CCUS-2021 FactBook.pdfCCUS-2021 FactBook.pdf
CCUS-2021 FactBook.pdffdgfdgfdsgdfg
 
Sethi 28 August 2009
Sethi   28 August 2009Sethi   28 August 2009
Sethi 28 August 2009equitywatch
 

Ähnlich wie Carbon Emission Forecasting using ARIMA (20)

Low carbon Transition in the Cement Industry
Low carbon Transition in the Cement IndustryLow carbon Transition in the Cement Industry
Low carbon Transition in the Cement Industry
 
Low carbon Transition in the Cement Industry
Low carbon Transition in the Cement IndustryLow carbon Transition in the Cement Industry
Low carbon Transition in the Cement Industry
 
Green Industry Policy in support of Net-Zero Emission achievements: Astika An...
Green Industry Policy in support of Net-Zero Emission achievements: Astika An...Green Industry Policy in support of Net-Zero Emission achievements: Astika An...
Green Industry Policy in support of Net-Zero Emission achievements: Astika An...
 
Yuko Kanamori.pdf
Yuko Kanamori.pdfYuko Kanamori.pdf
Yuko Kanamori.pdf
 
IRJET- Deep Learning in Greenhouse Gases Emissions from Agriculture Activitie...
IRJET- Deep Learning in Greenhouse Gases Emissions from Agriculture Activitie...IRJET- Deep Learning in Greenhouse Gases Emissions from Agriculture Activitie...
IRJET- Deep Learning in Greenhouse Gases Emissions from Agriculture Activitie...
 
EmissionsfromOilandGasOperationsinNetZeroTransitions.pdf
EmissionsfromOilandGasOperationsinNetZeroTransitions.pdfEmissionsfromOilandGasOperationsinNetZeroTransitions.pdf
EmissionsfromOilandGasOperationsinNetZeroTransitions.pdf
 
IRJET- Are Electric Vehicles Real Alternative for Petroleum based Vehicles? a...
IRJET- Are Electric Vehicles Real Alternative for Petroleum based Vehicles? a...IRJET- Are Electric Vehicles Real Alternative for Petroleum based Vehicles? a...
IRJET- Are Electric Vehicles Real Alternative for Petroleum based Vehicles? a...
 
carbon_capture_utilisation_and_sequestration_168027343619588444126426f01c0c21...
carbon_capture_utilisation_and_sequestration_168027343619588444126426f01c0c21...carbon_capture_utilisation_and_sequestration_168027343619588444126426f01c0c21...
carbon_capture_utilisation_and_sequestration_168027343619588444126426f01c0c21...
 
GHG Science based targets
GHG Science based targetsGHG Science based targets
GHG Science based targets
 
Waste to energy market
Waste to energy marketWaste to energy market
Waste to energy market
 
IRJET- Vehicular Exhaust Emission Estimation and Control Modelling
IRJET- Vehicular Exhaust Emission Estimation and Control ModellingIRJET- Vehicular Exhaust Emission Estimation and Control Modelling
IRJET- Vehicular Exhaust Emission Estimation and Control Modelling
 
Green it governance cio-club
Green it governance cio-clubGreen it governance cio-club
Green it governance cio-club
 
Externalities of the Car Industry - First Ch. MSc Thesis
Externalities of the Car Industry - First Ch. MSc ThesisExternalities of the Car Industry - First Ch. MSc Thesis
Externalities of the Car Industry - First Ch. MSc Thesis
 
Waste heat recovery dynamics an analogy of electricity generation & emiss...
Waste heat recovery dynamics an analogy of electricity generation & emiss...Waste heat recovery dynamics an analogy of electricity generation & emiss...
Waste heat recovery dynamics an analogy of electricity generation & emiss...
 
ENV GLOBAL FORUM OCT 2016 - Session 3 - Timur Gül
ENV GLOBAL FORUM OCT 2016 - Session 3 - Timur GülENV GLOBAL FORUM OCT 2016 - Session 3 - Timur Gül
ENV GLOBAL FORUM OCT 2016 - Session 3 - Timur Gül
 
Educause Live
Educause LiveEducause Live
Educause Live
 
Conference Paper: Exploring the effects of ICT solutions on GHG emissions in ...
Conference Paper: Exploring the effects of ICT solutions on GHG emissions in ...Conference Paper: Exploring the effects of ICT solutions on GHG emissions in ...
Conference Paper: Exploring the effects of ICT solutions on GHG emissions in ...
 
CCUS-2021 FactBook.pdf
CCUS-2021 FactBook.pdfCCUS-2021 FactBook.pdf
CCUS-2021 FactBook.pdf
 
Sethi 28 August 2009
Sethi   28 August 2009Sethi   28 August 2009
Sethi 28 August 2009
 
2017 Melchett Lecture
2017 Melchett Lecture2017 Melchett Lecture
2017 Melchett Lecture
 

Mehr von IRJET Journal

TUNNELING IN HIMALAYAS WITH NATM METHOD: A SPECIAL REFERENCES TO SUNGAL TUNNE...
TUNNELING IN HIMALAYAS WITH NATM METHOD: A SPECIAL REFERENCES TO SUNGAL TUNNE...TUNNELING IN HIMALAYAS WITH NATM METHOD: A SPECIAL REFERENCES TO SUNGAL TUNNE...
TUNNELING IN HIMALAYAS WITH NATM METHOD: A SPECIAL REFERENCES TO SUNGAL TUNNE...IRJET Journal
 
STUDY THE EFFECT OF RESPONSE REDUCTION FACTOR ON RC FRAMED STRUCTURE
STUDY THE EFFECT OF RESPONSE REDUCTION FACTOR ON RC FRAMED STRUCTURESTUDY THE EFFECT OF RESPONSE REDUCTION FACTOR ON RC FRAMED STRUCTURE
STUDY THE EFFECT OF RESPONSE REDUCTION FACTOR ON RC FRAMED STRUCTUREIRJET Journal
 
A COMPARATIVE ANALYSIS OF RCC ELEMENT OF SLAB WITH STARK STEEL (HYSD STEEL) A...
A COMPARATIVE ANALYSIS OF RCC ELEMENT OF SLAB WITH STARK STEEL (HYSD STEEL) A...A COMPARATIVE ANALYSIS OF RCC ELEMENT OF SLAB WITH STARK STEEL (HYSD STEEL) A...
A COMPARATIVE ANALYSIS OF RCC ELEMENT OF SLAB WITH STARK STEEL (HYSD STEEL) A...IRJET Journal
 
Effect of Camber and Angles of Attack on Airfoil Characteristics
Effect of Camber and Angles of Attack on Airfoil CharacteristicsEffect of Camber and Angles of Attack on Airfoil Characteristics
Effect of Camber and Angles of Attack on Airfoil CharacteristicsIRJET Journal
 
A Review on the Progress and Challenges of Aluminum-Based Metal Matrix Compos...
A Review on the Progress and Challenges of Aluminum-Based Metal Matrix Compos...A Review on the Progress and Challenges of Aluminum-Based Metal Matrix Compos...
A Review on the Progress and Challenges of Aluminum-Based Metal Matrix Compos...IRJET Journal
 
Dynamic Urban Transit Optimization: A Graph Neural Network Approach for Real-...
Dynamic Urban Transit Optimization: A Graph Neural Network Approach for Real-...Dynamic Urban Transit Optimization: A Graph Neural Network Approach for Real-...
Dynamic Urban Transit Optimization: A Graph Neural Network Approach for Real-...IRJET Journal
 
Structural Analysis and Design of Multi-Storey Symmetric and Asymmetric Shape...
Structural Analysis and Design of Multi-Storey Symmetric and Asymmetric Shape...Structural Analysis and Design of Multi-Storey Symmetric and Asymmetric Shape...
Structural Analysis and Design of Multi-Storey Symmetric and Asymmetric Shape...IRJET Journal
 
A Review of “Seismic Response of RC Structures Having Plan and Vertical Irreg...
A Review of “Seismic Response of RC Structures Having Plan and Vertical Irreg...A Review of “Seismic Response of RC Structures Having Plan and Vertical Irreg...
A Review of “Seismic Response of RC Structures Having Plan and Vertical Irreg...IRJET Journal
 
A REVIEW ON MACHINE LEARNING IN ADAS
A REVIEW ON MACHINE LEARNING IN ADASA REVIEW ON MACHINE LEARNING IN ADAS
A REVIEW ON MACHINE LEARNING IN ADASIRJET Journal
 
Long Term Trend Analysis of Precipitation and Temperature for Asosa district,...
Long Term Trend Analysis of Precipitation and Temperature for Asosa district,...Long Term Trend Analysis of Precipitation and Temperature for Asosa district,...
Long Term Trend Analysis of Precipitation and Temperature for Asosa district,...IRJET Journal
 
P.E.B. Framed Structure Design and Analysis Using STAAD Pro
P.E.B. Framed Structure Design and Analysis Using STAAD ProP.E.B. Framed Structure Design and Analysis Using STAAD Pro
P.E.B. Framed Structure Design and Analysis Using STAAD ProIRJET Journal
 
A Review on Innovative Fiber Integration for Enhanced Reinforcement of Concre...
A Review on Innovative Fiber Integration for Enhanced Reinforcement of Concre...A Review on Innovative Fiber Integration for Enhanced Reinforcement of Concre...
A Review on Innovative Fiber Integration for Enhanced Reinforcement of Concre...IRJET Journal
 
Survey Paper on Cloud-Based Secured Healthcare System
Survey Paper on Cloud-Based Secured Healthcare SystemSurvey Paper on Cloud-Based Secured Healthcare System
Survey Paper on Cloud-Based Secured Healthcare SystemIRJET Journal
 
Review on studies and research on widening of existing concrete bridges
Review on studies and research on widening of existing concrete bridgesReview on studies and research on widening of existing concrete bridges
Review on studies and research on widening of existing concrete bridgesIRJET Journal
 
React based fullstack edtech web application
React based fullstack edtech web applicationReact based fullstack edtech web application
React based fullstack edtech web applicationIRJET Journal
 
A Comprehensive Review of Integrating IoT and Blockchain Technologies in the ...
A Comprehensive Review of Integrating IoT and Blockchain Technologies in the ...A Comprehensive Review of Integrating IoT and Blockchain Technologies in the ...
A Comprehensive Review of Integrating IoT and Blockchain Technologies in the ...IRJET Journal
 
A REVIEW ON THE PERFORMANCE OF COCONUT FIBRE REINFORCED CONCRETE.
A REVIEW ON THE PERFORMANCE OF COCONUT FIBRE REINFORCED CONCRETE.A REVIEW ON THE PERFORMANCE OF COCONUT FIBRE REINFORCED CONCRETE.
A REVIEW ON THE PERFORMANCE OF COCONUT FIBRE REINFORCED CONCRETE.IRJET Journal
 
Optimizing Business Management Process Workflows: The Dynamic Influence of Mi...
Optimizing Business Management Process Workflows: The Dynamic Influence of Mi...Optimizing Business Management Process Workflows: The Dynamic Influence of Mi...
Optimizing Business Management Process Workflows: The Dynamic Influence of Mi...IRJET Journal
 
Multistoried and Multi Bay Steel Building Frame by using Seismic Design
Multistoried and Multi Bay Steel Building Frame by using Seismic DesignMultistoried and Multi Bay Steel Building Frame by using Seismic Design
Multistoried and Multi Bay Steel Building Frame by using Seismic DesignIRJET Journal
 
Cost Optimization of Construction Using Plastic Waste as a Sustainable Constr...
Cost Optimization of Construction Using Plastic Waste as a Sustainable Constr...Cost Optimization of Construction Using Plastic Waste as a Sustainable Constr...
Cost Optimization of Construction Using Plastic Waste as a Sustainable Constr...IRJET Journal
 

Mehr von IRJET Journal (20)

TUNNELING IN HIMALAYAS WITH NATM METHOD: A SPECIAL REFERENCES TO SUNGAL TUNNE...
TUNNELING IN HIMALAYAS WITH NATM METHOD: A SPECIAL REFERENCES TO SUNGAL TUNNE...TUNNELING IN HIMALAYAS WITH NATM METHOD: A SPECIAL REFERENCES TO SUNGAL TUNNE...
TUNNELING IN HIMALAYAS WITH NATM METHOD: A SPECIAL REFERENCES TO SUNGAL TUNNE...
 
STUDY THE EFFECT OF RESPONSE REDUCTION FACTOR ON RC FRAMED STRUCTURE
STUDY THE EFFECT OF RESPONSE REDUCTION FACTOR ON RC FRAMED STRUCTURESTUDY THE EFFECT OF RESPONSE REDUCTION FACTOR ON RC FRAMED STRUCTURE
STUDY THE EFFECT OF RESPONSE REDUCTION FACTOR ON RC FRAMED STRUCTURE
 
A COMPARATIVE ANALYSIS OF RCC ELEMENT OF SLAB WITH STARK STEEL (HYSD STEEL) A...
A COMPARATIVE ANALYSIS OF RCC ELEMENT OF SLAB WITH STARK STEEL (HYSD STEEL) A...A COMPARATIVE ANALYSIS OF RCC ELEMENT OF SLAB WITH STARK STEEL (HYSD STEEL) A...
A COMPARATIVE ANALYSIS OF RCC ELEMENT OF SLAB WITH STARK STEEL (HYSD STEEL) A...
 
Effect of Camber and Angles of Attack on Airfoil Characteristics
Effect of Camber and Angles of Attack on Airfoil CharacteristicsEffect of Camber and Angles of Attack on Airfoil Characteristics
Effect of Camber and Angles of Attack on Airfoil Characteristics
 
A Review on the Progress and Challenges of Aluminum-Based Metal Matrix Compos...
A Review on the Progress and Challenges of Aluminum-Based Metal Matrix Compos...A Review on the Progress and Challenges of Aluminum-Based Metal Matrix Compos...
A Review on the Progress and Challenges of Aluminum-Based Metal Matrix Compos...
 
Dynamic Urban Transit Optimization: A Graph Neural Network Approach for Real-...
Dynamic Urban Transit Optimization: A Graph Neural Network Approach for Real-...Dynamic Urban Transit Optimization: A Graph Neural Network Approach for Real-...
Dynamic Urban Transit Optimization: A Graph Neural Network Approach for Real-...
 
Structural Analysis and Design of Multi-Storey Symmetric and Asymmetric Shape...
Structural Analysis and Design of Multi-Storey Symmetric and Asymmetric Shape...Structural Analysis and Design of Multi-Storey Symmetric and Asymmetric Shape...
Structural Analysis and Design of Multi-Storey Symmetric and Asymmetric Shape...
 
A Review of “Seismic Response of RC Structures Having Plan and Vertical Irreg...
A Review of “Seismic Response of RC Structures Having Plan and Vertical Irreg...A Review of “Seismic Response of RC Structures Having Plan and Vertical Irreg...
A Review of “Seismic Response of RC Structures Having Plan and Vertical Irreg...
 
A REVIEW ON MACHINE LEARNING IN ADAS
A REVIEW ON MACHINE LEARNING IN ADASA REVIEW ON MACHINE LEARNING IN ADAS
A REVIEW ON MACHINE LEARNING IN ADAS
 
Long Term Trend Analysis of Precipitation and Temperature for Asosa district,...
Long Term Trend Analysis of Precipitation and Temperature for Asosa district,...Long Term Trend Analysis of Precipitation and Temperature for Asosa district,...
Long Term Trend Analysis of Precipitation and Temperature for Asosa district,...
 
P.E.B. Framed Structure Design and Analysis Using STAAD Pro
P.E.B. Framed Structure Design and Analysis Using STAAD ProP.E.B. Framed Structure Design and Analysis Using STAAD Pro
P.E.B. Framed Structure Design and Analysis Using STAAD Pro
 
A Review on Innovative Fiber Integration for Enhanced Reinforcement of Concre...
A Review on Innovative Fiber Integration for Enhanced Reinforcement of Concre...A Review on Innovative Fiber Integration for Enhanced Reinforcement of Concre...
A Review on Innovative Fiber Integration for Enhanced Reinforcement of Concre...
 
Survey Paper on Cloud-Based Secured Healthcare System
Survey Paper on Cloud-Based Secured Healthcare SystemSurvey Paper on Cloud-Based Secured Healthcare System
Survey Paper on Cloud-Based Secured Healthcare System
 
Review on studies and research on widening of existing concrete bridges
Review on studies and research on widening of existing concrete bridgesReview on studies and research on widening of existing concrete bridges
Review on studies and research on widening of existing concrete bridges
 
React based fullstack edtech web application
React based fullstack edtech web applicationReact based fullstack edtech web application
React based fullstack edtech web application
 
A Comprehensive Review of Integrating IoT and Blockchain Technologies in the ...
A Comprehensive Review of Integrating IoT and Blockchain Technologies in the ...A Comprehensive Review of Integrating IoT and Blockchain Technologies in the ...
A Comprehensive Review of Integrating IoT and Blockchain Technologies in the ...
 
A REVIEW ON THE PERFORMANCE OF COCONUT FIBRE REINFORCED CONCRETE.
A REVIEW ON THE PERFORMANCE OF COCONUT FIBRE REINFORCED CONCRETE.A REVIEW ON THE PERFORMANCE OF COCONUT FIBRE REINFORCED CONCRETE.
A REVIEW ON THE PERFORMANCE OF COCONUT FIBRE REINFORCED CONCRETE.
 
Optimizing Business Management Process Workflows: The Dynamic Influence of Mi...
Optimizing Business Management Process Workflows: The Dynamic Influence of Mi...Optimizing Business Management Process Workflows: The Dynamic Influence of Mi...
Optimizing Business Management Process Workflows: The Dynamic Influence of Mi...
 
Multistoried and Multi Bay Steel Building Frame by using Seismic Design
Multistoried and Multi Bay Steel Building Frame by using Seismic DesignMultistoried and Multi Bay Steel Building Frame by using Seismic Design
Multistoried and Multi Bay Steel Building Frame by using Seismic Design
 
Cost Optimization of Construction Using Plastic Waste as a Sustainable Constr...
Cost Optimization of Construction Using Plastic Waste as a Sustainable Constr...Cost Optimization of Construction Using Plastic Waste as a Sustainable Constr...
Cost Optimization of Construction Using Plastic Waste as a Sustainable Constr...
 

Kürzlich hochgeladen

The Most Attractive Pune Call Girls Manchar 8250192130 Will You Miss This Cha...
The Most Attractive Pune Call Girls Manchar 8250192130 Will You Miss This Cha...The Most Attractive Pune Call Girls Manchar 8250192130 Will You Miss This Cha...
The Most Attractive Pune Call Girls Manchar 8250192130 Will You Miss This Cha...ranjana rawat
 
CCS335 _ Neural Networks and Deep Learning Laboratory_Lab Complete Record
CCS335 _ Neural Networks and Deep Learning Laboratory_Lab Complete RecordCCS335 _ Neural Networks and Deep Learning Laboratory_Lab Complete Record
CCS335 _ Neural Networks and Deep Learning Laboratory_Lab Complete RecordAsst.prof M.Gokilavani
 
notes on Evolution Of Analytic Scalability.ppt
notes on Evolution Of Analytic Scalability.pptnotes on Evolution Of Analytic Scalability.ppt
notes on Evolution Of Analytic Scalability.pptMsecMca
 
Bhosari ( Call Girls ) Pune 6297143586 Hot Model With Sexy Bhabi Ready For ...
Bhosari ( Call Girls ) Pune  6297143586  Hot Model With Sexy Bhabi Ready For ...Bhosari ( Call Girls ) Pune  6297143586  Hot Model With Sexy Bhabi Ready For ...
Bhosari ( Call Girls ) Pune 6297143586 Hot Model With Sexy Bhabi Ready For ...tanu pandey
 
VIP Model Call Girls Kothrud ( Pune ) Call ON 8005736733 Starting From 5K to ...
VIP Model Call Girls Kothrud ( Pune ) Call ON 8005736733 Starting From 5K to ...VIP Model Call Girls Kothrud ( Pune ) Call ON 8005736733 Starting From 5K to ...
VIP Model Call Girls Kothrud ( Pune ) Call ON 8005736733 Starting From 5K to ...SUHANI PANDEY
 
Call Girls Wakad Call Me 7737669865 Budget Friendly No Advance Booking
Call Girls Wakad Call Me 7737669865 Budget Friendly No Advance BookingCall Girls Wakad Call Me 7737669865 Budget Friendly No Advance Booking
Call Girls Wakad Call Me 7737669865 Budget Friendly No Advance Bookingroncy bisnoi
 
Call for Papers - Educational Administration: Theory and Practice, E-ISSN: 21...
Call for Papers - Educational Administration: Theory and Practice, E-ISSN: 21...Call for Papers - Educational Administration: Theory and Practice, E-ISSN: 21...
Call for Papers - Educational Administration: Theory and Practice, E-ISSN: 21...Christo Ananth
 
Top Rated Pune Call Girls Budhwar Peth ⟟ 6297143586 ⟟ Call Me For Genuine Se...
Top Rated  Pune Call Girls Budhwar Peth ⟟ 6297143586 ⟟ Call Me For Genuine Se...Top Rated  Pune Call Girls Budhwar Peth ⟟ 6297143586 ⟟ Call Me For Genuine Se...
Top Rated Pune Call Girls Budhwar Peth ⟟ 6297143586 ⟟ Call Me For Genuine Se...Call Girls in Nagpur High Profile
 
Intze Overhead Water Tank Design by Working Stress - IS Method.pdf
Intze Overhead Water Tank  Design by Working Stress - IS Method.pdfIntze Overhead Water Tank  Design by Working Stress - IS Method.pdf
Intze Overhead Water Tank Design by Working Stress - IS Method.pdfSuman Jyoti
 
AKTU Computer Networks notes --- Unit 3.pdf
AKTU Computer Networks notes ---  Unit 3.pdfAKTU Computer Networks notes ---  Unit 3.pdf
AKTU Computer Networks notes --- Unit 3.pdfankushspencer015
 
KubeKraft presentation @CloudNativeHooghly
KubeKraft presentation @CloudNativeHooghlyKubeKraft presentation @CloudNativeHooghly
KubeKraft presentation @CloudNativeHooghlysanyuktamishra911
 
Thermal Engineering-R & A / C - unit - V
Thermal Engineering-R & A / C - unit - VThermal Engineering-R & A / C - unit - V
Thermal Engineering-R & A / C - unit - VDineshKumar4165
 
The Most Attractive Pune Call Girls Budhwar Peth 8250192130 Will You Miss Thi...
The Most Attractive Pune Call Girls Budhwar Peth 8250192130 Will You Miss Thi...The Most Attractive Pune Call Girls Budhwar Peth 8250192130 Will You Miss Thi...
The Most Attractive Pune Call Girls Budhwar Peth 8250192130 Will You Miss Thi...ranjana rawat
 
Call for Papers - African Journal of Biological Sciences, E-ISSN: 2663-2187, ...
Call for Papers - African Journal of Biological Sciences, E-ISSN: 2663-2187, ...Call for Papers - African Journal of Biological Sciences, E-ISSN: 2663-2187, ...
Call for Papers - African Journal of Biological Sciences, E-ISSN: 2663-2187, ...Christo Ananth
 

Kürzlich hochgeladen (20)

Roadmap to Membership of RICS - Pathways and Routes
Roadmap to Membership of RICS - Pathways and RoutesRoadmap to Membership of RICS - Pathways and Routes
Roadmap to Membership of RICS - Pathways and Routes
 
The Most Attractive Pune Call Girls Manchar 8250192130 Will You Miss This Cha...
The Most Attractive Pune Call Girls Manchar 8250192130 Will You Miss This Cha...The Most Attractive Pune Call Girls Manchar 8250192130 Will You Miss This Cha...
The Most Attractive Pune Call Girls Manchar 8250192130 Will You Miss This Cha...
 
(INDIRA) Call Girl Aurangabad Call Now 8617697112 Aurangabad Escorts 24x7
(INDIRA) Call Girl Aurangabad Call Now 8617697112 Aurangabad Escorts 24x7(INDIRA) Call Girl Aurangabad Call Now 8617697112 Aurangabad Escorts 24x7
(INDIRA) Call Girl Aurangabad Call Now 8617697112 Aurangabad Escorts 24x7
 
CCS335 _ Neural Networks and Deep Learning Laboratory_Lab Complete Record
CCS335 _ Neural Networks and Deep Learning Laboratory_Lab Complete RecordCCS335 _ Neural Networks and Deep Learning Laboratory_Lab Complete Record
CCS335 _ Neural Networks and Deep Learning Laboratory_Lab Complete Record
 
Water Industry Process Automation & Control Monthly - April 2024
Water Industry Process Automation & Control Monthly - April 2024Water Industry Process Automation & Control Monthly - April 2024
Water Industry Process Automation & Control Monthly - April 2024
 
notes on Evolution Of Analytic Scalability.ppt
notes on Evolution Of Analytic Scalability.pptnotes on Evolution Of Analytic Scalability.ppt
notes on Evolution Of Analytic Scalability.ppt
 
Bhosari ( Call Girls ) Pune 6297143586 Hot Model With Sexy Bhabi Ready For ...
Bhosari ( Call Girls ) Pune  6297143586  Hot Model With Sexy Bhabi Ready For ...Bhosari ( Call Girls ) Pune  6297143586  Hot Model With Sexy Bhabi Ready For ...
Bhosari ( Call Girls ) Pune 6297143586 Hot Model With Sexy Bhabi Ready For ...
 
NFPA 5000 2024 standard .
NFPA 5000 2024 standard                                  .NFPA 5000 2024 standard                                  .
NFPA 5000 2024 standard .
 
VIP Model Call Girls Kothrud ( Pune ) Call ON 8005736733 Starting From 5K to ...
VIP Model Call Girls Kothrud ( Pune ) Call ON 8005736733 Starting From 5K to ...VIP Model Call Girls Kothrud ( Pune ) Call ON 8005736733 Starting From 5K to ...
VIP Model Call Girls Kothrud ( Pune ) Call ON 8005736733 Starting From 5K to ...
 
Call Girls Wakad Call Me 7737669865 Budget Friendly No Advance Booking
Call Girls Wakad Call Me 7737669865 Budget Friendly No Advance BookingCall Girls Wakad Call Me 7737669865 Budget Friendly No Advance Booking
Call Girls Wakad Call Me 7737669865 Budget Friendly No Advance Booking
 
(INDIRA) Call Girl Bhosari Call Now 8617697112 Bhosari Escorts 24x7
(INDIRA) Call Girl Bhosari Call Now 8617697112 Bhosari Escorts 24x7(INDIRA) Call Girl Bhosari Call Now 8617697112 Bhosari Escorts 24x7
(INDIRA) Call Girl Bhosari Call Now 8617697112 Bhosari Escorts 24x7
 
Call for Papers - Educational Administration: Theory and Practice, E-ISSN: 21...
Call for Papers - Educational Administration: Theory and Practice, E-ISSN: 21...Call for Papers - Educational Administration: Theory and Practice, E-ISSN: 21...
Call for Papers - Educational Administration: Theory and Practice, E-ISSN: 21...
 
Top Rated Pune Call Girls Budhwar Peth ⟟ 6297143586 ⟟ Call Me For Genuine Se...
Top Rated  Pune Call Girls Budhwar Peth ⟟ 6297143586 ⟟ Call Me For Genuine Se...Top Rated  Pune Call Girls Budhwar Peth ⟟ 6297143586 ⟟ Call Me For Genuine Se...
Top Rated Pune Call Girls Budhwar Peth ⟟ 6297143586 ⟟ Call Me For Genuine Se...
 
Intze Overhead Water Tank Design by Working Stress - IS Method.pdf
Intze Overhead Water Tank  Design by Working Stress - IS Method.pdfIntze Overhead Water Tank  Design by Working Stress - IS Method.pdf
Intze Overhead Water Tank Design by Working Stress - IS Method.pdf
 
AKTU Computer Networks notes --- Unit 3.pdf
AKTU Computer Networks notes ---  Unit 3.pdfAKTU Computer Networks notes ---  Unit 3.pdf
AKTU Computer Networks notes --- Unit 3.pdf
 
KubeKraft presentation @CloudNativeHooghly
KubeKraft presentation @CloudNativeHooghlyKubeKraft presentation @CloudNativeHooghly
KubeKraft presentation @CloudNativeHooghly
 
Thermal Engineering-R & A / C - unit - V
Thermal Engineering-R & A / C - unit - VThermal Engineering-R & A / C - unit - V
Thermal Engineering-R & A / C - unit - V
 
The Most Attractive Pune Call Girls Budhwar Peth 8250192130 Will You Miss Thi...
The Most Attractive Pune Call Girls Budhwar Peth 8250192130 Will You Miss Thi...The Most Attractive Pune Call Girls Budhwar Peth 8250192130 Will You Miss Thi...
The Most Attractive Pune Call Girls Budhwar Peth 8250192130 Will You Miss Thi...
 
Call for Papers - African Journal of Biological Sciences, E-ISSN: 2663-2187, ...
Call for Papers - African Journal of Biological Sciences, E-ISSN: 2663-2187, ...Call for Papers - African Journal of Biological Sciences, E-ISSN: 2663-2187, ...
Call for Papers - African Journal of Biological Sciences, E-ISSN: 2663-2187, ...
 
(INDIRA) Call Girl Meerut Call Now 8617697112 Meerut Escorts 24x7
(INDIRA) Call Girl Meerut Call Now 8617697112 Meerut Escorts 24x7(INDIRA) Call Girl Meerut Call Now 8617697112 Meerut Escorts 24x7
(INDIRA) Call Girl Meerut Call Now 8617697112 Meerut Escorts 24x7
 

Carbon Emission Forecasting using ARIMA

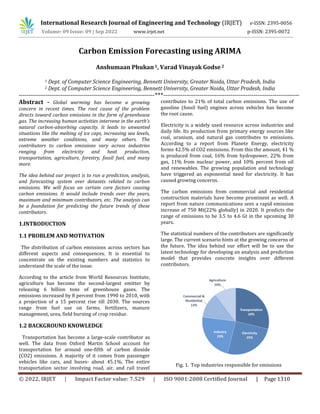
  • 1. International Research Journal of Engineering and Technology (IRJET) e-ISSN: 2395-0056 Volume: 09 Issue: 09 | Sep 2022 www.irjet.net p-ISSN: 2395-0072 © 2022, IRJET | Impact Factor value: 7.529 | ISO 9001:2008 Certified Journal | Page 1310 Carbon Emission Forecasting using ARIMA Anshumaan Phukan1, Varad Vinayak Godse 2 1 Dept. of Computer Science Engineering, Bennett University, Greater Noida, Uttar Pradesh, India 2 Dept. of Computer Science Engineering, Bennett University, Greater Noida, Uttar Pradesh, India -----------------------------------------------------------------------***----------------------------------------------------------------------- Abstract - Global warming has become a growing concern in recent times. The root cause of the problem directs toward carbon emissions in the form of greenhouse gas. The increasing human activities intervene in the earth's natural carbon-absorbing capacity. It leads to unwanted situations like the melting of ice caps, increasing sea levels, extreme weather conditions, and many others. The contributors to carbon emissions vary across industries ranging from electricity and heat production, transportation, agriculture, forestry, fossil fuel, and many more. The idea behind our project is to run a prediction, analysis, and forecasting system over datasets related to carbon emissions. We will focus on certain core factors causing carbon emissions. It would include trends over the years, maximum and minimum contributors, etc. The analysis can be a foundation for predicting the future trends of these contributors. 1.INTRODUCTION 1.1 PROBLEM AND MOTIVATION The distribution of carbon emissions across sectors has different aspects and consequences. It is essential to concentrate on the existing numbers and statistics to understand the scale of the issue. According to the article from World Resources Institute, agriculture has become the second-largest emitter by releasing 6 billion tons of greenhouse gases. The emissions increased by 8 percent from 1990 to 2010, with a projection of a 15 percent rise till 2030. The sources range from fuel use on farms, fertilizers, manure management, urea, field burning of crop residue. 1.2 BACKGROUND KNOWLEDGE Transportation has become a large-scale contributor as well. The data from Oxford Martin School account for transportation for around one-fifth of carbon dioxide (CO2) emissions. A majority of it comes from passenger vehicles like cars, and buses- about 45.1%. The entire transportation sector involving road, air, and rail travel contributes to 21% of total carbon emissions. The use of gasoline (fossil fuel) engines across vehicles has become the root cause. Electricity is a widely used resource across industries and daily life. Its production from primary energy sources like coal, uranium, and natural gas contributes to emissions. According to a report from Planete Energy, electricity forms 42.5% of CO2 emissions. From this the amount, 41 % is produced from coal, 16% from hydropower, 22% from gas, 11% from nuclear power, and 10% percent from oil and renewables. The growing population and technology have triggered an exponential need for electricity. It has caused growing concerns. The carbon emissions from commercial and residential construction materials have become prominent as well. A report from nature communications sees a rapid emission increase of 750 Mt(22% globally) in 2020. It predicts the range of emissions to be 3.5 to 4.6 Gt in the upcoming 30 years. The statistical numbers of the contributors are significantly large. The current scenario hints at the growing concerns of the future. The idea behind our effort will be to use the latest technology for developing an analysis and prediction model that provides concrete insights over different contributors. Fig. 1. Top industries responsible for emissions
  • 2. International Research Journal of Engineering and Technology (IRJET) e-ISSN: 2395-0056 Volume: 09 Issue: 09 | Sep 2022 www.irjet.net p-ISSN: 2395-0072 © 2022, IRJET | Impact Factor value: 7.529 | ISO 9001:2008 Certified Journal | Page 1311 As seen in the scan to the right, the patient has abnormal tissue in the brain, which can be spotted as a white highlight towards the center of the scan. Unique patterns such as these can be used to detect any malignant in the brain, further helping us classify whether the brain is abnormal. 2. RELATED WORK CO2 emissions is a big problem all around the planet. There are numerous studies begin conducted to reduce the CO2 emissions. There is an urgent need for a system that can estimate CO2 emissions and allow us to take appropriate actions to minimise the CO2 emissions. IN order to solve this problem machine learning can be used. The process of creating algorithms which can improve through experience is known as machine learning. For example, training a model which could automatically recognise fraud mails. Some models for prediction of CO2 emissions have been created employing machine learning. In 2015 Researcher Chairul Saleh created a model which predicted the CO2 emissions that make use of the Support Vector Machine algorithm in machine learning. Coal combustion and electrical energy were the input parameters for the model, both of which play a major role in CO2 emissions. In order to evaluate and train the model, the data from the Alcohol industry was obtained. In May of 2017, another team of researchers developed a model that described the quantity of CO2 released during the manufacturing of raw milk. Data from various milk manufacturing processes such as dairy processing and packaging waste disposal were provided to the model for predictions of CO2 emissions. According to the findings of the research, 1120 g CO2 is released per litre in manufacturing of raw milk products. 3.SYNOPSIS OF DATA The trends in carbon emissions depend on certain baseline core factors that cause larger impacts. The core factors vary as below- 1)Coal Sector (CO2 Emissions) 2)Natural Gas Sector CO2 Emissions 3)Distillate Fuel, Including Kerosene-Type Jet Fuel, Oil Sector CO2 Emissions 4)Petroleum Coke Sector CO2 Emissions 5)Residual Fuel Oil Sector CO2 Emissions 6)Petroleum Sector CO2 Emissions 7)Geothermal Energy Sector CO2 Emissions 8)Non-Biomass Waste Sector CO2 Emissions 9)Total Energy Sector CO2 Emissions The use of coal across various industries grew to 45 % globally between 2001 and 2010. The burning of coal to generate steams to run turbines for electricity, as a raw material for agricultural fertilizers, as core material for cement production in constructions, as a combustion source in railway and water transport made it a prominent source of carbon emissions. It is responsible for 46% of global carbon emissions and 72% of total Green House Gas(GHG) emissions. The emissions from natural gas are comparatively low but account for around half of what is caused by coal. A widescale use for generating electricity(steam generation units), fuel for transport (Compressed Natural Gas- CNG), heat for buildings, household use(refrigerator cooling), agriculture inputs(Pesticides, fertilizers, irrigation- cheaper than electricity) has caused a 43 percent increase since 2005. Although it contributes less compared to coal, it requires significant attention. Distillate fuels are fractions of petroleum formed as a result of distillation subdues. It includes diesel fuels, jet fuel, and fuel oil(marine fuel, furnace oil, heavy oil). In 2021, the sector emitted 81.92 metric tons of carbon. It causes emissions almost four times that of petroleum. The recent days witnessed limited use of diesel vehicles(not including heavy vehicles) and purer alternatives for jet and marine fuels. Petroleum coke is a carbon-rich by-product of crude oil refining. Its use in the aluminum industry, graphite electrodes for the steel industry, and fuel for cement kilns has caused growing concerns. It emits more greenhouse gases and air pollutants than raw coal. China initiated the early use, with an 18.9 percent rise between 2010-and 2016. The economic advantages of petroleum coke benefit many industries across the globe. Petroleum is a widely used resource across industries and daily lives. A largescale application as fuel for vehicles extends to ammonia for fertilizers, heating furnaces, petrochemical industry, and Lubricants. It also produces many harmful by-products. The sector emitted 1.22 million metric tons of carbon dioxide in 2013. In 2020, a 6.3 percent decline in emissions marked the growth rate over the decade.
  • 3. International Research Journal of Engineering and Technology (IRJET) e-ISSN: 2395-0056 Volume: 09 Issue: 09 | Sep 2022 www.irjet.net p-ISSN: 2395-0072 © 2022, IRJET | Impact Factor value: 7.529 | ISO 9001:2008 Certified Journal | Page 1312 Geothermal energy uses heat from the earth's core by producing minimal waste products. It emits 38 grams of Carbon dioxide per kilowatt of electricity produced. The minimal emissions from the sector introduce the need to monitor to avoid overexploitation. Non-biomass sectors like nuclear energy produce zero carbon emissions, but the production processes(extraction and transport of uranium, nuclear waste generation) cause harmful effects. The data is from the US Energy Information Administration, and it is a time series data that spans from January 1973 to July 2016. It is a comprehensive collection of carbon emission values spanning several years and involves various energy sectors such as geothermal energy, natural gas, petroleum coke, and so on. With the use of such data throughout constant time intervals, we may run carbon emission forecasting models like ARIMA. It would be useful in cases when vital decisions must be made based on predicted emission values. 4.INTRODUCTION Approach We plan to achieve our goal by using a combination of machine learning and neural networks to forecast carbon emissions based on meaningful data. Hypothesis testing would play a prominent role in our data analysis section. Hypothesis testing is a type of statistical method of drawing conclusions about a probability distribution or population parameter using data from a designated sample. It would be useful for our scenario because it allows us to evaluate 2 mutual exclusive statements, create an assumption and perform statistical analysis to reject or accept the hypothesis. In our use case, tests such as the Chi-Square test, T-Test, and Annova Test will be used. The null hypothesis, abbreviated as H0, would be our assumption. If statistical testing rejects our null hypothesis, we will define an alternate hypothesis. As a result, we can clearly deduce the relationships between individual carbon emission variables and total emission levels using these methodologies. After understanding our data, the necessary feature engineering and selection procedures would be followed to ensure our model can predict carbon emissions with maximum accuracy. Techniques like mutual info index, correlation matrix, and variance threshold would play a huge role in selecting features that affect our prediction the most. Taking too many useful features can also result in a dimensionality curse. Feature extraction techniques like principal component analysis could help us in reducing dimensions by creating eigenvalues and eigenvectors. After acquiring the preprocessed data, numerous statistical models and neural networks will be trained on it. This study will employ models such as linear regression, polynomial regression, locally weighted regression, KNN, naive Bayes, SVM with different kernels, ensemble approaches with different base learners, and ANN. The base machine learning models like regression will be our introductory approach, which would be followed by the implementation of advanced techniques. If the scatter plot portrays clear subdivisions among our dataset, models like KNN and SVM would be our first priority. Bagging and boosting ensemble techniques like decision tree, AdaBoost, gradient boost, and xgboost will help us combine several base models to produce one optimal predictive model. These techniques are also called as free lunch model as no single model wins. The aim of ensemble models is to build strong learning based on weak learners. The final model would be the custom neural network with different experimental optimizers, activation functions, and weight initialization techniques. Finally, we will perform a detailed investigation of our findings and discoveries using visualizations and hyperparameter tuning to determine the parameters and model combinations that will provide the best forecast. 5.PROPOSED METHODOLGY The dataset consists of time-series data points collected at constant time intervals. The time-dependent or dynamic nature of the problem requires time-series modeling. It is a powerful tool for extracting current data and making future predictions and forecasting. The overview of the steps for the final output involves the retrieval of the CSV time-series data, transforming or pre- processing of the data for suitable input, visualizing the data, applying different methods for testing whether it is stationary, transforming time-series data to stationary, finding optimal parameters to build SARIMA model, diagnosing, and validating the predictions and forecasting. RETRIEVAL The read_csv function of pandas extracts the data in the form of a data frame. The info() function provides specifications describing 5096 observations with six columns. The data type of four columns is an object, while two have an integer. The current data frame does not
  • 4. International Research Journal of Engineering and Technology (IRJET) e-ISSN: 2395-0056 Volume: 09 Issue: 09 | Sep 2022 www.irjet.net p-ISSN: 2395-0072 © 2022, IRJET | Impact Factor value: 7.529 | ISO 9001:2008 Certified Journal | Page 1313 represent a time series. The read_csv function needs specialized arguments to bring the data in the form of time series. The arguments go as follows-  parse_dates: Identifies the key for the date-time column. The initial dates come in string format. For example 'YYYYMM'  index_col: Shifts DateTime column into index column.  date_parser: Converts an input string into a DateTime variable. Further pre-processing involves dropping null rows and null values in the index column using functions like notNull() and dropNa(). The coerce property with setting errors converts columns to float and fills problematic entries with Null(NaN). The to_numeric function converts the emission value column from object to numeric. ANAYLYSIS TEST STATIONARY The dataset is analyzed to observe any trends and seasonality. The presence makes it nonstationary data. The removal of nonstationary elements converts the dataset into stationary. The residuals from the process form the base for further analysis. Stationary Process- A stationary process has a probability distribution that remains unchanged with time. The parameters like mean and variance do not change over time. The most common violation of stationarity comes from trends in mean. If the cause of non-stationarity is the unit root, then it is not mean-reverting. If it is a deterministic trend, it can transform to stationarity. The analysis occurs with a single category of Natural gas CO2 emissions. The same steps can repeat for others. The group-by function creates data frames with columns corresponding to the categories and having emission values. The index column has date-time entries. GRAPH METHOD The plot method from MatPlotlib generates a graph. It has emission values on the y-axis and DateTime(in years) data on the x-axis. The structure and trends of the plot can help to observe stationarity. DICKY-FULLER TEST The test considers a null hypothesis. In this case, the null hypothesis is- that the time series is nonstationary. A Test statistic gets compared with critical values at different confidence values. If the critical value exceeds the Statistic, the null hypothesis gets rejected. The time series is stationary. The opposite case accepts the null hypothesis keeping the time-series data non-stationary. The Adler function from python takes the data and lag parameters. A lag describes the delay time between two sets of observations. Methods like Akaike Information Criterion(AIC) determine the optimal number of lags. The auto lag parameters set the number of lags to minimize the AIC. The test provides a p-value which gets compared to the user-provided cutoff. It also gives a test statistic that compares critical values at different confidence levels. CONVERSION TO STATIONARY The technique focuses on taking the mean of a set of consecutive values. We target a yearly trend that requires an average of 12 consecutive values or months. The value in each entry in the column is the mean of the previous 12 values. The first 11 values remain null as they do not have a sufficient number of values prior(12). The original data gets subtracted from the new data of the moving average. It gets tested through the dicky fuller test that tells whether the conversion to stationarity is successful. The technique uses the rolling method from python. Adding seasonal terms to an ARIMA model results in a model called SARIMA. This model is characterized by 3 terms: P: order of the auto regressive term Q: order of moving average term D: number of differencing required to convert non stationary time series data to stationary. When a seasonal ARIMA model needs to be fitted, our goal should be to determine the parameters that are responsible for optimizing the metric of interest. While implementing
  • 5. International Research Journal of Engineering and Technology (IRJET) e-ISSN: 2395-0056 Volume: 09 Issue: 09 | Sep 2022 www.irjet.net p-ISSN: 2395-0072 © 2022, IRJET | Impact Factor value: 7.529 | ISO 9001:2008 Certified Journal | Page 1314 seasonal ARIMA, we considered two possible scenarios. First one being a stationary time series data with no dependence. In this case, residuals were modeled as white noise. The second case would involve a time series data with noticeable dependence among values. We specifically needed to implement statistical model like ARIMA in the second scenario. For forecasting stationary time series data, the ARIMA model, which is a linear function akin to linear regression, is commonly utilized. For finding optimal parameters, we implemented two major techniques: Plotting of ACF and PACF curve. Autocorrelation Function and Partial Autocorrelation Function are both responsible for measuring correlation between ts (time series) with a lagged version of itself. But in the case of PACF, elimination of variations are already explained beforehand by intervening comparisons. As a result, these two graphs will be used to determine the model's tuning parameters (p and q). Second method involves Grid Search for optimizing parameters. This method was included as it a more systematic approach compared to the previous one. It is an iterative technique of exploring all possible combination of parameters of our forecasting model. Seasonal ARIMA model will be fitted all combinations. After exploration, parameters that yield the best performance will be opted. A function called SARIMAX() was used in our case to perform hyperparameter optimization. 6.RESULTS STATIONARITY The result of the first adder fuller test yielded a greater val ue of -1.827631 for Test Static compared to the critical val ues at different confidence levels. The initial critical value was set at 0.01. The confidence levels were set at 95, 90%, 99%. It means 5%( -2.867303), 10%(-2.569840) and 1% ( -3.443418)of the critical value. The moving average method results in test static(-5.98541 9e+00) lesser than critical values 10%(-2.569840), 1% (-3. 443418) and 5%( -2.867303) EVALUATION For performing evaluation, we first plotted the Autocorrelation Function (ACF) and Partial Autocorrelation Function (PACF) curve for our seasonal ARIMA model. As finding the optimal parameters manually graphs is time consuming, we opted for grid search method. Using this method, we explored each and every possible combination of parameters possible. When analyzing and comparing statistical models with various parameters, each can be rated against the others based on how well they fit the data or their ability to properly forecast future data points. A statistical value called AIC was used for the scenario. For this example, we are taking emission values only for Coal Electric Power Sector. The Akaike Information Criterion value measures how well a model fits our training data. It is calculated using the number of independent variables, and the maximum likelihood estimate of the model. AIC values are only useful in comparison scenarios. A lower score of AIC indicates our model is performing well. After performing hyperparameter tuning through grid search, the SARIMAX
  • 6. International Research Journal of Engineering and Technology (IRJET) e-ISSN: 2395-0056 Volume: 09 Issue: 09 | Sep 2022 www.irjet.net p-ISSN: 2395-0072 © 2022, IRJET | Impact Factor value: 7.529 | ISO 9001:2008 Certified Journal | Page 1315 (1, 1, 1)x(0, 1, 1, 12) yielded the lowest AIC score of 2003.553. Hence, we considered these conditions for our proposed model. Next step we went for in-depth analysis of the model with the above-mentioned parameters. Fig: State-space model result for Coal Electric Power Sector The next analysis would plot the residual errors for our seasonal ARIMA model. Fig: Residual errors for SARIMA for coal power generation The residual error distribution is depicted in the diagram. It shows that the prediction is a little skewed. Fig: Diagnostic Plot The red KDE line in the top right plot closely resembles the N(0,1) line. This indicates the residual residuals are normally distributed. However, we can observe some deviations in the straight line, indicating the normal distribution is not perfect for the distribution of errors in the forecast, but it is defiantly acceptable. The qq-plot at the bottom left again indicated our residuals are normally distributed. After we obtained our model for time series forecasting, we started comparing the predicted and real values of the data. We got the values and accompanying confidence intervals for time series forecasts using the get prediction() and conf_int() properties. Fig: One step ahead forecast The table above portrays one-step forecasts at each point using the entire historical data until the current point.
  • 7. International Research Journal of Engineering and Technology (IRJET) e-ISSN: 2395-0056 Volume: 09 Issue: 09 | Sep 2022 www.irjet.net p-ISSN: 2395-0072 © 2022, IRJET | Impact Factor value: 7.529 | ISO 9001:2008 Certified Journal | Page 1316 Fig: Real vs Forecasted values of CO2 emissions for coal power generation Overall, our forecasts closely match the true numbers, indicating a similar pattern of behavior. The model we built gave us an MSE score of 14.39 and an RMSE score of 3.7936, which is fairly low. The model's pur pose was to achieve high-quality predictive power throug h dynamic forecasting. FORECASTING The get_forecast method undertakes the total number of st eps to forecast. The conf_init() method provides confidenc e intervals . A confidence interval has a set of values withi n which the parameter can lie. The data from the above function is used to draw the plots to display the forecast for different categories. The highlighted area in green color represents the other p ossible variations in the forecasted values. The forecasting model performs better when it is less. The natural gas forecast shows an upward trend for the ne xt ten years. The green area remains shorter as a result of a good prediction. The coal forecast shows a downward trend highlighting th e decreased use of coal in the future. The shorter green are a corresponds to a good prediction. The distillate fuel category witnesses a slightly decreasing but almost constant trend. The larger green area suggests more variations in the forecasted line. The petroleum category witnesses a slightly decreasing tr end. It consists of variations in the forecasted line. The total energy plot combining every sector shows a down ward trend with negligible variations. 7.CONCLUSION The categories like natural gas and coal are used widely an d have led to environmental consequences. The growing tre nd in natural gas is alarming, but a decreasing trend in coal highlights an improved scenario. Other categories like petroleum and distillate have constant growth. The patterns and trends forecasted by the model prove ess ential as it helps to understand the future. The global aim of achieving net carbon emission to zero by 2050 needs conti nuous analysis and predictions over the current scenarios. The current emission trend might seem constant or decrea sing, but the situation will deteriorate because the present emissions have effects in the far future. Hypothetically, if w e reduce the net emissions to zero at once, the impact of rec ent emissions will trigger the problem again. The use of technology to analyze datasets for generating ins ights plays a significant role. The various machine learning techniques extended by python libraries help run efficient and useful predictions and forecasts. We focussed on the techniques to generate a forecasting an alysis that is useful to environmentalists, researchers, and others working towards the cause.
  • 8. International Research Journal of Engineering and Technology (IRJET) e-ISSN: 2395-0056 Volume: 09 Issue: 09 | Sep 2022 www.irjet.net p-ISSN: 2395-0072 © 2022, IRJET | Impact Factor value: 7.529 | ISO 9001:2008 Certified Journal | Page 1317 REFERENCES  https://www.wri.org/insights/4-charts- explain-greenhouse-gas-emissions-countries- and-sectors  http://www.annualreviews.org/doi/abs/10.1 146/annurev-environ-032310-112100  https://www.planete- energies.com/en/medias/close/electricity- generation-and-related-co2-emissions  https://machinelearningmastery.com/arima- for-time-series-forecasting-with-python/  https://www.machinelearningplus.com/time- series/augmented-dickey-fuller-test/  https://machinelearningmastery.com/moving -average-smoothing-for-time-series- forecasting-python/  https://neptune.ai/blog/select-model-for- time-series-prediction-task  https://towardsdatascience.com/identifying- ar-and-ma-terms-using-acf-and-pacf-plots-in- time-series-forecasting- ccb9fd073db8?gi=e940575f86f8  https://www.yourdatateacher.com/2021/05/ 19/hyperparameter-tuning-grid-search-and- random-search/  https://robert-alvarez.github.io/2018-06-04- diagnostic_plots/  https://pandas.pydata.org/docs/reference/api /pandas.read_csv.html