SlideShare ist ein Scribd-Unternehmen logo
1 von 7
Downloaden Sie, um offline zu lesen
� Corporate Finance Institute. All rights reserved. Startup year Terminal year
2016 2017 2018 2019 2020 2021 2022
Balance Sheet Check OK OK OK OK OK OK OK
Assumptions
Site Traffic (Avg monthly visits)
Email 0 5,000 10,000 20,000 30,000 50,000 60,000
Organic Search 10,000 50,000 100,000 130,000 155,000 170,000 180,000
Paid Search 30,000 20,000 10,000 10,000 10,000 10,000 10,000
Affiliates 20,000 10,000 5,000 5,000 5,000 5,000 5,000
Total Monthly Visits 60,000 85,000 125,000 165,000 200,000 235,000 255,000
Growth Rate 41.7% 47.1% 32.0% 21.2% 17.5% 8.5%
Site Traffic (Annual) 12
Email 0 60,000 120,000 240,000 360,000 600,000 720,000
Organic Search 120,000 600,000 1,200,000 1,560,000 1,860,000 2,040,000 2,160,000
Paid Search 360,000 240,000 120,000 120,000 120,000 120,000 120,000
Affiliates 240,000 120,000 60,000 60,000 60,000 60,000 60,000
Total Annual Visits 720,000 1,020,000 1,500,000 1,980,000 2,400,000 2,820,000 3,060,000
Conversion Rates
Email 6.0% 6.0% 6.0% 6.0% 6.0% 6.0% 6.0%
Organic Search 2.0% 2.0% 2.0% 2.0% 2.0% 2.0% 2.0%
Paid Search 2.2% 2.2% 2.2% 2.2% 2.2% 2.2% 2.2%
Affiliates 4.0% 4.0% 4.0% 4.0% 4.0% 4.0% 4.0%
Total Monthly Visits 2.8% 2.5% 2.4% 2.6% 2.7% 2.9% 3.0%
Orders Placed
Email 0 3,600 7,200 14,400 21,600 36,000 43,200
Organic Search 2,400 12,000 24,000 31,200 37,200 40,800 43,200
Paid Search 7,920 5,280 2,640 2,640 2,640 2,640 2,640
Affiliates 9,600 4,800 2,400 2,400 2,400 2,400 2,400
Total Orders Placed 19,920 25,680 36,240 50,640 63,840 81,840 91,440
Order Details
Average item value (gross) 250 250 250 250 250 250 250
# of items per order 1.1 1.2 1.3 1.4 1.5 1.6 1.7
Average markdown 10% 10% 10% 10% 10% 10% 10%
Average promotion/discount 20% 18% 15% 12% 10% 8% 8%
Cost of Goods Sold (Gross Product Marin) 50% 50% 50% 50% 50% 50% 50%
Average Gross order value 275 300 325 350 375 400 425
Average Net order value 193 216 244 273 300 328 349
Customers
Churn Rate 25% 25% 25% 25% 25% 25% 25%
Opening active customer base 0 14,940 27,765 42,604 59,133 76,030 91,402
Plus new customers 19,920 22,080 29,040 36,240 42,240 45,840 48,240
Subtotal 19,920 37,020 56,805 78,844 101,373 121,870 139,642
Less churned customers 4,980 9,255 14,201 19,711 25,343 30,467 34,911
Closing customer base 14,940 27,765 42,604 59,133 76,030 91,402 104,732
� Corporate Finance Institute. All rights reserved. Startup year Terminal year
2016 2017 2018 2019 2020 2021 2022
Balance Sheet Check OK OK OK OK OK OK OK
Marketing Expenses
Variable
Email (cost per click) 0.00 0.00 0.00 0.00 0.00 0.00 0.00
Organic Search (cost per click) 0.00 0.00 0.00 0.00 0.00 0.00 0.00
Paid Search (cost per click) 3.00 3.25 3.25 3.50 3.50 3.75 4.00
Affiliates (cost per click) 5.00 5.00 5.00 5.00 5.00 5.00 5.00
Average 3.17 1.35 0.46 0.36 0.30 0.27 0.25
Order Fulfilment
Variable
Freight/shipping per order 12.00 10.00 9.00 9.00 8.00 8.00 7.00
Labor/handling per order 5.00 5.00 5.00 5.00 5.00 5.00 5.00
Total 17.00 15.00 14.00 14.00 13.00 13.00 12.00
Fixed
Warehouse rent 150,000 150,000 150,000 250,000 250,000 500,000 500,000
General & Administrative
Fixed
Office rent 100,000 100,000 100,000 200,000 200,000 200,000 200,000
Salaries, wages & Benefits 500,000 700,000 1,000,000 1,200,000 1,500,000 2,000,000 3,000,000
Professional fees 100,000 100,000 100,000 200,000 200,000 200,000 200,000
Other 100,000 100,000 200,000 200,000 400,000 400,000 400,000
Total 800,000 1,000,000 1,400,000 1,800,000 2,300,000 2,800,000 3,800,000
Balance Sheet Items
Current Assets
Accounts Receivable Days 5 5 5 5 5 5 5
Inventory Days 120 100 90 90 90 90 90
Inventory Turns 365 3.0 3.7 4.1 4.1 4.1 4.1 4.1
Current Liabilities
Accounts Payable Days 60 50 40 30 30 30 30
Capital Expenditures
Technology Development 300,000 50,000 50,000 500,000 50,000 1,000,000 100,000
Office Equipment 200,000 50,000 50,000 50,000 200,000 100,000 500,000
Acquisitions 0 0 0 0 0 0 0
Depreciation
Technology - Straight-line Years 5 5 5 5 5 5 5
Office Equipment - Straight-line Years 5 5 5 5 5 5 5
Financing
Interest Rate 3.00% 3.00% 3.00% 3.00% 3.00% 3.00% 3.00%
Debt Issued (Repaid) 0 0 0 0 0 0 0
Equity Raised (Repurchased) 8,000,000 0 0 0 0 0 0
Dividends Paid 0 0 0 0 0 0 0
Valuation
Tax Rate 25% 25% 25% 25% 25% 25% 25%
Cost of Capital / Discount Rate 20% 20% 20% 20% 20% 20% 20% 20%
Terminal Value Exit Multiple 8.0x
� Corporate Finance Institute. All rights reserved. Startup year Terminal year
2016 2017 2018 2019 2020 2021 2022
Balance Sheet Check OK OK OK OK OK OK OK
Income Statement
Gross Revenue 5,478,000 7,704,000 11,778,000 17,724,000 23,940,000 32,736,000 38,862,000
Discounts, Promotions, Markdowns (1,643,400) (2,157,120) (2,944,500) (3,899,280) (4,788,000) (5,892,480) (6,995,160)
Net Revenue 3,834,600 5,546,880 8,833,500 13,824,720 19,152,000 26,843,520 31,866,840
Cost of Goods Sold 2,739,000 3,852,000 5,889,000 8,862,000 11,970,000 16,368,000 19,431,000
Gross Profit 1,095,600 1,694,880 2,944,500 4,962,720 7,182,000 10,475,520 12,435,840
Gross Margin 28.6% 30.6% 33.3% 35.9% 37.5% 39.0% 39.0%
Variable Operating Expenses
Marketing 2,280,000 1,380,000 690,000 720,000 720,000 750,000 780,000
Fulfilment 338,640 385,200 507,360 708,960 829,920 1,063,920 1,097,280
Total Variable Costs 2,618,640 1,765,200 1,197,360 1,428,960 1,549,920 1,813,920 1,877,280
Contribution Margin (1,523,040) (70,320) 1,747,140 3,533,760 5,632,080 8,661,600 10,558,560
Margin -39.7% -1.3% 19.8% 25.6% 29.4% 32.3% 33.1%
Fixed Operating Expenses
Fulfilment 150,000 150,000 150,000 250,000 250,000 500,000 500,000
General & Administrative 800,000 1,000,000 1,400,000 1,800,000 2,300,000 2,800,000 3,800,000
Total 950,000 1,150,000 1,550,000 2,050,000 2,550,000 3,300,000 4,300,000
EBITDA (2,473,040) (1,220,320) 197,140 1,483,760 3,082,080 5,361,600 6,258,560
Margin -64.5% -22.0% 2.2% 10.7% 16.1% 20.0% 19.6%
Depreciation 100,000 120,000 140,000 250,000 300,000 420,000 520,000
Interest 0 0 0 0 0 0 0
Earnings Before Tax (2,573,040) (1,340,320) 57,140 1,233,760 2,782,080 4,941,600 5,738,560
Taxes 0 0 14,285 308,440 695,520 1,235,400 1,434,640
Net Income (2,573,040) (1,340,320) 42,855 925,320 2,086,560 3,706,200 4,303,920
Dividends Paid 0 0 0 0 0 0 0
� Corporate Finance Institute. All rights reserved. Startup year Terminal year
2016 2017 2018 2019 2020 2021 2022
Balance Sheet Check OK OK OK OK OK OK OK
Balance Sheet
ASSETS
Current
Cash 4,954,646 3,344,792 2,992,993 2,886,117 4,448,738 6,668,315 10,325,123
Accounts Receivable 52,529 75,985 121,007 189,380 262,356 367,719 436,532
Inventory 900,493 1,055,342 1,452,082 2,185,151 2,951,507 4,035,945 4,791,205
Total 5,907,668 4,476,119 4,566,082 5,260,647 7,662,601 11,071,979 15,552,860
Technology 240,000 220,000 190,000 510,000 370,000 1,040,000 800,000
Property & Equipment 160,000 160,000 150,000 130,000 220,000 230,000 550,000
Total Assets 6,307,668 4,856,119 4,906,082 5,900,647 8,252,601 12,341,979 16,902,860
LIABILITIES & SHAREHOLDER EQUITY
Liabilities
Current
Revolver
Accounts Payable 880,708 769,479 776,587 845,832 1,111,226 1,494,404 1,751,365
Total 880,708 769,479 776,587 845,832 1,111,226 1,494,404 1,751,365
Debt 0 0 0 0 0 0 0
Total Liabilities 880,708 769,479 776,587 845,832 1,111,226 1,494,404 1,751,365
Shareholder Equity
Share Capital 8,000,000 8,000,000 8,000,000 8,000,000 8,000,000 8,000,000 8,000,000
Retained Earnings (2,573,040) (3,913,360) (3,870,505) (2,945,185) (858,625) 2,847,575 7,151,495
Total Shareholder Equity 5,426,960 4,086,640 4,129,495 5,054,815 7,141,375 10,847,575 15,151,495
Total Liabilities & Shareholder Equity 6,307,668 4,856,119 4,906,082 5,900,647 8,252,601 12,341,979 16,902,860
Check 0.000 0.000 0.000 0.000 0.000 0.000 0.000
Cash Flow Statement
Cash from Operations
Net Income (2,573,040) (1,340,320) 42,855 925,320 2,086,560 3,706,200 4,303,920
Depreciation 100,000 120,000 140,000 250,000 300,000 420,000 520,000
Changes in non cash working capital
Accounts Receivable 52,529 23,456 45,022 68,373 72,976 105,363 68,813
Inventory 900,493 154,849 396,740 733,068 766,356 1,084,438 755,260
Accounts Payable 880,708 (111,228) 7,108 69,245 265,394 383,178 256,961
Total (2,545,354) (1,509,854) (251,799) 443,124 1,812,621 3,319,576 4,256,808
Cash Invested
Capital Expenditures 500,000 100,000 100,000 550,000 250,000 1,100,000 600,000
Acquisitions 0 0 0 0 0 0 0
Total 500,000 100,000 100,000 550,000 250,000 1,100,000 600,000
Cash from Financing
Increase (decrease) in Debt 0 0 0 0 0 0 0
Equity Issued (repurchased) 8,000,000 0 0 0 0 0 0
Dividends Paid 0 0 0 0 0 0 0
Total 8,000,000 0 0 0 0 0 0
Total Cash 4,954,646 (1,609,854) (351,799) (106,876) 1,562,621 2,219,576 3,656,808
Opening balance 0 4,954,646 3,344,792 2,992,993 2,886,117 4,448,738 6,668,315
Increase (Decrease) 4,954,646 (1,609,854) (351,799) (106,876) 1,562,621 2,219,576 3,656,808
Closing balance 4,954,646 3,344,792 2,992,993 2,886,117 4,448,738 6,668,315 10,325,123
� Corporate Finance Institute. All rights reserved. Startup year Terminal year
2016 2017 2018 2019 2020 2021 2022
Balance Sheet Check OK OK OK OK OK OK OK
Supporting Schedules
Capital Assets
Opening Balance
Technology 0 240,000 220,000 190,000 510,000 370,000 1,040,000
Property & Equipment 0 160,000 160,000 150,000 130,000 220,000 230,000
Total 0 400,000 380,000 340,000 640,000 590,000 1,270,000
Additions
Technology 300,000 50,000 50,000 500,000 50,000 1,000,000 100,000
Property & Equipment 200,000 50,000 50,000 50,000 200,000 100,000 500,000
Total 500,000 100,000 100,000 550,000 250,000 1,100,000 600,000
Subtotal
Technology 300,000 290,000 270,000 690,000 560,000 1,370,000 1,140,000
Property & Equipment 200,000 210,000 210,000 200,000 330,000 320,000 730,000
Total 500,000 500,000 480,000 890,000 890,000 1,690,000 1,870,000
Depreciation
Technology
2016 60,000 60,000 60,000 60,000 60,000 0 0
2017 10,000 10,000 10,000 10,000 10,000 0
2018 10,000 10,000 10,000 10,000 10,000
2019 100,000 100,000 100,000 100,000
2020 10,000 10,000 10,000
2021 200,000 200,000
2022 20,000
Subtotal 60,000 70,000 80,000 180,000 190,000 330,000 340,000
Property & Equipment
2016 40,000 40,000 40,000 40,000 40,000 0 0
2017 10,000 10,000 10,000 10,000 10,000 0
2018 10,000 10,000 10,000 10,000 10,000
2019 10,000 10,000 10,000 10,000
2020 40,000 40,000 40,000
2021 20,000 20,000
2022 100,000
Subtotal 40,000 50,000 60,000 70,000 110,000 90,000 180,000
Total 100,000 120,000 140,000 250,000 300,000 420,000 520,000
Closing Balance
Technology 240,000 220,000 190,000 510,000 370,000 1,040,000 800,000
Property & Equipment 160,000 160,000 150,000 130,000 220,000 230,000 550,000
Total 400,000 380,000 340,000 640,000 590,000 1,270,000 1,350,000
Debt Schedule
Opening Balance 0 0 0 0 0 0 0
Debt Issued (Repaid) 0 0 0 0 0 0 0
Closing Balance 0 0 0 0 0 0 0
Interest on Debt 0 0 0 0 0 0 0
� Corporate Finance Institute. All rights reserved. Startup year Terminal year
2016 2017 2018 2019 2020 2021 2022
Balance Sheet Check OK OK OK OK OK OK OK
Customer Metrics
Customer Acquisition Cost (CAC) 130 137 137 143 143 149 155
Contribution Margin Per Order 38 51 67 84 100 115 124
Customer Lifetime Value (LTV) 152 204 269 336 398 460 496
LTV/CAC Ratio 1.2x 1.5x 2.0x 2.4x 2.8x 3.1x 3.2x
Payback (# of orders) 3.4 2.7 2.0 1.7 1.4 1.3 1.2
Valuation
EBT (2,573,040) (1,340,320) 57,140 1,233,760 2,782,080 4,941,600 5,738,560
Net Operating Loss
Opening Balance 0 2,573,040 3,913,360 3,856,220 2,622,460 0 0
Current Loss 2,573,040 1,340,320 0 0 0 0 0
Sub Total 2,573,040 3,913,360 3,913,360 3,856,220 2,622,460 0 0
Loss Used 0 0 57,140 1,233,760 2,622,460 0 0
Closing Balance 2,573,040 3,913,360 3,856,220 2,622,460 0 0 0
Free Cash Flow
Earning Before Tax (2,573,040) (1,340,320) 57,140 1,233,760 2,782,080 4,941,600 5,738,560
Interest 0 0 0 0 0 0 0
EBIT (2,573,040) (1,340,320) 57,140 1,233,760 2,782,080 4,941,600 5,738,560
Less Taxes 0 0 0 0 695,520 1,235,400 1,434,640
Less Capex 500,000 100,000 100,000 550,000 250,000 1,100,000 600,000
Plus Depreciation 100,000 120,000 140,000 250,000 300,000 420,000 520,000
Less Changes in Working Capital 72,314 289,534 434,654 732,196 573,939 806,624 567,112
Unlevered Free Cash Flow (3,045,354) (1,609,854) (337,514) 201,564 1,562,621 2,219,576 3,656,808
DCF Valuation
NPV of Forecast 20% (1,362,003)
Terminal Value (EBITDA multiple) 8.0x 50,068,480
NPV of Terminal Value 13,973,194
Total Enterprise Value 12,611,191
EV/Revenue (2017E) 1.6x
% of Business Retained after raise 61%
� Corporate Finance Institute. All rights reserved. Startup year Terminal year
2016 2017 2018 2019 2020 2021 2022
Balance Sheet Check OK OK OK OK OK OK OK
Charts & Graphs
Revenue 3,834,600 5,546,880 8,833,500 13,824,720 19,152,000 26,843,520 31,866,840
Gross Margin 28.6% 30.6% 33.3% 35.9% 37.5% 39.0% 39.0%
EBITDA Margin -64.5% -22.0% 2.2% 10.7% 16.1% 20.0% 19.6%
Customer Acquisition Cost 130 137 137 143 143 149 155
Life Time Value 152 204 269 336 398 460 496
LTV/CAC 1.2x 1.5x 2.0x 2.4x 2.8x 3.1x 3.2x
Customer Acquisition Cost 130 137 137 143 143 149 155
Contribution Margin 38 51 67 84 100 115 124
Payback (# of orders) 3.4 2.7 2.0 1.7 1.4 1.3 1.2
Burn Rate (3,045,354) (1,609,854) (351,799) (106,876) 1,562,621 2,219,576 3,656,808
Cash Balance 8,000,000 4,954,646 3,344,792 2,992,993 2,886,117 4,448,738 6,668,315 10,325,123
-50%
-25%
0%
25%
50%
75%
100%
-$15
-$10
-$5
$0
$5
$10
$15
$20
$25
$30
$35
2016 2017 2018 2019 2020 2021 2022
MarginMargin
Revenue($millions)
Revenue
EBITDA Margin
0.0x
0.5x
1.0x
1.5x
2.0x
2.5x
3.0x
3.5x
4.0x
4.5x
5.0x
$0
$100
$200
$300
$400
$500
$600
2016 2017 2018 2019 2020 2021 2022
LTV/CACRatio
Customer Acquisition Cost
Life Time Value
0.0
1.0
2.0
3.0
4.0
5.0
$0
$50
$100
$150
$200
2016 2017 2018 2019 2020 2021 2022
Payback(#orders)
Customer Acquisition Cost
Contribution Margin
-$5
-$3
-$1
$1
$3
$5
$7
$9
$11
$13
2016 2017 2018 2019 2020 2021 2022
Burn($millions)
Burn Rate Cash Balance

Weitere ähnliche Inhalte

Was ist angesagt?

Financial ratios asian paints
Financial ratios   asian paintsFinancial ratios   asian paints
Financial ratios asian paints
Salil Nagvekar
 

Was ist angesagt? (20)

Hansson
HanssonHansson
Hansson
 
Casushandelsgeestblanco
CasushandelsgeestblancoCasushandelsgeestblanco
Casushandelsgeestblanco
 
Larsen & toubro.ppt_25
Larsen & toubro.ppt_25Larsen & toubro.ppt_25
Larsen & toubro.ppt_25
 
Final Exam 2014 - Financial Model
Final Exam 2014 - Financial ModelFinal Exam 2014 - Financial Model
Final Exam 2014 - Financial Model
 
Rahul Mehrotra Presentation on Reliance Financial Ratio
Rahul Mehrotra Presentation on Reliance Financial RatioRahul Mehrotra Presentation on Reliance Financial Ratio
Rahul Mehrotra Presentation on Reliance Financial Ratio
 
Tata Motors – Ratio Analysis
Tata Motors – Ratio AnalysisTata Motors – Ratio Analysis
Tata Motors – Ratio Analysis
 
Ssgc final report (29 04-2014)
Ssgc final report (29 04-2014)Ssgc final report (29 04-2014)
Ssgc final report (29 04-2014)
 
Wipro – Ratio Analysis
Wipro – Ratio AnalysisWipro – Ratio Analysis
Wipro – Ratio Analysis
 
NTPC Financial Modelling
NTPC Financial ModellingNTPC Financial Modelling
NTPC Financial Modelling
 
MF
MFMF
MF
 
Pay Forecast PowerPoint Presentation Slides
Pay Forecast PowerPoint Presentation Slides Pay Forecast PowerPoint Presentation Slides
Pay Forecast PowerPoint Presentation Slides
 
CEO Dashboard Template in Excel
CEO Dashboard Template in ExcelCEO Dashboard Template in Excel
CEO Dashboard Template in Excel
 
CFO Dashboard Template in Excel
CFO Dashboard Template in ExcelCFO Dashboard Template in Excel
CFO Dashboard Template in Excel
 
Finance Dashboard Template in Excel
Finance Dashboard Template in ExcelFinance Dashboard Template in Excel
Finance Dashboard Template in Excel
 
Example print out-efm-de
Example print out-efm-deExample print out-efm-de
Example print out-efm-de
 
Financial ratios asian paints
Financial ratios   asian paintsFinancial ratios   asian paints
Financial ratios asian paints
 
Private Equity.Venture Capital Fund VALUATION MODEL & BUSINESS PLAN. A Real E...
Private Equity.Venture Capital Fund VALUATION MODEL & BUSINESS PLAN. A Real E...Private Equity.Venture Capital Fund VALUATION MODEL & BUSINESS PLAN. A Real E...
Private Equity.Venture Capital Fund VALUATION MODEL & BUSINESS PLAN. A Real E...
 
Ip Final 2
Ip Final 2Ip Final 2
Ip Final 2
 
International Contractor Overviews Q2 2017
International Contractor Overviews Q2 2017International Contractor Overviews Q2 2017
International Contractor Overviews Q2 2017
 
GuessBox Financial Model 2017
GuessBox Financial Model 2017GuessBox Financial Model 2017
GuessBox Financial Model 2017
 

Ähnlich wie Income Statement Prediction

1. Prepare and analize the common statement for An.pdf
1. Prepare and analize the common statement for An.pdf1. Prepare and analize the common statement for An.pdf
1. Prepare and analize the common statement for An.pdf
lejeunehayneswowel96
 
How to Prepare Budgets & Projections
How to Prepare Budgets &  ProjectionsHow to Prepare Budgets &  Projections
How to Prepare Budgets & Projections
Traklight.com
 
Afternoon Sessions
Afternoon SessionsAfternoon Sessions
Afternoon Sessions
gmm0611
 
Wipro prediction of development and bankruptcy
Wipro prediction of development and bankruptcyWipro prediction of development and bankruptcy
Wipro prediction of development and bankruptcy
Shahbaz Alam
 
Brph institucional junho v9 eng (site)
Brph institucional junho v9 eng (site)Brph institucional junho v9 eng (site)
Brph institucional junho v9 eng (site)
brpharma
 
Brph institucional junho v11 eng (site) v2
Brph institucional junho v11 eng (site) v2Brph institucional junho v11 eng (site) v2
Brph institucional junho v11 eng (site) v2
brpharma
 
Financials1 P
Financials1 PFinancials1 P
Financials1 P
emronly
 

Ähnlich wie Income Statement Prediction (20)

Financial model
Financial modelFinancial model
Financial model
 
1. Prepare and analize the common statement for An.pdf
1. Prepare and analize the common statement for An.pdf1. Prepare and analize the common statement for An.pdf
1. Prepare and analize the common statement for An.pdf
 
How to Prepare Budgets & Projections
How to Prepare Budgets &  ProjectionsHow to Prepare Budgets &  Projections
How to Prepare Budgets & Projections
 
seegene 096530 Algorithm Investment Report
seegene 096530 Algorithm Investment Reportseegene 096530 Algorithm Investment Report
seegene 096530 Algorithm Investment Report
 
Financial Analysis with Microsoft Excel 7th Edition Mayes Solutions Manual
Financial Analysis with Microsoft Excel 7th Edition Mayes Solutions ManualFinancial Analysis with Microsoft Excel 7th Edition Mayes Solutions Manual
Financial Analysis with Microsoft Excel 7th Edition Mayes Solutions Manual
 
Synthetic Intelligence (2004)
Synthetic Intelligence (2004)Synthetic Intelligence (2004)
Synthetic Intelligence (2004)
 
Automated Index Tracking Investment FinTech - InveztEasy
Automated Index Tracking Investment FinTech - InveztEasyAutomated Index Tracking Investment FinTech - InveztEasy
Automated Index Tracking Investment FinTech - InveztEasy
 
Income Projection PowerPoint Presentation Slides
Income Projection PowerPoint Presentation SlidesIncome Projection PowerPoint Presentation Slides
Income Projection PowerPoint Presentation Slides
 
Revenue Forecasting PowerPoint Presentation Slides
Revenue Forecasting PowerPoint Presentation SlidesRevenue Forecasting PowerPoint Presentation Slides
Revenue Forecasting PowerPoint Presentation Slides
 
Afternoon Sessions
Afternoon SessionsAfternoon Sessions
Afternoon Sessions
 
Revenue Projection PowerPoint Presentation Slides
Revenue Projection PowerPoint Presentation SlidesRevenue Projection PowerPoint Presentation Slides
Revenue Projection PowerPoint Presentation Slides
 
Wipro prediction of development and bankruptcy
Wipro prediction of development and bankruptcyWipro prediction of development and bankruptcy
Wipro prediction of development and bankruptcy
 
120981064 new-doll
120981064 new-doll120981064 new-doll
120981064 new-doll
 
DCF Final
DCF FinalDCF Final
DCF Final
 
Brph institucional junho v9 eng (site)
Brph institucional junho v9 eng (site)Brph institucional junho v9 eng (site)
Brph institucional junho v9 eng (site)
 
Brph institucional junho v11 eng (site) v2
Brph institucional junho v11 eng (site) v2Brph institucional junho v11 eng (site) v2
Brph institucional junho v11 eng (site) v2
 
Financial Forecast PowerPoint Presentation Slides
Financial Forecast PowerPoint Presentation Slides Financial Forecast PowerPoint Presentation Slides
Financial Forecast PowerPoint Presentation Slides
 
sk 034730 Algorithm Investment Report
sk 034730 Algorithm Investment Reportsk 034730 Algorithm Investment Report
sk 034730 Algorithm Investment Report
 
INVESTAURA_Business-Planning-Template.pdf
INVESTAURA_Business-Planning-Template.pdfINVESTAURA_Business-Planning-Template.pdf
INVESTAURA_Business-Planning-Template.pdf
 
Financials1 P
Financials1 PFinancials1 P
Financials1 P
 

Mehr von Iman Najafi

Mehr von Iman Najafi (7)

The equity Raising process Checklist_For series A.pdf
The equity Raising process Checklist_For series A.pdfThe equity Raising process Checklist_For series A.pdf
The equity Raising process Checklist_For series A.pdf
 
business-plan-template_Iman Najafi.pdf
business-plan-template_Iman Najafi.pdfbusiness-plan-template_Iman Najafi.pdf
business-plan-template_Iman Najafi.pdf
 
Najafi_Iman_Metalgesellschaft case study.pptx
Najafi_Iman_Metalgesellschaft case study.pptxNajafi_Iman_Metalgesellschaft case study.pptx
Najafi_Iman_Metalgesellschaft case study.pptx
 
Asseco Equity Research Report: CFA Report
Asseco Equity Research Report: CFA Report Asseco Equity Research Report: CFA Report
Asseco Equity Research Report: CFA Report
 
Analytical tools-bloomberg-equity-research-in-excel
Analytical tools-bloomberg-equity-research-in-excelAnalytical tools-bloomberg-equity-research-in-excel
Analytical tools-bloomberg-equity-research-in-excel
 
Process of setting up a new business or franchise
Process of setting up a new business or franchiseProcess of setting up a new business or franchise
Process of setting up a new business or franchise
 
Pzu valuation presentation v3
Pzu valuation  presentation v3Pzu valuation  presentation v3
Pzu valuation presentation v3
 

Kürzlich hochgeladen

VIP Call Girl in Mira Road 💧 9920725232 ( Call Me ) Get A New Crush Everyday ...
VIP Call Girl in Mira Road 💧 9920725232 ( Call Me ) Get A New Crush Everyday ...VIP Call Girl in Mira Road 💧 9920725232 ( Call Me ) Get A New Crush Everyday ...
VIP Call Girl in Mira Road 💧 9920725232 ( Call Me ) Get A New Crush Everyday ...
dipikadinghjn ( Why You Choose Us? ) Escorts
 
Call Girls in New Ashok Nagar, (delhi) call me [9953056974] escort service 24X7
Call Girls in New Ashok Nagar, (delhi) call me [9953056974] escort service 24X7Call Girls in New Ashok Nagar, (delhi) call me [9953056974] escort service 24X7
Call Girls in New Ashok Nagar, (delhi) call me [9953056974] escort service 24X7
9953056974 Low Rate Call Girls In Saket, Delhi NCR
 
VIP Call Girl in Mumbai 💧 9920725232 ( Call Me ) Get A New Crush Everyday Wit...
VIP Call Girl in Mumbai 💧 9920725232 ( Call Me ) Get A New Crush Everyday Wit...VIP Call Girl in Mumbai 💧 9920725232 ( Call Me ) Get A New Crush Everyday Wit...
VIP Call Girl in Mumbai 💧 9920725232 ( Call Me ) Get A New Crush Everyday Wit...
dipikadinghjn ( Why You Choose Us? ) Escorts
 
VIP Independent Call Girls in Bandra West 🌹 9920725232 ( Call Me ) Mumbai Esc...
VIP Independent Call Girls in Bandra West 🌹 9920725232 ( Call Me ) Mumbai Esc...VIP Independent Call Girls in Bandra West 🌹 9920725232 ( Call Me ) Mumbai Esc...
VIP Independent Call Girls in Bandra West 🌹 9920725232 ( Call Me ) Mumbai Esc...
dipikadinghjn ( Why You Choose Us? ) Escorts
 
VIP Independent Call Girls in Andheri 🌹 9920725232 ( Call Me ) Mumbai Escorts...
VIP Independent Call Girls in Andheri 🌹 9920725232 ( Call Me ) Mumbai Escorts...VIP Independent Call Girls in Andheri 🌹 9920725232 ( Call Me ) Mumbai Escorts...
VIP Independent Call Girls in Andheri 🌹 9920725232 ( Call Me ) Mumbai Escorts...
dipikadinghjn ( Why You Choose Us? ) Escorts
 

Kürzlich hochgeladen (20)

The Economic History of the U.S. Lecture 20.pdf
The Economic History of the U.S. Lecture 20.pdfThe Economic History of the U.S. Lecture 20.pdf
The Economic History of the U.S. Lecture 20.pdf
 
Shrambal_Distributors_Newsletter_Apr-2024 (1).pdf
Shrambal_Distributors_Newsletter_Apr-2024 (1).pdfShrambal_Distributors_Newsletter_Apr-2024 (1).pdf
Shrambal_Distributors_Newsletter_Apr-2024 (1).pdf
 
Call Girls in New Friends Colony Delhi 💯 Call Us 🔝9205541914 🔝( Delhi) Escort...
Call Girls in New Friends Colony Delhi 💯 Call Us 🔝9205541914 🔝( Delhi) Escort...Call Girls in New Friends Colony Delhi 💯 Call Us 🔝9205541914 🔝( Delhi) Escort...
Call Girls in New Friends Colony Delhi 💯 Call Us 🔝9205541914 🔝( Delhi) Escort...
 
The Economic History of the U.S. Lecture 26.pdf
The Economic History of the U.S. Lecture 26.pdfThe Economic History of the U.S. Lecture 26.pdf
The Economic History of the U.S. Lecture 26.pdf
 
Booking open Available Pune Call Girls Wadgaon Sheri 6297143586 Call Hot Ind...
Booking open Available Pune Call Girls Wadgaon Sheri  6297143586 Call Hot Ind...Booking open Available Pune Call Girls Wadgaon Sheri  6297143586 Call Hot Ind...
Booking open Available Pune Call Girls Wadgaon Sheri 6297143586 Call Hot Ind...
 
The Economic History of the U.S. Lecture 17.pdf
The Economic History of the U.S. Lecture 17.pdfThe Economic History of the U.S. Lecture 17.pdf
The Economic History of the U.S. Lecture 17.pdf
 
Vip Call US 📞 7738631006 ✅Call Girls In Sakinaka ( Mumbai )
Vip Call US 📞 7738631006 ✅Call Girls In Sakinaka ( Mumbai )Vip Call US 📞 7738631006 ✅Call Girls In Sakinaka ( Mumbai )
Vip Call US 📞 7738631006 ✅Call Girls In Sakinaka ( Mumbai )
 
VIP Call Girl in Mira Road 💧 9920725232 ( Call Me ) Get A New Crush Everyday ...
VIP Call Girl in Mira Road 💧 9920725232 ( Call Me ) Get A New Crush Everyday ...VIP Call Girl in Mira Road 💧 9920725232 ( Call Me ) Get A New Crush Everyday ...
VIP Call Girl in Mira Road 💧 9920725232 ( Call Me ) Get A New Crush Everyday ...
 
(Vedika) Low Rate Call Girls in Pune Call Now 8250077686 Pune Escorts 24x7
(Vedika) Low Rate Call Girls in Pune Call Now 8250077686 Pune Escorts 24x7(Vedika) Low Rate Call Girls in Pune Call Now 8250077686 Pune Escorts 24x7
(Vedika) Low Rate Call Girls in Pune Call Now 8250077686 Pune Escorts 24x7
 
Call Girls in New Ashok Nagar, (delhi) call me [9953056974] escort service 24X7
Call Girls in New Ashok Nagar, (delhi) call me [9953056974] escort service 24X7Call Girls in New Ashok Nagar, (delhi) call me [9953056974] escort service 24X7
Call Girls in New Ashok Nagar, (delhi) call me [9953056974] escort service 24X7
 
VIP Call Girl in Mumbai 💧 9920725232 ( Call Me ) Get A New Crush Everyday Wit...
VIP Call Girl in Mumbai 💧 9920725232 ( Call Me ) Get A New Crush Everyday Wit...VIP Call Girl in Mumbai 💧 9920725232 ( Call Me ) Get A New Crush Everyday Wit...
VIP Call Girl in Mumbai 💧 9920725232 ( Call Me ) Get A New Crush Everyday Wit...
 
VIP Independent Call Girls in Bandra West 🌹 9920725232 ( Call Me ) Mumbai Esc...
VIP Independent Call Girls in Bandra West 🌹 9920725232 ( Call Me ) Mumbai Esc...VIP Independent Call Girls in Bandra West 🌹 9920725232 ( Call Me ) Mumbai Esc...
VIP Independent Call Girls in Bandra West 🌹 9920725232 ( Call Me ) Mumbai Esc...
 
00_Main ppt_MeetupDORA&CyberSecurity.pptx
00_Main ppt_MeetupDORA&CyberSecurity.pptx00_Main ppt_MeetupDORA&CyberSecurity.pptx
00_Main ppt_MeetupDORA&CyberSecurity.pptx
 
Stock Market Brief Deck (Under Pressure).pdf
Stock Market Brief Deck (Under Pressure).pdfStock Market Brief Deck (Under Pressure).pdf
Stock Market Brief Deck (Under Pressure).pdf
 
The Economic History of the U.S. Lecture 19.pdf
The Economic History of the U.S. Lecture 19.pdfThe Economic History of the U.S. Lecture 19.pdf
The Economic History of the U.S. Lecture 19.pdf
 
(INDIRA) Call Girl Mumbai Call Now 8250077686 Mumbai Escorts 24x7
(INDIRA) Call Girl Mumbai Call Now 8250077686 Mumbai Escorts 24x7(INDIRA) Call Girl Mumbai Call Now 8250077686 Mumbai Escorts 24x7
(INDIRA) Call Girl Mumbai Call Now 8250077686 Mumbai Escorts 24x7
 
VIP Independent Call Girls in Andheri 🌹 9920725232 ( Call Me ) Mumbai Escorts...
VIP Independent Call Girls in Andheri 🌹 9920725232 ( Call Me ) Mumbai Escorts...VIP Independent Call Girls in Andheri 🌹 9920725232 ( Call Me ) Mumbai Escorts...
VIP Independent Call Girls in Andheri 🌹 9920725232 ( Call Me ) Mumbai Escorts...
 
The Economic History of the U.S. Lecture 18.pdf
The Economic History of the U.S. Lecture 18.pdfThe Economic History of the U.S. Lecture 18.pdf
The Economic History of the U.S. Lecture 18.pdf
 
Booking open Available Pune Call Girls Talegaon Dabhade 6297143586 Call Hot ...
Booking open Available Pune Call Girls Talegaon Dabhade  6297143586 Call Hot ...Booking open Available Pune Call Girls Talegaon Dabhade  6297143586 Call Hot ...
Booking open Available Pune Call Girls Talegaon Dabhade 6297143586 Call Hot ...
 
Indore Real Estate Market Trends Report.pdf
Indore Real Estate Market Trends Report.pdfIndore Real Estate Market Trends Report.pdf
Indore Real Estate Market Trends Report.pdf
 

Income Statement Prediction

  • 1. � Corporate Finance Institute. All rights reserved. Startup year Terminal year 2016 2017 2018 2019 2020 2021 2022 Balance Sheet Check OK OK OK OK OK OK OK Assumptions Site Traffic (Avg monthly visits) Email 0 5,000 10,000 20,000 30,000 50,000 60,000 Organic Search 10,000 50,000 100,000 130,000 155,000 170,000 180,000 Paid Search 30,000 20,000 10,000 10,000 10,000 10,000 10,000 Affiliates 20,000 10,000 5,000 5,000 5,000 5,000 5,000 Total Monthly Visits 60,000 85,000 125,000 165,000 200,000 235,000 255,000 Growth Rate 41.7% 47.1% 32.0% 21.2% 17.5% 8.5% Site Traffic (Annual) 12 Email 0 60,000 120,000 240,000 360,000 600,000 720,000 Organic Search 120,000 600,000 1,200,000 1,560,000 1,860,000 2,040,000 2,160,000 Paid Search 360,000 240,000 120,000 120,000 120,000 120,000 120,000 Affiliates 240,000 120,000 60,000 60,000 60,000 60,000 60,000 Total Annual Visits 720,000 1,020,000 1,500,000 1,980,000 2,400,000 2,820,000 3,060,000 Conversion Rates Email 6.0% 6.0% 6.0% 6.0% 6.0% 6.0% 6.0% Organic Search 2.0% 2.0% 2.0% 2.0% 2.0% 2.0% 2.0% Paid Search 2.2% 2.2% 2.2% 2.2% 2.2% 2.2% 2.2% Affiliates 4.0% 4.0% 4.0% 4.0% 4.0% 4.0% 4.0% Total Monthly Visits 2.8% 2.5% 2.4% 2.6% 2.7% 2.9% 3.0% Orders Placed Email 0 3,600 7,200 14,400 21,600 36,000 43,200 Organic Search 2,400 12,000 24,000 31,200 37,200 40,800 43,200 Paid Search 7,920 5,280 2,640 2,640 2,640 2,640 2,640 Affiliates 9,600 4,800 2,400 2,400 2,400 2,400 2,400 Total Orders Placed 19,920 25,680 36,240 50,640 63,840 81,840 91,440 Order Details Average item value (gross) 250 250 250 250 250 250 250 # of items per order 1.1 1.2 1.3 1.4 1.5 1.6 1.7 Average markdown 10% 10% 10% 10% 10% 10% 10% Average promotion/discount 20% 18% 15% 12% 10% 8% 8% Cost of Goods Sold (Gross Product Marin) 50% 50% 50% 50% 50% 50% 50% Average Gross order value 275 300 325 350 375 400 425 Average Net order value 193 216 244 273 300 328 349 Customers Churn Rate 25% 25% 25% 25% 25% 25% 25% Opening active customer base 0 14,940 27,765 42,604 59,133 76,030 91,402 Plus new customers 19,920 22,080 29,040 36,240 42,240 45,840 48,240 Subtotal 19,920 37,020 56,805 78,844 101,373 121,870 139,642 Less churned customers 4,980 9,255 14,201 19,711 25,343 30,467 34,911 Closing customer base 14,940 27,765 42,604 59,133 76,030 91,402 104,732
  • 2. � Corporate Finance Institute. All rights reserved. Startup year Terminal year 2016 2017 2018 2019 2020 2021 2022 Balance Sheet Check OK OK OK OK OK OK OK Marketing Expenses Variable Email (cost per click) 0.00 0.00 0.00 0.00 0.00 0.00 0.00 Organic Search (cost per click) 0.00 0.00 0.00 0.00 0.00 0.00 0.00 Paid Search (cost per click) 3.00 3.25 3.25 3.50 3.50 3.75 4.00 Affiliates (cost per click) 5.00 5.00 5.00 5.00 5.00 5.00 5.00 Average 3.17 1.35 0.46 0.36 0.30 0.27 0.25 Order Fulfilment Variable Freight/shipping per order 12.00 10.00 9.00 9.00 8.00 8.00 7.00 Labor/handling per order 5.00 5.00 5.00 5.00 5.00 5.00 5.00 Total 17.00 15.00 14.00 14.00 13.00 13.00 12.00 Fixed Warehouse rent 150,000 150,000 150,000 250,000 250,000 500,000 500,000 General & Administrative Fixed Office rent 100,000 100,000 100,000 200,000 200,000 200,000 200,000 Salaries, wages & Benefits 500,000 700,000 1,000,000 1,200,000 1,500,000 2,000,000 3,000,000 Professional fees 100,000 100,000 100,000 200,000 200,000 200,000 200,000 Other 100,000 100,000 200,000 200,000 400,000 400,000 400,000 Total 800,000 1,000,000 1,400,000 1,800,000 2,300,000 2,800,000 3,800,000 Balance Sheet Items Current Assets Accounts Receivable Days 5 5 5 5 5 5 5 Inventory Days 120 100 90 90 90 90 90 Inventory Turns 365 3.0 3.7 4.1 4.1 4.1 4.1 4.1 Current Liabilities Accounts Payable Days 60 50 40 30 30 30 30 Capital Expenditures Technology Development 300,000 50,000 50,000 500,000 50,000 1,000,000 100,000 Office Equipment 200,000 50,000 50,000 50,000 200,000 100,000 500,000 Acquisitions 0 0 0 0 0 0 0 Depreciation Technology - Straight-line Years 5 5 5 5 5 5 5 Office Equipment - Straight-line Years 5 5 5 5 5 5 5 Financing Interest Rate 3.00% 3.00% 3.00% 3.00% 3.00% 3.00% 3.00% Debt Issued (Repaid) 0 0 0 0 0 0 0 Equity Raised (Repurchased) 8,000,000 0 0 0 0 0 0 Dividends Paid 0 0 0 0 0 0 0 Valuation Tax Rate 25% 25% 25% 25% 25% 25% 25% Cost of Capital / Discount Rate 20% 20% 20% 20% 20% 20% 20% 20% Terminal Value Exit Multiple 8.0x
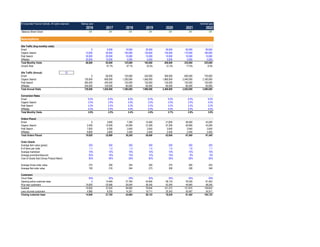
  • 3. � Corporate Finance Institute. All rights reserved. Startup year Terminal year 2016 2017 2018 2019 2020 2021 2022 Balance Sheet Check OK OK OK OK OK OK OK Income Statement Gross Revenue 5,478,000 7,704,000 11,778,000 17,724,000 23,940,000 32,736,000 38,862,000 Discounts, Promotions, Markdowns (1,643,400) (2,157,120) (2,944,500) (3,899,280) (4,788,000) (5,892,480) (6,995,160) Net Revenue 3,834,600 5,546,880 8,833,500 13,824,720 19,152,000 26,843,520 31,866,840 Cost of Goods Sold 2,739,000 3,852,000 5,889,000 8,862,000 11,970,000 16,368,000 19,431,000 Gross Profit 1,095,600 1,694,880 2,944,500 4,962,720 7,182,000 10,475,520 12,435,840 Gross Margin 28.6% 30.6% 33.3% 35.9% 37.5% 39.0% 39.0% Variable Operating Expenses Marketing 2,280,000 1,380,000 690,000 720,000 720,000 750,000 780,000 Fulfilment 338,640 385,200 507,360 708,960 829,920 1,063,920 1,097,280 Total Variable Costs 2,618,640 1,765,200 1,197,360 1,428,960 1,549,920 1,813,920 1,877,280 Contribution Margin (1,523,040) (70,320) 1,747,140 3,533,760 5,632,080 8,661,600 10,558,560 Margin -39.7% -1.3% 19.8% 25.6% 29.4% 32.3% 33.1% Fixed Operating Expenses Fulfilment 150,000 150,000 150,000 250,000 250,000 500,000 500,000 General & Administrative 800,000 1,000,000 1,400,000 1,800,000 2,300,000 2,800,000 3,800,000 Total 950,000 1,150,000 1,550,000 2,050,000 2,550,000 3,300,000 4,300,000 EBITDA (2,473,040) (1,220,320) 197,140 1,483,760 3,082,080 5,361,600 6,258,560 Margin -64.5% -22.0% 2.2% 10.7% 16.1% 20.0% 19.6% Depreciation 100,000 120,000 140,000 250,000 300,000 420,000 520,000 Interest 0 0 0 0 0 0 0 Earnings Before Tax (2,573,040) (1,340,320) 57,140 1,233,760 2,782,080 4,941,600 5,738,560 Taxes 0 0 14,285 308,440 695,520 1,235,400 1,434,640 Net Income (2,573,040) (1,340,320) 42,855 925,320 2,086,560 3,706,200 4,303,920 Dividends Paid 0 0 0 0 0 0 0
  • 4. � Corporate Finance Institute. All rights reserved. Startup year Terminal year 2016 2017 2018 2019 2020 2021 2022 Balance Sheet Check OK OK OK OK OK OK OK Balance Sheet ASSETS Current Cash 4,954,646 3,344,792 2,992,993 2,886,117 4,448,738 6,668,315 10,325,123 Accounts Receivable 52,529 75,985 121,007 189,380 262,356 367,719 436,532 Inventory 900,493 1,055,342 1,452,082 2,185,151 2,951,507 4,035,945 4,791,205 Total 5,907,668 4,476,119 4,566,082 5,260,647 7,662,601 11,071,979 15,552,860 Technology 240,000 220,000 190,000 510,000 370,000 1,040,000 800,000 Property & Equipment 160,000 160,000 150,000 130,000 220,000 230,000 550,000 Total Assets 6,307,668 4,856,119 4,906,082 5,900,647 8,252,601 12,341,979 16,902,860 LIABILITIES & SHAREHOLDER EQUITY Liabilities Current Revolver Accounts Payable 880,708 769,479 776,587 845,832 1,111,226 1,494,404 1,751,365 Total 880,708 769,479 776,587 845,832 1,111,226 1,494,404 1,751,365 Debt 0 0 0 0 0 0 0 Total Liabilities 880,708 769,479 776,587 845,832 1,111,226 1,494,404 1,751,365 Shareholder Equity Share Capital 8,000,000 8,000,000 8,000,000 8,000,000 8,000,000 8,000,000 8,000,000 Retained Earnings (2,573,040) (3,913,360) (3,870,505) (2,945,185) (858,625) 2,847,575 7,151,495 Total Shareholder Equity 5,426,960 4,086,640 4,129,495 5,054,815 7,141,375 10,847,575 15,151,495 Total Liabilities & Shareholder Equity 6,307,668 4,856,119 4,906,082 5,900,647 8,252,601 12,341,979 16,902,860 Check 0.000 0.000 0.000 0.000 0.000 0.000 0.000 Cash Flow Statement Cash from Operations Net Income (2,573,040) (1,340,320) 42,855 925,320 2,086,560 3,706,200 4,303,920 Depreciation 100,000 120,000 140,000 250,000 300,000 420,000 520,000 Changes in non cash working capital Accounts Receivable 52,529 23,456 45,022 68,373 72,976 105,363 68,813 Inventory 900,493 154,849 396,740 733,068 766,356 1,084,438 755,260 Accounts Payable 880,708 (111,228) 7,108 69,245 265,394 383,178 256,961 Total (2,545,354) (1,509,854) (251,799) 443,124 1,812,621 3,319,576 4,256,808 Cash Invested Capital Expenditures 500,000 100,000 100,000 550,000 250,000 1,100,000 600,000 Acquisitions 0 0 0 0 0 0 0 Total 500,000 100,000 100,000 550,000 250,000 1,100,000 600,000 Cash from Financing Increase (decrease) in Debt 0 0 0 0 0 0 0 Equity Issued (repurchased) 8,000,000 0 0 0 0 0 0 Dividends Paid 0 0 0 0 0 0 0 Total 8,000,000 0 0 0 0 0 0 Total Cash 4,954,646 (1,609,854) (351,799) (106,876) 1,562,621 2,219,576 3,656,808 Opening balance 0 4,954,646 3,344,792 2,992,993 2,886,117 4,448,738 6,668,315 Increase (Decrease) 4,954,646 (1,609,854) (351,799) (106,876) 1,562,621 2,219,576 3,656,808 Closing balance 4,954,646 3,344,792 2,992,993 2,886,117 4,448,738 6,668,315 10,325,123
  • 5. � Corporate Finance Institute. All rights reserved. Startup year Terminal year 2016 2017 2018 2019 2020 2021 2022 Balance Sheet Check OK OK OK OK OK OK OK Supporting Schedules Capital Assets Opening Balance Technology 0 240,000 220,000 190,000 510,000 370,000 1,040,000 Property & Equipment 0 160,000 160,000 150,000 130,000 220,000 230,000 Total 0 400,000 380,000 340,000 640,000 590,000 1,270,000 Additions Technology 300,000 50,000 50,000 500,000 50,000 1,000,000 100,000 Property & Equipment 200,000 50,000 50,000 50,000 200,000 100,000 500,000 Total 500,000 100,000 100,000 550,000 250,000 1,100,000 600,000 Subtotal Technology 300,000 290,000 270,000 690,000 560,000 1,370,000 1,140,000 Property & Equipment 200,000 210,000 210,000 200,000 330,000 320,000 730,000 Total 500,000 500,000 480,000 890,000 890,000 1,690,000 1,870,000 Depreciation Technology 2016 60,000 60,000 60,000 60,000 60,000 0 0 2017 10,000 10,000 10,000 10,000 10,000 0 2018 10,000 10,000 10,000 10,000 10,000 2019 100,000 100,000 100,000 100,000 2020 10,000 10,000 10,000 2021 200,000 200,000 2022 20,000 Subtotal 60,000 70,000 80,000 180,000 190,000 330,000 340,000 Property & Equipment 2016 40,000 40,000 40,000 40,000 40,000 0 0 2017 10,000 10,000 10,000 10,000 10,000 0 2018 10,000 10,000 10,000 10,000 10,000 2019 10,000 10,000 10,000 10,000 2020 40,000 40,000 40,000 2021 20,000 20,000 2022 100,000 Subtotal 40,000 50,000 60,000 70,000 110,000 90,000 180,000 Total 100,000 120,000 140,000 250,000 300,000 420,000 520,000 Closing Balance Technology 240,000 220,000 190,000 510,000 370,000 1,040,000 800,000 Property & Equipment 160,000 160,000 150,000 130,000 220,000 230,000 550,000 Total 400,000 380,000 340,000 640,000 590,000 1,270,000 1,350,000 Debt Schedule Opening Balance 0 0 0 0 0 0 0 Debt Issued (Repaid) 0 0 0 0 0 0 0 Closing Balance 0 0 0 0 0 0 0 Interest on Debt 0 0 0 0 0 0 0
  • 6. � Corporate Finance Institute. All rights reserved. Startup year Terminal year 2016 2017 2018 2019 2020 2021 2022 Balance Sheet Check OK OK OK OK OK OK OK Customer Metrics Customer Acquisition Cost (CAC) 130 137 137 143 143 149 155 Contribution Margin Per Order 38 51 67 84 100 115 124 Customer Lifetime Value (LTV) 152 204 269 336 398 460 496 LTV/CAC Ratio 1.2x 1.5x 2.0x 2.4x 2.8x 3.1x 3.2x Payback (# of orders) 3.4 2.7 2.0 1.7 1.4 1.3 1.2 Valuation EBT (2,573,040) (1,340,320) 57,140 1,233,760 2,782,080 4,941,600 5,738,560 Net Operating Loss Opening Balance 0 2,573,040 3,913,360 3,856,220 2,622,460 0 0 Current Loss 2,573,040 1,340,320 0 0 0 0 0 Sub Total 2,573,040 3,913,360 3,913,360 3,856,220 2,622,460 0 0 Loss Used 0 0 57,140 1,233,760 2,622,460 0 0 Closing Balance 2,573,040 3,913,360 3,856,220 2,622,460 0 0 0 Free Cash Flow Earning Before Tax (2,573,040) (1,340,320) 57,140 1,233,760 2,782,080 4,941,600 5,738,560 Interest 0 0 0 0 0 0 0 EBIT (2,573,040) (1,340,320) 57,140 1,233,760 2,782,080 4,941,600 5,738,560 Less Taxes 0 0 0 0 695,520 1,235,400 1,434,640 Less Capex 500,000 100,000 100,000 550,000 250,000 1,100,000 600,000 Plus Depreciation 100,000 120,000 140,000 250,000 300,000 420,000 520,000 Less Changes in Working Capital 72,314 289,534 434,654 732,196 573,939 806,624 567,112 Unlevered Free Cash Flow (3,045,354) (1,609,854) (337,514) 201,564 1,562,621 2,219,576 3,656,808 DCF Valuation NPV of Forecast 20% (1,362,003) Terminal Value (EBITDA multiple) 8.0x 50,068,480 NPV of Terminal Value 13,973,194 Total Enterprise Value 12,611,191 EV/Revenue (2017E) 1.6x % of Business Retained after raise 61%
  • 7. � Corporate Finance Institute. All rights reserved. Startup year Terminal year 2016 2017 2018 2019 2020 2021 2022 Balance Sheet Check OK OK OK OK OK OK OK Charts & Graphs Revenue 3,834,600 5,546,880 8,833,500 13,824,720 19,152,000 26,843,520 31,866,840 Gross Margin 28.6% 30.6% 33.3% 35.9% 37.5% 39.0% 39.0% EBITDA Margin -64.5% -22.0% 2.2% 10.7% 16.1% 20.0% 19.6% Customer Acquisition Cost 130 137 137 143 143 149 155 Life Time Value 152 204 269 336 398 460 496 LTV/CAC 1.2x 1.5x 2.0x 2.4x 2.8x 3.1x 3.2x Customer Acquisition Cost 130 137 137 143 143 149 155 Contribution Margin 38 51 67 84 100 115 124 Payback (# of orders) 3.4 2.7 2.0 1.7 1.4 1.3 1.2 Burn Rate (3,045,354) (1,609,854) (351,799) (106,876) 1,562,621 2,219,576 3,656,808 Cash Balance 8,000,000 4,954,646 3,344,792 2,992,993 2,886,117 4,448,738 6,668,315 10,325,123 -50% -25% 0% 25% 50% 75% 100% -$15 -$10 -$5 $0 $5 $10 $15 $20 $25 $30 $35 2016 2017 2018 2019 2020 2021 2022 MarginMargin Revenue($millions) Revenue EBITDA Margin 0.0x 0.5x 1.0x 1.5x 2.0x 2.5x 3.0x 3.5x 4.0x 4.5x 5.0x $0 $100 $200 $300 $400 $500 $600 2016 2017 2018 2019 2020 2021 2022 LTV/CACRatio Customer Acquisition Cost Life Time Value 0.0 1.0 2.0 3.0 4.0 5.0 $0 $50 $100 $150 $200 2016 2017 2018 2019 2020 2021 2022 Payback(#orders) Customer Acquisition Cost Contribution Margin -$5 -$3 -$1 $1 $3 $5 $7 $9 $11 $13 2016 2017 2018 2019 2020 2021 2022 Burn($millions) Burn Rate Cash Balance