Variance rover system web analytics tool using data
•
1 gefällt mir•136 views

IJRET : International Journal of Research in Engineering and Technology is an international peer reviewed, online journal published by eSAT Publishing House for the enhancement of research in various disciplines of Engineering and Technology. The aim and scope of the journal is to provide an academic medium and an important reference for the advancement and dissemination of research results that support high-level learning, teaching and research in the fields of Engineering and Technology. We bring together Scientists, Academician, Field Engineers, Scholars and Students of related fields of Engineering and Technology
![IJRET: International Journal of Research in Engineering and Technology eISSN: 2319-1163 | pISSN: 2321-7308
__________________________________________________________________________________________
Volume: 03 Issue: 01 | Jan-2014, Available @ http://www.ijret.org 348
To trace the future market at particular place we need to find
that from which location of the world the visitors of the
website belong. Maximum used services by this visitors also
referral of the website and whole control of the system at
administrator. The similar kind of facility is available with
Google Analytic Tools but for every domain we have to pay
the different fees, also the whole database needs to be shared
with Google. Report formation is not as per our requirement
which is the major task in every system. But, unfortunately the
ownership of the generated reports lies with Google Analytics.
1.2 Objectives
The main objective of this paper is market research from mass
of real time data which work faster, better and robust. Along
with market research the project will cover the following
aspects:
i. Market research.
ii. Analyzing visitor traffic country wise and product
wise.
iii. Customer tracking
iv. Referrer researches
v. Product Positioning
vi. Business expansion
vii. Predicting future markets
viii. Retrieve user’s browsing details
ix. Reporting
2. LITERATURE SURVEY
Data mining is a powerful new technology with great ability to
help organizations to focus on the most important information
asset such as data that they have collected about the behavior
of their customers and potential customers. Most of the
analytical techniques used in data mining are often well-
known mathematical algorithms and techniques. It explores
information within the data that queries and reports can't
effectively reveal. Data mining techniques such as Decision
trees, Genetic algorithms, Neural networks and many more
help to analyze data in efficient manner. What is new is the
application of those techniques to general business problems
made possible by the increased availability of data and
inexpensive storage and processing power.
Clustering is nothing but “grouping similar kind of data
together”. By making use of clustering and the analytical tool
proper interrelationships between data points can be found out.
Thus, Data Mining will surely allow to analyze the data for
developing a good analytical tool. Thus such a tool should be
able to compare between different characteristics or attributes
of different groups and indentify different important
characteristics of each segment to decide different business
strategies. Hence, Clustering analysis can find out the
distribution of different data entities as well can find out
proper inter relationships between the data objects so that it
can divide the data set into series of meaningful subclasses.
One such common yet exclusive method used in clustering
analysis is K-means Clustering algorithm, which is a fast
method for classification of data into required clusters. Also,
Optimization of this algorithm will lead to faster segmentation
and will surely lead to more efficient results.
3. RELATED ALGORITHMS
3.1 Standard K-Means
K-means algorithm is an algorithm used to classify or to group
the objects based on attributes features into K number of
group. K is positive integer number. The grouping is done by
minimizing the sum of squares of distances between data and
the corresponding cluster centroid. Thus, the purpose of K-
mean clustering is to classify the data [5].
Standard k-means algorithm:
1. Initially, the number of clusters must be known, or
chosen, to be K say. K is positive integer number
.These points represent initial group centroids.Often
chosen such that the points are mutually “farthest
apart”, in some way
2. Assign each object to the group that has the closest
centroid.
3. When all objects have been assigned, recalculate the
positions of the K centroids.
4. This process is iterated until the centroids no longer
move. This produces a separation of the objects into
groups from which the metric to be minimized can be
calculated.
Advantage is that it is simple and has high processing speed
when applied to large amount of data. K-Means calculates
centroid of the clusters by taking average of the data points in
the data set. Its disadvantage is that it does not yield the same
result with each execution, as the resultant clusters depend
upon the initial random assignments as discussed in[1][4] and
most distance calculations in standard K-means are redundant.
3.2 Optimized K-Means
We use triangle inequality to reduce these redundant
calculations. In this way we improved the efficiency of the
algorithm to a large extent. As can be seen from the generally
acknowledged truth, the sum of two sides is greater than the
third side in a triangle. Euclidean distance meets the triangle
inequality, which we can [1] extend to the multi-dimensional
Euclidean space. We can take three vectors in Euclidean space
randomly: x, a, b, then:
d(x,a) + d(a,b) ≥ d(x,b)
d(a,b)− d(x,a )≤ d(x,b)
d(Ci,Cj), is the distance between two cluster centers.](data:image/gif;base64,R0lGODlhAQABAIAAAAAAAP///yH5BAEAAAAALAAAAAABAAEAAAIBRAA7)
Empfohlen
Empfohlen
Weitere ähnliche Inhalte
Was ist angesagt?
Was ist angesagt? (18)
Andere mochten auch
Andere mochten auch (20)
Ähnlich wie Variance rover system web analytics tool using data
Ähnlich wie Variance rover system web analytics tool using data (20)
Mehr von eSAT Publishing House
Mehr von eSAT Publishing House (20)
Kürzlich hochgeladen
Kürzlich hochgeladen (20)
Variance rover system web analytics tool using data
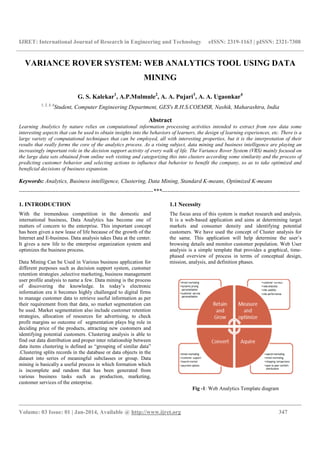
- 1. IJRET: International Journal of Research in Engineering and Technology eISSN: 2319-1163 | pISSN: 2321-7308 __________________________________________________________________________________________ Volume: 03 Issue: 01 | Jan-2014, Available @ http://www.ijret.org 347 VARIANCE ROVER SYSTEM: WEB ANALYTICS TOOL USING DATA MINING G. S. Kalekar1 , A.P.Mulmule2 , A. A. Pujari3 , A. A. Ugaonkar4 1, 2, 3, 4 Student, Computer Engineering Department, GES's R.H.S.COEMSR, Nashik, Maharashtra, India Abstract Learning Analytics by nature relies on computational information processing activities intended to extract from raw data some interesting aspects that can be used to obtain insights into the behaviors of learners, the design of learning experiences, etc. There is a large variety of computational techniques that can be employed, all with interesting properties, but it is the interpretation of their results that really forms the core of the analytics process. As a rising subject, data mining and business intelligence are playing an increasingly important role in the decision support activity of every walk of life. The Variance Rover System (VRS) mainly focused on the large data sets obtained from online web visiting and categorizing this into clusters according some similarity and the process of predicting customer behavior and selecting actions to influence that behavior to benefit the company, so as to take optimized and beneficial decisions of business expansion. Keywords: Analytics, Business intelligence, Clustering, Data Mining, Standard K-means, Optimized K-means ----------------------------------------------------------------------***------------------------------------------------------------------------ 1. INTRODUCTION With the tremendous competition in the domestic and international business, Data Analytics has become one of matters of concern to the enterprise. This important concept has been given a new lease of life because of the growth of the Internet and E-business. Data analysis takes Data at the center. It gives a new life to the enterprise organization system and optimizes the business process. Data Mining Can be Used in Various business application for different purposes such as decision support system, customer retention strategies ,selective marketing, business management user profile analysis to name a few. Data mining is the process of discovering the knowledge. In today’s electronic information era it becomes highly challenged to digital firms to manage customer data to retrieve useful information as per their requirement from that data, so market segmentation can be used. Market segmentation also include customer retention strategies, allocation of resources for advertising, to check profit margins so outcome of segmentation plays big role in deciding price of the products, attracting new customers and identifying potential customers. Clustering analysis is able to find out data distribution and proper inter relationship between data items clustering is defined as “grouping of similar data” .Clustering splits records in the database or data objects in the dataset into series of meaningful subclasses or group. Data mining is basically a useful process in which formation which is incomplete and random that has been generated from various business tasks such as production, marketing, customer services of the enterprise. 1.1 Necessity The focus area of this system is market research and analysis. It is a web-based application and aims at determining target markets and consumer density and identifying potential customers. We have used the concept of Cluster analysis for the same. This application will help determine the user’s browsing details and monitor customer population. Web User analysis is a simple template that provides a graphical, time- phased overview of process in terms of conceptual design, mission, analysis, and definition phases. Fig -1: Web Analytics Template diagram
- 2. IJRET: International Journal of Research in Engineering and Technology eISSN: 2319-1163 | pISSN: 2321-7308 __________________________________________________________________________________________ Volume: 03 Issue: 01 | Jan-2014, Available @ http://www.ijret.org 348 To trace the future market at particular place we need to find that from which location of the world the visitors of the website belong. Maximum used services by this visitors also referral of the website and whole control of the system at administrator. The similar kind of facility is available with Google Analytic Tools but for every domain we have to pay the different fees, also the whole database needs to be shared with Google. Report formation is not as per our requirement which is the major task in every system. But, unfortunately the ownership of the generated reports lies with Google Analytics. 1.2 Objectives The main objective of this paper is market research from mass of real time data which work faster, better and robust. Along with market research the project will cover the following aspects: i. Market research. ii. Analyzing visitor traffic country wise and product wise. iii. Customer tracking iv. Referrer researches v. Product Positioning vi. Business expansion vii. Predicting future markets viii. Retrieve user’s browsing details ix. Reporting 2. LITERATURE SURVEY Data mining is a powerful new technology with great ability to help organizations to focus on the most important information asset such as data that they have collected about the behavior of their customers and potential customers. Most of the analytical techniques used in data mining are often well- known mathematical algorithms and techniques. It explores information within the data that queries and reports can't effectively reveal. Data mining techniques such as Decision trees, Genetic algorithms, Neural networks and many more help to analyze data in efficient manner. What is new is the application of those techniques to general business problems made possible by the increased availability of data and inexpensive storage and processing power. Clustering is nothing but “grouping similar kind of data together”. By making use of clustering and the analytical tool proper interrelationships between data points can be found out. Thus, Data Mining will surely allow to analyze the data for developing a good analytical tool. Thus such a tool should be able to compare between different characteristics or attributes of different groups and indentify different important characteristics of each segment to decide different business strategies. Hence, Clustering analysis can find out the distribution of different data entities as well can find out proper inter relationships between the data objects so that it can divide the data set into series of meaningful subclasses. One such common yet exclusive method used in clustering analysis is K-means Clustering algorithm, which is a fast method for classification of data into required clusters. Also, Optimization of this algorithm will lead to faster segmentation and will surely lead to more efficient results. 3. RELATED ALGORITHMS 3.1 Standard K-Means K-means algorithm is an algorithm used to classify or to group the objects based on attributes features into K number of group. K is positive integer number. The grouping is done by minimizing the sum of squares of distances between data and the corresponding cluster centroid. Thus, the purpose of K- mean clustering is to classify the data [5]. Standard k-means algorithm: 1. Initially, the number of clusters must be known, or chosen, to be K say. K is positive integer number .These points represent initial group centroids.Often chosen such that the points are mutually “farthest apart”, in some way 2. Assign each object to the group that has the closest centroid. 3. When all objects have been assigned, recalculate the positions of the K centroids. 4. This process is iterated until the centroids no longer move. This produces a separation of the objects into groups from which the metric to be minimized can be calculated. Advantage is that it is simple and has high processing speed when applied to large amount of data. K-Means calculates centroid of the clusters by taking average of the data points in the data set. Its disadvantage is that it does not yield the same result with each execution, as the resultant clusters depend upon the initial random assignments as discussed in[1][4] and most distance calculations in standard K-means are redundant. 3.2 Optimized K-Means We use triangle inequality to reduce these redundant calculations. In this way we improved the efficiency of the algorithm to a large extent. As can be seen from the generally acknowledged truth, the sum of two sides is greater than the third side in a triangle. Euclidean distance meets the triangle inequality, which we can [1] extend to the multi-dimensional Euclidean space. We can take three vectors in Euclidean space randomly: x, a, b, then: d(x,a) + d(a,b) ≥ d(x,b) d(a,b)− d(x,a )≤ d(x,b) d(Ci,Cj), is the distance between two cluster centers.
- 3. IJRET: International Journal of Research in Engineering and Technology eISSN: 2319-1163 | pISSN: 2321-7308 __________________________________________________________________________________________ Volume: 03 Issue: 01 | Jan-2014, Available @ http://www.ijret.org 349 If 2d(x,a )≤ d(Ci,Cj) then: 2d(x,Cj )- d(x,Cj) ≤ d(Cj,Ck)- d(x,Cj) (1) According to equation (1) then : d(x,Cj) ≤ d(x,Ck) First, select initial cluster centers, and set the lower bound y(x,f)=0 for each data point and cluster center. Second, assign each data point to its nearest initial cluster, we will use the results obtained previously to avoid unnecessary distance calculations in this process. Each time d(x,f) is computed, set y(x,f)=d(x,f). 4. APPLICATION If the system is build to trace that which services or products or application of the website are requested by the Visitors, then it leads Business Intelligence to take place. We can provide reports as desired which will surely help the organization to make decisions regarding whether to expand, shrink and retain their services, products or applications. CONCLUSIONS Customer is an important asset of an enterprise. Considering this, the proposed system does the market research and analysis which helps to determine target markets and consumer density. Here, Data mining provides the technology to analyze mass volume of data and/or detect hidden patterns in data to convert raw data into valuable information. ACKNOWLEDGMENTS Thanks to Assistant Prof N.V.Alone for his valuable, intellectual and encouraging guidance .He is the Head of the Department of Computer Department at GES R.H.S COE, Nashik. He has received Master in Computer Engineering and has more than twelve years of teaching experience. REFERENCES [1]. Gao Hua , “Customer Relationship Management Based on Data Mining Technique” 978-1-4244-8694-6/11/$26.00 ©2011 IEEE [2]. Xiaoping Qin, Shijue Zheng , Tingting HeMing Zou,Ying Huang, “Optimizated K-means algorithm and application in CRM system” 2010 International Symposium on Computer, Communication, Control and Automation [3]. Shu-Hsien Liao , Pei-Hui Chu, Pei-Yuan Hsiao “Data mining techniques and its applications –A Decade review from 2000 to 2011” , journal homepage: www.elsevier.com/locate/eswa,Expert Systems with Applications 39 (2012) 11303–11311 [4]. Mrs.G.P.Dharne, Mrs.S.A. Kinariwala Mrs.A.S.vaidya, MS.P.V. Pandit, “A web user analyser by hierarchical and optimized K-means algotrithm”, vol.1, issue7, dec.2011 Technique” 978-1- 4244-8694-6/11/$26.00 ©2011 IEEE [5]. J. Han and M. Kamber, Data Mining: Concepts and Techniques 2006 BIOGRAPHIES Gauri Sanjay Kalekar, She is pursuing her B.E. course in computer from University of Pune. Aditi Prakash Mulmule, She is pursuing her B.E. course in computer from University of Pune. Akshay Arvind Pujari, He is pursuing his B.E. course in computer from University of Pune. Abhilash Ajay Ugaonkar, He is pursuing his B.E. course in computer from University of Pune