Advances in host plant resistance and identification of broad-based stable sources of resistance to Fusarium wilt of pigeonpea
•
1 gefällt mir•322 views

Host Plant Resistance is the most effective and economical management option for Fusarium wilt (Fusarium udum Butler) of pigeonpea (Figure 1) either alone or as a major component of IDM. The disease can cause yield losses of up to 100% in susceptible cultivars. ICRISAT has developed large numbers of high yielding wilt resistant lines by selecting them under high disease pressure in field screening. These resistant lines if found to possess stable resistance across locations, could be utilized in pigeonpea disease resistance breeding program.
Empfohlen

Empfohlen
Weitere ähnliche Inhalte
Ähnlich wie Advances in host plant resistance and identification of broad-based stable sources of resistance to Fusarium wilt of pigeonpea
Ähnlich wie Advances in host plant resistance and identification of broad-based stable sources of resistance to Fusarium wilt of pigeonpea (20)
Mehr von ICRISAT
Mehr von ICRISAT (20)
Kürzlich hochgeladen
Kürzlich hochgeladen (20)
Advances in host plant resistance and identification of broad-based stable sources of resistance to Fusarium wilt of pigeonpea
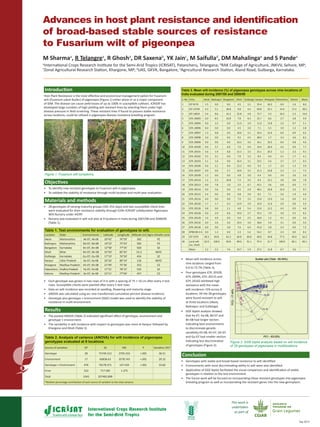
- 1. Sep 2014 Advances in host plant resistance and identification of broad-based stable sources of resistance to Fusarium wilt of pigeonpea This work is undertaken as part of M Sharmaa, R Telangrea, R Ghosha, DR Saxenab, YK Jainc, M Saifullad, DM Mahalingae and S Pandea aInternational Crops Research Institute for the Semi-Arid Tropics (ICRISAT), Patancheru, Telangana; bRAK College of Agriculture, JNKVV, Sehore, MP; cZonal Agricultural Research Station, Khargone, MP; dUAS, GKVK, Bangalore, eAgricultural Research Station, Aland Road, Gulbarga, Karnataka. Introduction Host Plant Resistance is the most effective and economical management option for Fusarium wilt (Fusarium udum Butler) of pigeonpea (Figure 1) either alone or as a major component of IDM. The disease can cause yield losses of up to 100% in susceptible cultivars. ICRISAT has developed large numbers of high yielding wilt resistant lines by selecting them under high disease pressure in field screening. These resistant lines if found to possess stable resistance across locations, could be utilized in pigeonpea disease resistance breeding program. Objectives • To identify new resistant genotypes to Fusarium wilt in pigeonpea. • To validate the stability of resistance through multi-location and multi-year evaluation. Materials and methods • 28 genotypes of varying maturity groups (181-252 days) and two susceptible check lines were evaluated for their resistance stability through ICAR–ICRISAT collaborative Pigeonpea Wilt Nursery under AICRP. • Nursery was evaluated in wilt sick plot at 9 locations in India during 2007/08 and 2008/09 (Table 1). • Each genotype was grown in two rows of 4 m with a spacing of 75 × 10 cm after every 4 test rows. Susceptible checks were planted after every 5 test rows. • Data on wilt incidence was recorded at seedling, flowering and maturity stage. • ANOVA was calculated using arc sine transformed cumulative percent disease incidence. • Genotype plus genotype × environment (GGE) model was used to identify the stability of resistance in multi-environment. Results • The pooled ANOVA (Table 2) indicated significant effect of genotype, environment and genotype × environment. • The variability in wilt incidence with respect to genotypes was more at Kanpur followed by Khargone and Dholi (Table 3). Table 1. Test environments for evaluation of genotypes to wilt. Location State Environments Latitude Longitude Altitude (m) Agro-climatic zone Akola Maharashtra Ak-07, Ak-08 20°42’ 76°59’ 282 PZ Badnapur Maharashtra Bd-07, Bd-08 19°23’ 75°43’ 582 PZ Bangalore Karnataka Bn-07, Bn-08 12°58’ 77°35’ 920 SZ Dholi Bihar Dh-07, Dh-08 25°59’ 85°35’ 52.2 NEPZ Gulbarga Karnataka Gu-07, Gu-08 17°19’ 76°50’ 454 SZ Kanpur Uttar Pradesh Ka-07, Ka-08 26°26’ 80°19’ 126 NEPZ Khargone Madhya Pradesh Kh-07, Kh-08 21°49’ 75°36’ 252 CZ Patancheru Andhra Pradesh Pa-07, Pa-08 17°31’ 78°15’ 545 SZ Sehore Madhya Pradesh Se-07, Se-08 23°11’ 77°04’ 457 CZ • Mean wilt incidence across nine locations ranged from 0.0 to 73.7% (Table 3). • Four genotypes ICPL 20109, ICPL 20096, ICPL 20115 and ICPL 20102 exhibited high resistance with the mean wilt incidence <5% across 8 locations. All the 28 genotypes were found resistant to wilt at three locations (Akola, Badnapur and Gulbarga). • GGE biplot analysis showed that Ka-07, Ka-08, Bd-07 and Bn-08 had longer vectors indicating best environments to discriminate genetic variability Kh-08, Kh-07, Dh-07 and Gu-07 had smaller vectors indicating less discriminative of genotypes (Figure 2). Table 2. Analysis of variance (ANOVA) for wilt incidence of pigeonpea genotypes evaluated at 9 locations Source of variation DF SS MS P Variation (%)* Genotype 28 75749.312 2705.333 <.001 36.51 Environment 17 60838.63 3578.743 <.001 29.32 Genotype × Environment 476 70178.371 147.434 <.001 33.82 Error 522 717.585 1.375 Total 1043 207483.898 *Relative percentage contribution of each source of variation to the total variance Table 3. Mean wilt incidence (%) of pigeonpea genotypes across nine locations of India evaluated during 2007/08 and 2008/09 S. No. Entry Akola Badnapur Bangalore Dholi Gulbarga Kanpur Khargoan Patancheru Sehore Mean 1 ICP 9174 1.5 0.0 0.0 4.5 3.1 35.4 26.2 0.0 1.6 8.0 2 ICP 12749 4.3 5.1 26.8 9.8 4.4 69.8 33.1 14.4 17.2 20.5 3 ICP 14819 3.4 8.6 41.5 25.8 4.8 73.7 3.3 10.3 5.3 19.6 4 ICPL 20093 0.0 8.5 24.8 7.8 8.3 25.7 8.6 2.7 2.8 9.9 5 ICPL 20094 0.0 3.3 0.0 11.0 3.0 11.0 13.8 3.2 0.7 5.1 6 ICPL 20096 0.0 0.0 0.0 4.5 3.0 7.1 5.5 3.9 1.3 2.8 7 ICPL 20097 1.3 6.8 0.0 10.6 3.1 16.4 12.6 6.0 0.0 6.3 8 ICPL 20098 3.0 0.0 0.0 9.5 4.5 48.0 1.7 3.3 3.6 8.2 9 ICPL 20099 0.0 0.0 0.0 10.3 3.6 16.1 10.5 0.0 0.8 4.6 10 ICPL 20100 0.9 5.7 0.0 7.0 4.9 19.4 26.9 4.2 0.0 7.7 11 ICPL 20101 5.6 1.9 6.8 15.3 3.5 25.1 20.3 1.2 2.3 9.1 12 ICPL 20102 3.5 2.1 0.0 7.0 3.3 8.5 6.9 4.1 1.7 4.1 13 ICPL 20103 2.1 1.6 0.0 16.4 3.1 23.5 5.6 3.7 2.7 6.5 14 ICPL 20106 0.0 2.1 0.0 13.3 4.0 9.3 1.7 3.2 1.3 3.9 15 ICPL 20107 0.0 0.0 3.7 10.0 3.5 21.3 23.8 2.3 1.1 7.3 16 ICPL 20109 1.3 0.0 0.0 4.8 3.0 6.4 0.0 3.9 3.6 2.6 17 ICPL 20110 1.2 2.3 34.8 7.3 3.5 6.4 12.1 3.0 0.0 7.8 18 ICPL 20113 0.0 7.8 1.0 2.5 4.7 43.1 3.6 6.8 0.0 7.7 19 ICPL 20114 0.0 5.6 0.0 4.5 2.9 48.1 10.8 12.4 3.2 9.7 20 ICPL 20115 2.4 0.0 0.0 9.8 3.9 8.2 7.1 2.6 1.9 4.0 21 ICPL 20116 0.0 0.0 0.0 7.0 3.5 13.0 13.0 1.6 0.0 4.2 22 ICPL 20120 1.7 1.7 4.2 12.9 3.9 14.0 11.6 2.9 0.0 5.9 23 ICPL 20126 0.8 0.0 2.1 4.8 5.4 13.0 12.2 4.5 0.0 4.8 24 ICPL 20128 0.0 2.9 6.6 10.0 2.7 35.5 7.9 3.0 5.2 8.2 25 ICPL 20129 1.6 4.9 0.0 0.0 2.5 18.0 1.2 4.1 0.0 3.6 26 ICPL 20132 0.0 2.6 2.6 10.4 3.0 18.6 5.0 3.1 0.0 5.0 27 ICPL 20134 0.0 0.0 3.8 7.6 6.4 41.0 2.8 3.3 0.0 7.2 28 KPBR 80-2-4 0.0 1.3 0.0 2.3 5.4 54.2 8.7 2.4 0.0 8.3 29 ICP 2376 58.3 83.8 61.3 64.8 60.8 60.0 44.8 77.5 49.0 62.2 30 Local wilt sus. check 62.0 100.0 83.8 80.0 91.1 97.4 51.7 100.0 82.1 83.1 Mean 3.2 5.5 7.6 10.7 5.9 27.2 11.8 6.7 3.6 Figure 2. GGE biplot analysis based on wilt incidence of 28 genotypes of pigeonpea in multilocations. Figure 1. Fusarium wilt symptoms. Conclusion • Genotypes with stable and broad-based resistance to wilt identified. • Environments with most discriminating ability to wilt were also identified. • Application of GGE biplot facilitated the visual comparison and identification of stable genotypes in relation to the test environment. • The future work will be focused on incorporating these resistant genotypes into pigeonpea breeding program as well as incorporating the resistant genes into the new germplasm.