Valuations Perspective August 2020
•
0 gefällt mir•264 views

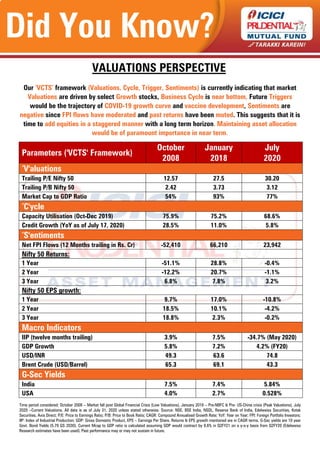
Business Cycle is near bottom, Future Triggers would be the trajectory of COVID-19 growth curve and vaccine development, Sentiments are negative since FPI flows have moderated and past returns have been muted.

Empfohlen
Weitere ähnliche Inhalte
Was ist angesagt?
Was ist angesagt? (20)
Ähnlich wie Valuations Perspective August 2020
Ähnlich wie Valuations Perspective August 2020 (20)
Mehr von iciciprumf
Mehr von iciciprumf (20)
Kürzlich hochgeladen
Kürzlich hochgeladen (20)
Valuations Perspective August 2020
- 1. Did You Know? Our ‘VCTS’ framework (Valuations, Cycle, Trigger, Sentiments) is currently indicating that market Valuations are driven by select Growth stocks, Business Cycle is near bottom, Future Triggers would be the trajectory of COVID-19 growth curve and vaccine development, Sentiments are negative since FPI flows have moderated and past returns have been muted. This suggests that it is time to add equities in a staggered manner with a long term horizon. Maintaining asset allocation would be of paramount importance in near term. Parameters ('VCTS' Framework) October January July 2008 2018 2020 ‘V'aluations Trailing P/E Nifty 50 12.57 27.5 30.20 Trailing P/B Nifty 50 2.42 3.73 3.12 Market Cap to GDP Ratio 54% 93% 77% ‘C'ycle Capacity Utilisation (Oct-Dec 2019) 75.9% 75.2% 68.6% Credit Growth (YoY as of July 17, 2020) 28.5% 11.0% 5.8% ‘S'entiments Net FPI Flows (12 Months trailing in Rs. Cr) -52,410 66,210 23,942 Nifty 50 Returns: 1 Year -51.1% 28.8% -0.4% 2 Year -12.2% 20.7% -1.1% 3 Year 6.8% 7.8% 3.2% Nifty 50 EPS growth: 1 Year 9.7% 17.0% -10.8% 2 Year 18.5% 10.1% -4.2% 3 Year 18.8% 2.3% -0.2% Macro Indicators IIP (twelve months trailing) 3.9% 7.5% -34.7% (May 2020) GDP Growth 5.8% 7.2% 4.2% (FY20) USD/INR 49.3 63.6 74.8 Brent Crude (USD/Barrel) 65.3 69.1 43.3 G-Sec Yields India 7.5% 7.4% 5.84% USA 4.0% 2.7% 0.528% Time period considered: October 2008 – Market fall post Global Financial Crisis (Low Valuations), January 2018 – Pre-NBFC & Pre- US-China crisis (Peak Valuations), July 2020 –Current Valuations. All data is as of July 31, 2020 unless stated otherwise. Source: NSE, BSE India, NSDL, Reserve Bank of India, Edelweiss Securities, Kotak Securities, Axis Direct; P/E: Price to Earnings Ratio; P/B: Price to Book Ratio; CAGR: Compound Annualised Growth Rate; YoY: Year on Year; FPI: Foreign Portfolio Investors; IIP: Index of Industrial Production; GDP: Gross Domestic Product, EPS – Earnings Per Share. Returns & EPS growth mentioned are in CAGR terms. G-Sec yields are 10 year Govt. Bond Yields (5.79 GS 2030). Current Mcap to GDP ratio is calculated assuming GDP would contract by 8.6% in Q2FY21 on a y-o-y basis from Q2FY20 (Edelweiss Research estimates have been used). Past performance may or may not sustain in future. VALUATIONS PERSPECTIVE
- 2. Did You Know? The „VCTS‟ (Valuations, Cycle, Trigger, Sentiments) framework is a market checklist which can be used to determine market valuations/conditions for investment at any given point in time. The framework can find application across asset classes. It aims to navigate markets efficiently by reflecting on various data points used in the framework. PE – Price-to-Earnings; PBV – Price to Book Value Ratio; COVID-19 is Coronavirus disease 2019. The information contained herein is only for the purpose of information and not for distribution and do not constitute an offer to buy or sell or solicitation of any offer to buy or sell any securities or financial instruments in the United States of America (“US”) and/or Canada or for the benefit of US persons (being persons falling within the definition of the term “US Person” under the US Securities Act, 1933, as amended) or persons residing in Canada. Mutual Fund investments are subject to market risks, read all scheme related documents carefully. ABOUT OUR ‘VCTS’ FRAMEWORK