Call Girls In Panjim North Goa 9971646499 Genuine Service
ICICI Prudential Global Stable Equity Fund presentation
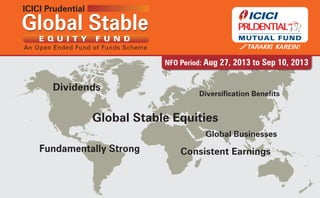
1. NFO Period: Aug 27, 2013 to Sep 10, 2013
Global StableGlobal Stable
An Open Ended Fund of Funds Scheme
E Q U I T Y F U N D
Fundamentally Strong
Diversification Benefits
Dividends
Global Stable Equities
Global Businesses
Consistent Earnings
2. Contents
Why invest outside India?1
Is it a good time to invest in developed world equity?2
The product – ICICI Prudential Global Stable Equity Fund3
2
4. Perspectives on Global investing
4
Asset Class
Perspective
Currency
Perspective
Business
Access
Perspective
Country
Risk
Perspective
5. 5
• Indian equities have shown extreme performance in recent past.
• Like Indian equities, global equities as an asset class, offer investment opportunities.
CY2006 CY2007 CY2008 CY2009 CY2010 CY2011 CY2012
Jan–July
2013
India India UK India Sweden US India Japan
Sweden Germany Canada Sweden India UK Germany US
Germany Australia Swiss Netherland Germany Japan Swiss
Australia Canada US Australia US Swiss France Netherland
Australia Canada Canada Netherland Netherland
France Netherland Sweden Canada Australia UK
Swiss US France US UK Australia Swiss Sweden
Canada UK France Netherland Sweden US France
Netherland France Japan UK France France Australia
US Swiss Germany Swiss Swiss Germany Sweden Germany
UK Sweden Netherland Germany Japan Japan UK Canada
Japan Japan India Japan Australia India Canada India
India India UK India Sweden US India Japan
Sweden Germany Canada Sweden India UK Germany US
Germany Australia Swiss Netherland Germany World Avg Japan Swiss
Australia Canada US Australia US Swiss France Netherland
World Avg World Avg Australia Canada Canada Netherland Netherland World Avg
France Netherland Sweden World Avg World Avg Canada Australia UK
Swiss US France US UK Australia Swiss Sweden
Canada UK World Avg France Netherland Sweden US France
Netherland France Japan UK France France World Avg Australia
US Swiss Germany Swiss Swiss Germany Sweden Germany
UK Sweden Netherland Germany Japan Japan UK Canada
Japan Japan India Japan Australia India Canada India
Better
Performing
Worse
Performing
Source: Bloomberg, The ranking is based on equity market performance which is calculated using individual MSCI Country & World Indices
Winners keep rotatingAsset Class
Perspective
6. Source: Bloomberg, Data as on 31/07/2013 6
Have Indian investors diversified?
• Indian equity represents ~2% of the world’s equity assets!
• The size of the untapped pool for Indian investors is too large to ignore
35.9%
7.7%
6.3%5.3%
5.6%
3.4%
5.4%
3.0%
2.5%
2.2%
20.9%
Countrywise share of World Market Cap
US
Japan
UK
China
Hong Kong
Canada
France
Germany
Switzerland
Australia
India
Others < 2%
35.9%
7.7%
6.3%5.3%
5.6%
3.4%
5.4%
3.0%
2.5%
2.2%
1.8%
20.9%
Asset Class
Perspective
7. 7
Source: Bloomberg. Correlation is a statistical measure of how two securities/indices move in relation to each other.
Correlation is on returns for period from 01/01/2003 to 31/07/2013. Returns are calculated using MSCI Country & World Indices.
Low correlation
• Investment in Global equities compliments Indian equities by offering low correlation and diversification
benefits
0.42
0.28
0.37
0.41 0.40
0.29
0.41 0.40 0.43 0.41 0.40
0.00
0.10
0.20
0.30
0.40
0.50
0.60
0.70
0.80
0.90
1.00 Correlation of Daily Returns with Indian Equities
0.42
0.28
0.37
0.41 0.40
0.29
0.41 0.40 0.43 0.41 0.40
0.00
0.10
0.20
0.30
0.40
0.50
0.60
0.70
0.80
0.90
1.00
Asset Class
Perspective
8. • Trade point of view: Currency of a high
growth country tends to depreciate, as
rising incomes lead to demand for
foreign goods and hence demand for
foreign currency (USD)
• Economic point of view: Currency of a
high inflation economy tends to
depreciate as it erodes purchasing
power and the same (imported) goods
cost more
• Flow point of view: Currency of a
country having low/negative real
interest rate tends to depreciate as
funds flow from low real rate to high
real rate economies
8Source: Bloomberg, Data as on 31/07/13
Weakening INR is structural and
fundamental
0
10
20
30
40
50
60
70
INR
INR/USD
Jul-73 Jul-77
INR
Jul-81 Jul-85 Jul-89 Jul-93 Jul-97 Jul-01 Jul-05 Jul-09 Jul-13
Currency
Perspective
9. 9
Businesses not available in India
• Does Indian equity market offer the avenue to invest in a company which runs the
world’s largest chain of discount stores?
• Can you invest in the world’s largest social network company which is part of the
Fortune 500 list?
• Would you want to invest in the world’s largest software company, but don’t know how
to invest, since it is not listed in India?
• Do you think that use of computers will proliferate and microchip stocks will gain, but
don’t know how to take exposure to the world’s largest microchip company?
• Looking at the global spends on defense, do you think companies in defense and
aerospace would do well, but don’t know how to invest in such companies?
Business
Access
Perspective
10. Source: Jefferies, Data as on 31/07/2013. The above is not an exhaustive list of risks. 10
India has inherent risks which
need to be addressed
• Risk of high Current Account Deficit
• Risk of eroding purchasing power
• Risk of high dependence on energy
import bill
• Political and economic risks
Allocation to multi-currency assets helps mitigate most of these risks
-4
-3
-2
-1
0
1
2
3
4
5
6
-40
-20
0
20
40
60
80
100
India's Current Account Balance
CAD (in USD bn) CAD (as % of GDP)- RHS
-4
-3
-2
-1
0
1
2
3
4
5
6
-40
-20
0
20
40
60
80
100
USD bn % of GDPIndia's Current Account Balance
CAD (in USD bn) CAD (as % of GDP)- RHS
Country
Risk
Perspective
11. IS IT A GOOD TIME TO INVEST INTO
DEVELOPED WORLD EQUITY?
11
12. Source: Bloomberg, EU – European Union, Data as on 31/07/2013
• Major global economies and regions are experiencing improving growth
• A falling unemployment rate augurs well for economic outlook for these global majors
Economic Fundamentals
12
US, 7.4
UK, 7.8
Japan, 3.9
Switzerland, 2.9
Canada, 7.1
0
2
4
6
8
10
12
Jan-03 Jul-04 Jan-06 Jul-07 Jan-09 Jul-10 Jan-12 Jul-13
Unemployment Rate (%)
US, 7.4
UK, 7.8
Japan, 3.9
Switzerland, 2.9
Canada, 7.1
0
2
4
6
8
10
12
Unemployment Rate (%)
EU, -0.3
-20
-15
-10
-5
0
5
10
15
US, 1.7
UK, 1.4
GDP Growth (% QoQ)
Jun-03
Jun-04
Jun-05
Jun-06
Jun-07
Jun-08
Jun-09
Jun-10
Jun-11
Jun-12
Jun-13
Jan-03 Jul-04 Jan-06 Jul-07 Jan-09 Jul-10 Jan-12 Jul-13
Japan, 4.1
13. Sentiment
13Source: Bloomberg, EU – European Union, Data as on 31/07/2013
• Buoyancy in consumer confidence, which has shown improvement from its 2008 lows, could improve demand
and aid faster recovery
• Purchasing managers seemed to be more positive on the economic outlook
Purchasing Managers Index (Range 1 to 100)
US, 52.3
UK, 54.6
EU, 50.3
Japan, 50.7
0
10
20
30
40
50
60
70
80
90
100
Jan-06Jul-06Jan-07Jul-07Jan-08Jul-08Jan-09Jul-09Jan-10Jul-10Jan-11Jul-11Jan-12Jul-12Jan-13Jul-13
Consumer Confidence Index
0
20
40
60
80
100
120
Jan-05
Jul-05
Jan-06
Jul-06
Jan-07
Jul-07
Jan-08
Jul-08
Jan-09
Jul-09
Jan-10
Jul-10
Jan-11
Jul-11
Jan-12
Jul-12
Jan-13
Jul-13
-120
-100
-80
-60
-40
-20
0
US (LHS) Japan (LHS) Euro Zone (RHS)
14. • Contrary to popular perception that less growth potential is the “new normal”, US corporate profits are in line with
previous trends
• The so called deleveraging US consumer is spending even more than in 2007
Corporate Health and Consumer
Spending in US
14Source: Citi Research. Data as available on 31/07/2013
US Corporate Profits
Real Personal Consumption Expenditures (SAAR, Bil.Chn.2005$)
15. • Most global equities offer higher dividend yields vs G-sec indicating valuations are still attractive after the
recent run-up
• Markets like US are outperforming traditional high beta markets like EM due to the ability to generate high
Free Cash Flow margins
Valuation
15Source: Citi Research. Data as available on 31/07/2013
Government Bond Yield vs Equity Dividend Yield Global Non-Financial Listed Companies Free Cash Flow
16. Is past performance an indication of future?
• In a Post-crisis world a repetition of large out performance may be less likely
• Since economies experience cycles of out & under performance, global exposure has its merits
16Source: J.P. Morgan, FactSet, and Dataquery
402.6%
200.4%
174.6%
95.9%
33.7%
-12.4%
97.7%
6.1%
-7.6%
25.5%
-2.7%-50%
0%
50%
100%
150%
200%
250%
300%
350%
400%
450%
Since Jan
2003
Since Jan
2004
Since Jan
2005
Since Jan
2006
Since Jan
2007
Since Jan
2008
Since Jan
2009
Since Jan
2010
Since Jan
2011
Since Jan
2012
Since Jan
2013
Market Performance of Major Economies as on July 31, 2013
World
US
Japan
UK
France
Australia
Sweden
India
402.6%
200.4%
174.6%
95.9%
33.7%
-12.4%
97.7%
6.1%
-7.6%
25.5%
-2.7%
50%
0%
50%
100%
150%
200%
250%
300%
350%
400%
450%
Since Jan
2003
Since Jan
2004
Since Jan
2005
Since Jan
2006
Since Jan
2007
Since Jan
2008
Since Jan
2009
Since Jan
2010
Since Jan
2011
Since Jan
2012
Since Jan
2013
Market Performance of Major Economies as on July 31, 2013
World
US
Japan
UK
France
Australia
Sweden
India
17. 17
Global Stable Equity FundGlobal Stable Equity Fund
An Open Ended Fund of Funds Scheme
The Product
• Long term wealth creation solution
• An open-ended fund of funds scheme that seeks to provide adequate returns by investing in the units of
one or more overseas mutual fund schemes, which have the mandate to invest globally
* Investors should consult their financial advisers if in doubt about whether the product is suitable for them.
HIGH RISK
(BROWN)
This product is suitable for investors who are seeking*:
(BLUE) investors understand that
their principal will be at low risk
(YELLOW) investors understand that
their principal will be at medium risk
(BROWN) investors understand that
their principal will be at high risk
Note: Risk may be represented as:
18. The Product Structure
18
INDIA LUXEMBOURG GLOBALLY
Investor
Global
Equities
ICICI Prudential
Global Stable
Equity Fund
(IPGSEF)
Nordea1 -
Global Stable
Equity Fund -
Unhedged
(Referred to as
‘Underlying Fund’)
19. • What it intends to achieve?
– Seeks to invest in stable companies globally
• with a view to outperform the market over a full market cycle
• with roughly two-thirds the volatility of the MSCI World Index*
• How it aims to achieve this?
– “Stability”: Seeks to identify universe of lower risk, stable companies based on
fundamental factors
– “Surprise Radar”: Validate that the above analysis which is based on historical factors, can
be expected to maintain its relevance in the future
– Utilize proprietary valuation models to identify attractively valued stocks and construct a
100-120 stock portfolio
The Underlying Fund: Investment Overview
19* Excess return and volatility numbers are only targets. There is no guarantee that these targets will be achieved.
20. 20
Stocks often behave like people…
……the more successful and popular they are the more ups and downs they experience in their lives.
Stress is guaranteed, but not a happy ending!
The Underlying Fund: The Philosophy
21. How does the fund pick stable return equities?
• Concentrate on absolute performance
• Look for ordinary “boring stories”
• Stable management
• Stable business model
• Stable profits
21
The alternative – stable return equities
The Underlying Fund: The Philosophy
Often unattractive when measured against a benchmark
but appealing from an absolute return standpoint
22. The Underlying Fund:
What are stable equities?
22
1
Earnings before interest, taxes, depreciation and amortisation.�
2
A valuation figure calculated as a company's current share price divided by its earnings per share.
A stable price performance alone is not enough
The Fund looks for as low
a price volatility as
possible
Past volatility may provide
information on future
volatility!
P/E = Price-earnings ratio2
A high ratio can give rise to
high risks.
The Fund looks for companies
with a stable earnings and
dividend trend
Financial variables can be
smoothed out. The Fund
therefore looks for stability in
transparent variables such as
cashflow and EBITDA1
Price = Earnings * P/E ratio
Broad Basis:
The stability analysis takes in a total of five criteria: Price,
Earnings, Dividends, EBITDA and Cashflows
24. The Underlying Fund: Holdings
24As on July 31, 2013
Country Weight
United States 55.42
Japan 9.24
United Kingdom 8.19
France 5.91
Switzerland 4.22
Canada 4.04
Spain 3.09
Others 8.40
Net Liquid Assets 1.49
Total 100.00
Sector Weight
Health Care 26.03
Information Technology 13.17
Consumer Staples 12.91
Telecommunication Services 9.00
Energy 8.10
Financials 7.76
Consumer Discretionary 7.54
Utilities 7.16
Others 8.33
Total 100.00
Top 10 Securities Weight
Microsoft 2.66
KDDI 2.52
Aflac 2.30
Novartis 2.28
Wal-Mart Stores 2.27
Chevron 2.22
Total Petrochemicals 2.21
Vinci 2.20
Stryker 2.19
Johnson & Johnson 2.15
25. The Underlying Fund: Sector changes overtime
25As on July 31, 2013
0%
10%
20%
30%
40%
50%
60%
70%
80%
90%
100%
Sector Distribution
Financials
Energy
Utilities
Info Tech
Health Care
Cons Staples
Cons Disc
Telecom Services
Industrials
Materials
Jan 2006 Jul 2006 Jan 2007 Jul 2007 Jan 2008 Jul 2008 Jan 2009 Jul 2009 Jan 2010 Jul 2010 Jan 2011 Jul 2011 Jan 2012 Jul 2012 Jan 2013 Jul 2013
26. IPGSEF: Investment Overview
26
• An open ended Fund of Funds scheme
• The scheme will primarily invest in
• units/shares of Nordea 1 - Global Stable Equity Fund - Unhedged (N1-GSEF-U)
• and/or any other overseas mutual fund schemes
• Benchmarked against the MSCI World Net Return Index
• Investment expertise of Nordea Investment Fund S.A. managing the “Stable Returns” strategy
since 2006
27. 27
IPGSEF: Investment Overview
India Day T
9.00 AM –3.00 PM (IST)
Investors submit request for purchase or
redemption of units at official acceptance points
India Day T+5
9.00 AM –3.00 PM (IST)
Monies for redemption request will
be credited to Investor Account post
conversion into INR
India Day T and T+1
Before 7.00 PM (IST)
Based on availabled funds / investment report, the fund manager shall place purchase / sell
order with Nordea
India Day T+3 and T+4
9.00 AM –3.00 PM (IST)
Settlement of deals based on the purchase / sell trade executed. FX rate will be fixed by the FM for sell orders
on receipt of USD in our account (T+4) and accordingly funds will be wired from USD account to INR account
India Day T+2
9.00 AM –3.00 PM (IST)
FX rate will be fixed by the FM for purchase orders and accordingly
funds will be remitted to the custodian for wire to USD account
28. Scheme Features
Options Direct Plan – Growth Option; Direct Plan – Dividend Option;
Regular Plan – Growth Option; Regular Plan – Dividend Option
Dividend payout and reinvestment facility available
Minimum Application Amount Rs 5,000 (plus in multiple of Re.1)
Minimum Additional Rs 1,000 (plus in multiple of Re.1)
Application Amount
Minimum Redemption Amount Rs. 500 (plus in multiple of Re. 1)
Entry Load Not Applicable
Exit Load For redemption/switch-out of units upto 3 months (including
the last day of the third month) from the date of allotment
For redemption/switch-out of units after 3 months but
before 18 months from the date of allotment
For redemption/switch-out of units after 18 months
from the date of allotment
Nil
Benchmark Index MSCI World - Net Return Index
3% of the
applicable NAV
1% of the
applicable NAV
28
Note: Investors may please note that they will be bearing the expenses of this Scheme in addition to the expenses of the
underlying Schemes in which this Scheme makes investment.
29. Disclaimers
Disclaimer: ICICI Prudential Asset Management Company Limited (the AMC) has used information that is publicly available, including information
developed in-house. Some of the material used in the document may have been obtained from members/persons other than the AMC and/or its affiliates
and which may have been made available to the AMC and/or to its affiliates. Information gathered and material used in this document is believed to be
from reliable sources. The AMC however does not warrant the accuracy, reasonableness and/or completeness of any information. For data reference to
any third party in this material no such party will assume any liability for the same. All recipients of this material should before dealing and or transacting
in any of the products referred to in this material make their own investigation, seek appropriate professional advice and carefully read the scheme
information document. We have included statements / opinions / recommendations in this document, which contain words, or phrases such as “will”,
“expect”, “should”, “believe” and similar expressions or variations of such expressions that are “forward looking statements”. Actual results may differ
materially from those suggested by the forward looking statements due to risk or uncertainties associated with our expectations with respect to, but not
limited to, exposure to market risks, general economic and political conditions in India and other countries globally, which have an impact on our services
and / or investments, the monetary and interest policies of India, inflation, deflation, unanticipated turbulence in interest rates, foreign exchange rates,
equity prices or other rates or prices, the performance of the financial markets in India and globally, changes in domestic and foreign laws, regulations and
taxes and changes in competition in the industry. All data/information used in the preparation of this material is dated and may or may not be relevant any
time after the issuance of this material. The AMC takes no responsibility of updating any data/information in this material from time to time.
The sector(s)/stock(s)/companies referred in this document do not constitute any recommendation of the same and underlying Scheme (viz. N1-GSEF-U) may
or may not have any future position in these sector(s)/stock(s)/ companies. Past performance may or may not be sustained in the future.
Investors may note that currently, the Scheme intends to invest in the units/shares of Nordea 1 – Global Stable Equity Fund – Unhedged (N1 – GSEF - U).
The Scheme may also invest in one or more other overseas mutual fund schemes, with similar investment policy / fundamental attributes and risk profile
and is in accordance with the investment strategy of the Scheme. Investors are requested to refer the SID of the Scheme for detail.
The AMC (including its affiliates), the Mutual Fund, the trust and any of its officers, directors, personnel and employees, shall not be liable for any loss,
damage of any nature, including but not limited to direct, indirect, punitive, special, exemplary, consequential, as also any loss of profit in any way arising
from the use of this material in any manner. The recipient alone shall be fully responsible/are liable for any decision taken on this material.
Mutual Fund investments are subject to market risks, read all scheme related documents carefully.
29