Weitere ähnliche Inhalte
Ähnlich wie Ijetcas14 396
Ähnlich wie Ijetcas14 396 (20)
Mehr von Iasir Journals (20)
Kürzlich hochgeladen (20)
Ijetcas14 396
- 1. International Association of Scientific Innovation and Research (IASIR)
(An Association Unifying the Sciences, Engineering, and Applied Research)
International Journal of Emerging Technologies in Computational
and Applied Sciences (IJETCAS)
www.iasir.net
IJETCAS 14-396; © 2014, IJETCAS All Rights Reserved Page 311
ISSN (Print): 2279-0047
ISSN (Online): 2279-0055
Effect of Varying Antenna Gain & Sectorization on Sites in LTE Radio
Access Network
Neeraj Kumar, Anil Kumar Shukla
Amity Institute of Telecom Engineering and Management
Amity University, Noida, INDIA
Abstract: In this paper, coverage estimation of Long Term Evolution (LTE) Radio Access Method (RAN) has
been performed with respect to varying antenna gain of eNodeB and sectorization of site layout of network sites.
Duplexing used for LTE is Time Division Duplexing. Three different site layouts have been configured to
estimate the number of sites required to cover the deployment area. In the first site layout, Single Omni
directional antenna is used, while in the second and third configuration, the network consists of a 3-sector-sites
and 6-sector sites respectively. These sectored sites replace the Omni-directional antenna with high gain
directional antenna, each placed such that to cover the entire sector area. Antenna gain has been varied as per
the site layout typical requirements. Thus, investigation has been carried to study the effect of sectorization and
antenna gain on the number of site required to cover the deployment area for different clutter type.
Keywords: LTE, RAN, Sectorization, Antenna gain, Site-layout
I. Introduction
Air interface dimensioning is the first step performed in order to provide first estimation of the sites volumes
which has to be taken into account when deploying Long Term Evolution (LTE) Radio Access Network (RAN).
It is executed in order to calculate, for a given geographical network area and a defined minimum quality of
service to be guaranteed at the cell edge, a qualified estimate of the number of sites, their density, cell ranges and
areas in correspondence with the pre-defined site layouts, clutter types and simulation cases. Sectorization is the
process in which a site is partitioned into multiple sectors and radio resource are used across each sectors and
sites, which increases the network capacity of system and service coverage is also increased using high gain
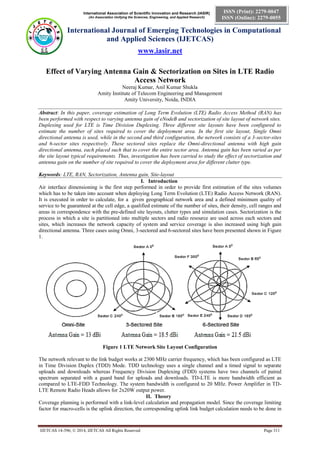
directional antenna. Three cases using Omni, 3-sectored and 6-sectored sites have been presented shown in Figure
1.
Figure 1 LTE Network Site Layout Configuration
The network relevant to the link budget works at 2300 MHz carrier frequency, which has been configured as LTE
in Time Division Duplex (TDD) Mode. TDD technology uses a single channel and a timed signal to separate
uploads and downloads whereas Frequency Division Duplexing (FDD) systems have two channels of paired
spectrum separated with a guard band for uploads and downloads. TD-LTE is more bandwidth efficient as
compared to LTE-FDD Technology. The system bandwidth is configured to 20 MHz. Power Amplifier in TD-
LTE Remote Radio Heads allows for 2x20W output power.
II. Theory
Coverage planning is performed with a link-level calculation and propagation model. Since the coverage limiting
factor for macro-cells is the uplink direction, the corresponding uplink link budget calculation needs to be done in
- 2. Neeraj Kumar et al., International Journal of Emerging Technologies in Computational and Applied Sciences, 8(4), March-May, 2014, pp.
311-316
IJETCAS 14-396; © 2014, IJETCAS All Rights Reserved Page 312
advance to calculate the maximum allowable Path loss. The calculation also includes the total interference, a sum
of all possible environment or system losses and gains and the hardware parameters of eNodeB and UE. Taking
into account of the uplink cell load and maximum allowable path loss obtained, further, cell radius calculation
based on the COST 231 propagation model has been calculated.
A. General Parameters
i. Operating Band: There are 8 different operating bands defined by 3GPP Rel. 8 for TD-LTE. This is the
frequency at which cellular communication is done.
ii. Channel Bandwidth: LTE provides scalable bandwidths, which is one of the biggest advantages of LTE
RAN. As per the requirements and licensing, bandwidth can be selected. Bandwidth provided by LTE
RAN system provides bandwidth 1.4 MHz, 3 MHz, 5 MHz, 10 MHz, 15 MHz and 20 MHz.
iii. Channel Model: Enhanced Pedestrian and Enhanced Typical Urban are two different channel models.
First one is used for users with low speed mobiles and other one is valid for high speed.
iv. Scheduling: There are two scheduling approach. They are as follows:
Round Robin: It is random allocation of resources in time and frequency domain without the
channel knowledge. The scheduler does not take into account historical knowledge about
experienced user data rates. The resource allocation is random and uses the frequency hopping
pattern.
Proportional Fair: It is allocation of resources in time and frequency domain with the channel
knowledge. The scheduler takes into account historical knowledge about experienced user data rates
and the achievable data rate.
v. Cell Edge Throughput: It defines the service that can be provided at the cell border. It can limit the
MCS (Modulation and Coding Scheme) to be used.
B. Transmitter Parameters
There are different transmitter parameter each for downlink and uplink. Down link transmitting end parameters is
Transmitted Power per Antenna, Antenna Gain, Cable loss and Total Transmitted Power Increase, whereas
receiver parameters are User Equipment Transmitter Power per Antenna, Antenna Gain, Body Loss and MHA
Insertion Loss.
i. Transmitted Power per Antenna: In downlink, Tx Power per Antenna depends on the channel
bandwidth, whereas in uplink, transmitted power depends on the UE Class.
ii. Antenna Gain: It is one of the parameter generally used to balance path loss in uplink and downlink. In
downlink, typical value of antenna gain ranges from 18 dBi to 22 dBi, whereas in Uplink, gain is taken
as 0, if UE lies in best coverage unless value change.
iii. Cable Loss: Sum of all the signal losses caused by the antenna line outside the BS cabinet. Different
Signal losses are Jumper Cable Losses, Feeder Cable Losses, Feeder Connector Losses and
Antenna/eNodeB Connector Loss. MHA insertion Loss in DL when MHA is used contributes typical
loss of 0.5 dB.
iv. Total Power per Antenna: It is used when multi antenna system is implemented in the system. Typical
value of Total Power per Antenna is 3dB.
v. EIRP: EIRP is abbreviated for Effective Isotropic Radiated Power from the transmitting antenna. It is
the measured radiated power in a single direction.
C. Receiver Parameter
There are different receiver parameter each for downlink and uplink. Downlink receiving end parameters is
Handset Noise Figure, Noise power per subcarrier, SINR Requirement and Number of Received Subcarriers
whereas receiver parameters for uplink are eNodeB Noise Figure, Noise power per subcarrier, SINR Requirement
and Number of Received Subcarriers
i. Noise Figure: It represents the additive noise generated by the equipment hardware components. It
depends on the type of device (UE or eNodeB) and frequency. Noise Figure is an indication of how
much noise in a given circuit or piece of equipment add to the signal.
ii. SINR Requirement: SINR is the minimum relation between useful signal and sum of interference
coming from own and neighbouring cells and the received noise power.
iii. Thermal Noise: Thermal noise is a random fluctuation in voltage caused by random motion of charge
carriers in any conduction medium at a temperature above absolute zero.
- 3. Neeraj Kumar et al., International Journal of Emerging Technologies in Computational and Applied Sciences, 8(4), March-May, 2014, pp.
311-316
IJETCAS 14-396; © 2014, IJETCAS All Rights Reserved Page 313
III. Calculations
Link Budget is calculated for four different clutter types – Dense urban, Urban, Sub urban and Rural. In the first
site layout configuration, the network consists of a single Omni directional antenna, while in the second and
third configuration, the network consists of a 3-sector-sites and 6-sector site respectively. These sectored sites
replace the Omni-directional antenna with high gain directional antenna, each placed in a way that covers the
sector. Antenna gain has been varied as per the site layout requirements. RLB calculations have been carried out
in the following steps:
A. Step 1: General Configuration Parameters for the dimensioning of LTE RAN is presented in Table 1.
Table 1 General Parameter Configuration
S. No. General Parameter Value/Specification
1. Operating Band 2300 MHz
2. Channel Bandwidth 20 MHz
3. Channel Model Enhanced Pedestrian
4. UE Class Type 3
5. Scheduling
Proportional Fair (Downlink)
Round Robin (Uplink)
6. Cell Edge Throughput (kbps)
4096 (Downlink)
384 (Uplink)
Step 2: Based on the transmitting end parameter, EIRP is calculated for both DL and UL. EIRP is the amount of
power being radiated from the transmitting antenna in a single direction. Table 2 and 3 presents EIRP value for
DL and UL respectively.
Table 2 Transmitter Parameter Configuration for Downlink
S.No. Transmitter Parameter Value
1. Transmitted Power per Antenna (dBm) 43 43 43 a
2. Antenna Gain (dBi) 13 18.5 21.5 b
3. Cable Loss (dB) 0.4 0.4 0.4 c
4. Total Transmitted Power Increase (dB) 3.0 3.0 3.0 d
5. EIRP (dBm) 58.6 64.1 67.1 e= a + b – c + d
Table 3 Transmitter Parameter Configuration for Uplink
S. No. Transmitter Parameter Value
1. User Equipment Transmitted Power per Antenna (dBm) 23 a
2. Antenna Gain (dBi) 0.0 b
3. MHA Insertion Loss (dB) 0.0 c
4. EIRP (dBm) 23 e = a + b - c
Step 3: Receiver Parameter and Allowed Propagation Loss for DL and UL is presented in Table 4 and 5
respectively. Receiver Sensitivity is calculated using the receiver end parameters. Then, Allowed Propagation
Loss is calculated using the Transmitting and receiving end parameters for DL and UL. Receiver Sensitivity is the
minimum signal level for which a service of acceptable quality will be provided and allowed propagation loss, is
the value for which UL and DL needs to be balanced.
Table 4 Receiver Parameter Configuration for Downlink
S. No. Receiver Parameters Value
1. Handset Noise Figure (dB) 7 7 7 f
2. Thermal Noise (dBm) -101.37 -101.37 -101.37 g
3. SINR Requirement (dB) 0.07 0.07 0.07 h
4. Receiver Sensitivity (dBm) -94.3 -94.3 -94.3 i = f + g + h
5. Receiver Antenna Gain (dB) 0.0 0.0 0.0 j
6. Downlink Load 75 % 75 % 75 % k
7. Interference Margin (dB) 6.3 6.3 6.3 l
8. Allowed Propagation Loss (dB) 146.6 152.1 155.1 m = e – i + j - l
- 4. Neeraj Kumar et al., International Journal of Emerging Technologies in Computational and Applied Sciences, 8(4), March-May, 2014, pp.
311-316
IJETCAS 14-396; © 2014, IJETCAS All Rights Reserved Page 314
Table 5 Receiver Parameter Configuration for Uplink
S. No. Receiver Parameters (Uplink) Value
Site Layout Omni 3-Sector 6-Sector
1. eNodeB Noise Figure (dB) 3 3 3 f
2. Thermal Noise (dBm) -107.57 -107.57 -107.57 g
4. Receiver Sensitivity (dBm) -108.46 -108.46 -108.46 i = f + g + h
5. Receiver Antenna Gain (dB) 13.0 18.5 21.5 j
6. Uplink Load 60 % 60 % 60 % k
7. Interference Margin (dB) 2.3 2.3 2.3 l
8. Allowed Propagation Loss (dB) 142.16 147.66 150.66 m = e – i + j - l
Step 4: Limiting value (which is generally the Uplink Allowed Propagation Loss) of allowed propagation loss
has been taken for the calculation of MAPL for four different clutter types. Modeling is done using COST 231
Model, path loss formulas of this model are defined in equation 1. Table 6 and 7 presents UE Height and Clutter
correction factors for COST 231 Model respectively. MAPL calculations and propagation modeling of LTE RAN
is presented in Table 8, 9 and 10. Cell range d is calculated by solving the propagation equation for the MAPL,
MAPL = L (d).
L = 46.30 + 33.90*Log f (MHZ) – 13.82*Log h eNB (m) – a* h BS (m) + s * Log (d km) + L clutter (1)
where Slope Factor, s = (47.88 + 13.9 * Log f (MHz) – 13.82 * Log h BS (m)) * (1/Log 50) (2)
Table 6 UE height Correction Factors
Table 7 Clutter Type Correction Factors
Radio Network Configuration parameters are cell area, site-to-site distance and site area. These parameters are
used to obtain the site count. The cell range calculated from the link budget analysis and is used as input
parameter to calculate radio network configuration parameter. These calculations depend on the type site layout ,
i.e., number of sectors at network site.
Cell Area = 2.6 x R2
(Omni- or 6-Sectored Site)
0.65 x R2
(3-Sectored Site) (3)
Inter-site Distance = 1.73 x R (Omni- or 6-Sectored Site)
1.5 x R (3-Sectored Site) (4)
Site Area = 2.6 x R2
(Omni- or 6-Sectored Site)
1.95 x R2
(3-Sectored Site) (5)
Site Count = Deployment Area / Site Area (6)
where, R is cell range in Km.
Cell Range = ((MAPL – (Intercept Point + Clutter Correction Factor))/Slope Factor (7)
- 5. Neeraj Kumar et al., International Journal of Emerging Technologies in Computational and Applied Sciences, 8(4), March-May, 2014, pp.
311-316
IJETCAS 14-396; © 2014, IJETCAS All Rights Reserved Page 315
Table 8 Omni-Site Layout, Transmitting Antenna Gain at DL is 13.0 dBi
Allowed Propagation Loss (dB) 142.26 m
Clutter Type Dense Urban Urban Suburban Rural
BTS Antenna Height (m) 30.0 30.0 30.0 50.0 n
MS Antenna Height (m) 1.5 1.5 1.5 1.5 o
Average Penetration Loss (dB) 20.0 15.0 10.0 5.0 p
Standard Deviation Outdoor (dB) 9.0 8.0 8.0 7.0 q
Cell Area Probability 94.0% 94.0% 94.0% 94.0% r
Log Normal Fading Margin (dB) 8.46 7.52 7.52 6.58 s = q*r
Gain Against Shadowing (dB) 2.8 2.4 2.4 2.1 t = f(n, q, s)
Maximum Allowable Path Loss (dB) 133.52 137.18 142.18 145.94 u = m – p + s + t
Propagation Model COST 231
Intercept Point (dB) 139.85
Slope Factor (dB) 44.11
Clutter Correction Factor (dB) 3.0 0.0 -13.14 -34.09
Cell Range (Km) 0.615 0.87 2.243 8.146 R
Cell Area (Km2
) 0.984 1.968 13.081 172.53 CA = SA
Site Area (Km2
) 0.984 1.968 13.081 172.53 SA = 2.6 x R2
Inter-Site Distance (Km) 1.064 1.506 3.881 14.093 ISD = 1.73 x R
Deployment Area (Km2
) 50 50 50 50 DA
Site Count 51 26 4 1 SC = DA/SA
Table 9 3-Sectors Site Layout, Transmitting Antenna Gain at DL is 18.5 dBi
Allowed Propagation Loss (dB) 147.66 m
Clutter Type Dense Urban Urban Suburban Rural
BTS Antenna Height (m) 30.0 30.0 30.0 50.0 n
MS Antenna Height (m) 1.5 1.5 1.5 1.5 o
Average Penetration Loss (dB) 20.0 15.0 10.0 5.0 p
Standard Deviation Outdoor (dB) 9.0 8.0 8.0 7.0 q
Cell Area Probability 94.0% 94.0% 94.0% 94.0% r
Log Normal Fading Margin (dB) 8.46 7.52 7.52 6.58 s = q*r
Gain Against Shadowing (dB) 2.8 2.4 2.4 2.1 t = f(n, q, s)
Maximum Allowable Path Loss (dB) 138.92 142.58 147.58 151.34 u = m – p + s + t
Propagation Model COST 231
Intercept Point (dB) 139.85
Slope Factor (dB) 44.11
Clutter Correction Factor (dB) 3.0 0.0 -13.14 -34.09
Cell Range (Km) 0.815 1.154 2.973 10.798 R
Cell Area (Km2
) 0.44 0.87 5.75 75.79 CA = SA/3
Site Area (Km2
) 1.296 2.597 17.236 227.364 SA = 1.95 x R2
Inter-Site Distance (Km) 1.2225 1.731 4.4595 16.197 ISD = 1.5 x R
Deployment Area (Km2
) 50 50 50 50 DA
Site Count 39 20 3 1 SC = DA/SA
Table 10 6-Sectors Site Layout, Transmitting Antenna Gain at DL is 21.5 dBi
Allowed Propagation Loss (dB) 150.66 m
Clutter Type Dense Urban Urban Suburban Rural
BTS Antenna Height (m) 30.0 30.0 30.0 50.0 n
MS Antenna Height (m) 1.5 1.5 1.5 1.5 o
Average Penetration Loss (dB) 20.0 15.0 10.0 5.0 p
Standard Deviation Outdoor (dB) 9.0 8.0 8.0 7.0 q
Cell Area Probability 94.0% 94.0% 94.0% 94.0% r
Log Normal Fading Margin (dB) 8.46 7.52 7.52 6.58 s = q*r
Gain Against Shadowing (dB) 2.8 2.4 2.4 2.1 t = f(n, q, s)
Maximum Allowable Path Loss (dB) 141.92 145.58 150.58 154.34 u = m – p +s + t
Propagation Model COST 231
Intercept Point (dB) 139.85
Slope Factor (dB) 44.11
Clutter Correction Factor (dB) 3.0 0.0 -13.14 -34.09
Cell Range (Km) 0.953 1.349 3.477 12.629 R
Cell Area (Km2
) 0.394 0.789 5.239 69.114 CA = SA/6
Site Area (Km2
) 2.362 4.732 31.433 414.679 SA = 1.95 x R2
Inter-Site Distance (Km) 1.649 2.334 6.016 21.849 ISD = 1.5 x R
Deployment Area (Km2
) 50 50 50 50 DA
Site Count 22 11 2 1 SC = DA/SA
IV. Discussion
Sectorization is an approach which enhances capacity of the network and increases radio resource usage. In this
method, cell radius does not changes but at the same time it is necessary to reduce the relative interference
- 6. Neeraj Kumar et al., International Journal of Emerging Technologies in Computational and Applied Sciences, 8(4), March-May, 2014, pp.
311-316
IJETCAS 14-396; © 2014, IJETCAS All Rights Reserved Page 316
without decreasing the transmit power. Omni directional antenna at the eNodeB is replaced by high gain
directional antennas, each radiating within a specified sector.
Number of site count for different clutter types based on coverage estimation is presented in Table 8, 9 and 10. It
is seen than when sectorization is performed on sites, antenna gain is increased in typical range. Omni- site has
antenna of 13 dBi and in 3-Sector and 6-Sector sites 13 dBi antenna is replaced by directional high gain antenna
having gain of 18.5 dBi and 21.5 dBi respectively. Number of site count for 50 Km2
(Deployment Area)
decreases because value of MAPL increases. If the gain of antenna is kept constant, then number of sites required
to cover deployment area increases because of the sectorization.
V. Conclusion
Radio Coverage estimation for LTE radio access network has been analyzed in detail for different clutter types.
In LTE, OFDMA minimizes the intra-sector interference by orthogonal allocation of the sub-carriers to the
scheduled users. However, due to a 1/1 reuse factor and non-ideal radiation pattern of the sector antennas, intra-
site and inter-site interference are still present. Furthermore, the higher number of interferers and the wider
overlapping regions of 6-sector sites lead to a higher interference compared to a 3-sector-sites deployment.
Maximum allowable path loss is increased as the sectorization of site is performed because of the increase in
antenna gain at eNodeB. First site configuration (omni-sites) has the highest number of sites requirement to cover
the deployment area as compared to other two site layout configurations namely 3 sector and 6 sector sites.
Moreover increasing amount of sectorization shows that the number of users gradually increases because of the
increase in coverage area of each site.
VI.References
[1] H. Holma et al (eds.), LTE for UMTS, Wiley, 2009.
[2] 3GPP TS 25.814, v7.1.0, 2006.
[3] H.Holma and A.Toskala, "LTE for UMTS: OFDMA and SC-FDMA based radio access", John Wiley & Sons, 2009.
[4] S. Sesia, I. Tou_k, M. Baker, "LTE - The UMTS Long Term Evolution: From Theory to Practice", John Wiley & Sons Ltd.,
2011.
[5] J.C. Ikuno, M. Wrulich, M. Rupp, "System level simulation of LTE networks", IEEE Vehicular Technology Conference
VTC2010 spring, Taipi, Taiwan, May 2010.
[6] S. Kumar, I.Z. Kov_acs, G. Monghal, K.I. Pedersen, P.E. Mogensen, "Performance Evaluation of a 6-Sector-Site Deployment for
Downlink UTRAN Long Term Evolution", IEEE Proc. Vehicular Technology Conference, September 2008.
VI. Acknowledgments
We are very much thankful to Nokia Solutions and Networks, Gurgaon for providing essential documents and training to complete this
project.