The Liquefied Natural Gas (LNG) Life Cycle
•
22 gefällt mir•7,573 views

This document provides an overview of the liquefied natural gas (LNG) life cycle, including liquefaction, transportation by ship and pipeline, storage, and regasification. It discusses the global growth of LNG trade in recent decades driven by new liquefaction facilities and expanding regasification capacity. New technologies like floating LNG and storage/regasification units have helped increase access to remote gas reserves and new markets. Overall the document outlines the key stages and evolving infrastructure involved in the production and distribution of LNG as a fuel on a global scale.

Empfohlen
Weitere ähnliche Inhalte
Was ist angesagt?
Was ist angesagt? (20)
Ähnlich wie The Liquefied Natural Gas (LNG) Life Cycle
Ähnlich wie The Liquefied Natural Gas (LNG) Life Cycle (20)
Mehr von Geology Department, Faculty of Science, Tanta University
Mehr von Geology Department, Faculty of Science, Tanta University (20)
Kürzlich hochgeladen
Kürzlich hochgeladen (20)
The Liquefied Natural Gas (LNG) Life Cycle
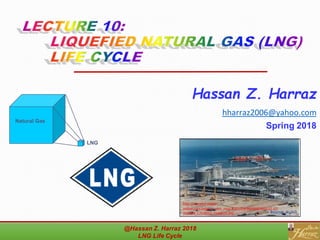
- 1. Hassan Z. Harraz hharraz2006@yahoo.com Spring 2018 Natural Gas LNG http://content.edgar- online.com/edgar_conv_img/2007/03/30/0000950152-07- 002894_L25400AL2540013.JPG @Hassan Harraz 2018 LNG Life Cycle@Hassan Z. Harraz 2018 LNG Life Cycle 1
- 2. OUTLINES LECTURE • This Introduction to Liquefied Natural Gas (LNG) Life Cycle overview includes: @Hassan Harraz 2018 LNG Life Cycle 2 LNG Is LNG a safe fuel? Quality of LNG Sales LNG/Gas Specifications NATURAL GAS VALUE CHAIN LNG TRANSPORTATION Global Movement of NaturalGas Movement of NaturalGas Movement: Pipelines and Storage NaturalGas Infrastructure: Pipeline Systems Types of Pipelines Offshore Pipelines Movement: LNG Liquefied NaturalGas (LNG) LNG Markets (R)evolution LIQUEFACATION REGASIFICATION PIPELINE NETWORK: Revolutionary LNG Technologies: FLNG and FSRU FLOATING LNG (FLNG) FLOATING STORAGE AND REGASIFICATION(FSRU) ENERGY ACCESS Storage MARKETS Global Natural Gas Trade Market Players Natural Gas Price Formation Liberalizing Market Dynamics Natural Gas Contracts
- 3. 5 64321 Dock-1 Dock-2 Dock-3 H G F E A D B C LPG Tanks LNG Plant Site Bontang Indonesia With 8 trains running, the capacity of the plant has reached 22.25 MMT/year LNG, 1 MMT/year LPG and 10 MMbbl/year condensates. STORAGE : LNG : 4 x 95,000 m3 + 2 x 125,000 m3 LPG : 5 X 40,000 m3 Cond. : 10,000 m3 + 12,000 m3 LNG BADAK Sources: Ministry of Energy and Mineral Resources of the Republic of Indonesia @Hassan Harraz 2018 LNG Life Cycle 3
- 4. 1) The Liquefied Natural Gas (LNG) Life Cycle
- 5. The Liquefied Natural Gas (LNG) Life Cycle @Hassan Harraz 2018 LNG Life Cycle 5
- 6. Liquefaction Facilities Source: ALNGSource: ALNG The main cost-cutting measures put into effect include improvements in the design efficiency of LNG plant, improvements in liquefaction technology, and improved economies of scale. The improvements in liquefaction technology have included optimization of air and water-cooling, and a reduction in design redundancy. @Hassan Harraz 2018 LNG Life Cycle 6
- 7. LNG Chain @Hassan Harraz 2018 LNG Life Cycle 7
- 8. Offshore Liquefaction Floating Production Storage and Offloading (FPSO) http://braxtonlng.com/LNGFPSOs.aspx @Hassan Harraz 2018 LNG Life Cycle 8
- 9. Liquefaction Costs Transformed 0 100 200 300 400 500 600 700 1990 1995 1999 Trinidad 00 Future LNG $pertonneofcapacity Source: BP 0 50 100 150 200 250 300 350 400 mid 1990 2002 2010 2030 $/tonne Liquefaction Source: IEA Technology improvement, higher capacity plants, improved economies of scale @Hassan Harraz 2018 LNG Life Cycle 9
- 10. 2) BASİC FACTS ABOUT LNG
- 11. 5% 15% 100% Over-Rich Will not burn Flammable Too Lean - Will not burnLower Flammability Limit (LFL) Upper Flammability Limit (UFL) 5% 15% 100% Over-Rich Will not burn Flammable Too Lean - Will not burnLower Flammability Limit (LFL) Upper Flammability Limit (UFL) Flammable Range for LNG (Methane) LNG Properties Density: 3.9 ppg (Water 8.3 ppg) LNG floats on water. Flammability: range 5 – 15%. @Hassan Harraz 2018 LNG Life Cycle
- 12. Is LNG A Safe Fuel?
- 13. Comparison of Properties of Liquid Fuels LNG Liquefied Petroleum Gas (LPG) Gasoline Fuel Oil Toxic No No Yes Yes Carcinogenic No No Yes Yes Flammable Vapor Yes Yes Yes Yes Form Vapor Clouds Yes Yes Yes No Asphyxiant Yes, but in a vapor cloud Yes, same As LNG No No Extreme Cold Temperature Yes Yes, if refrigerated No No Other health hazards None None Eye irritant, narcosis, nausea, others. Same as gasoline Flash point o F -306 -156 -50 140 Boiling point o F -256 -44 90 400 Flammability Range in air % 5-15 2.1-9.5 1.3-6 N/A Stored Pressure Atmospheric Pressurized (atmospheric if refrigerated) Atmospheric Atmospheric Behavior if spilled Evaporates, forming visible “clouds”. Portions of cloud could be flammable or explosive under certain conditions. Evaporates, forming vapor clouds which could be flammable or explosive under certain conditions. Evaporates, forms flammable pool; environmental clean up required. Same as gasoline Source: Lewis, William W., Lewis, James P, Outtrim, Patricia A., PTL: LNG Facilities - The Real Risk, AiChE Meeting, New Orleans, April 2003 as modified by industry sources. @Hassan Harraz 2018 LNG Processes
- 14. Fuel Auto-ignition Temperature (oF) LNG (primarily methane) 1004 LPG 850-950 Ethanol 793 Methanol 867 Gasoline 495 Diesel Fuel Approx. 600 Source: New York Energy Planning Board, Report on issues regarding the existing New York Liquefied Natural Gas Moratorium, November 1998 Auto-Ignition Temperature of Liquid Fuels 14
- 15. 2.1) Quality of LNG “Off-Specification Off-Quality” Gas or LNG
- 16. Quality of LNG (…cont.) Wobbe Index: Soot Index The dewpoint is a saturation temperature. Heating value (HV) @Hassan Harraz 2018 LNG Life Cycle 16
- 17. 2.2) Sales LNG/Gas Specifications
- 18. @Hassan Harraz 2018 LNG Life Cycle 18 3) LNG TRANSPORTATION
- 19. 3.1) Global Movement of Natural Gas
- 20. • Figure 2: LNG Distribution Options as a function of Volume and Distance Source: Swedegas AB @Hassan Harraz 2018 LNG Life Cycle 20
- 21. @Hassan Harraz 2018 LNG Life Cycle 21
- 22. LNG Value Network Source: Shell @Hassan Harraz 2018 LNG Life Cycle 22
- 23. LNG as Fuel Applications Source: Shell @Hassan Harraz 2018 LNG Life Cycle 23
- 24. 3.2) Shipping Source: BGSource: BG LNG tankers are double-hulled ships specially designed and insulated to prevent leakage or rupture in an accident. LNG shipped in large vessels with cryogenic tanks. LNG is a cryogenic liquid and it is stored in double-walled tanks at atmospheric pressure. The LNG shipping market is expanding. New Technology: Ship-to-ShipTransfer (STS) Vessel Capacity: First LNG tankers: 27,400 cubic meters (cu m) In 2007, vessels averaged 266,000 cu m Decrease in costs by 45% from early 1990’s due to increase in vessel capacity. Limitations: restrictions on import vessel size, maximum capacity of regasification equipment 166 existing LNG ships, as of Nov 2004 with 105 on order. The fleet size needs to increase by 3-4 times to meet the projected growth in trade by 2030. Source: NLNG @Hassan Harraz 2018 LNG Life Cycle 24
- 25. Ship-to-Ship Transfer (STS) • New Technology: Ship-to-Ship Transfer (STS) • Emergence of Offshore regasification and liquefaction • New vessels may now have capability to transfer or receive loads http://www.thedigitalship.com/powerpoints/norship05/lng/Trym%20Tveitnes,%20HOEGH.pdf @Hassan Harraz 2018 LNG Life Cycle 25
- 26. Tanker Cost are Dropping LNG Shipping Costs LNG Spot Cargo - Volume @Hassan Harraz 2018 LNG Life Cycle 26
- 27. Arbitrage and swap opportunities Shipping opportunities Source: BG @Hassan Harraz 2018 LNG Life Cycle 27
- 28. 3.3) Railway
- 29. 3.4) Pipelines
- 31. @Hassan Harraz 2018 LNG Life Cycle 31
- 32. Movement Of Natural Gas @Hassan Harraz 2018 LNG Life Cycle 32
- 33. 3.4.3) Types of Pipelines Transmission lines Supply lines Distribution lines . Service lines Offshore Pipelines
- 34. @Hassan Harraz 2018 LNG Life Cycle 34 Types of Pipelines
- 35. 4) LNG MARKETS (R)EVOLUTION In 2016, a total of 35 countries received LNG shipments, while global regasification capacity has doubled in the last decade. Liquefacation Regasification @Hassan Harraz 2018 LNG Life Cycle 35 LNG Markets (R)evolution
- 37. Liquefaction Capacity and Utilization by Country @Hassan Harraz 2018 LNG Life Cycle 37
- 38. Note: Liquefaction capacityonly takes into account existing and under construction projects expected onlineby 2020. Sources: IHS, IGU, Company Announcements +40% by 2020 Expected growth in global liquefaction capacity. Liquefaction Capacity by Country in 2014 and 2020 @Hassan Harraz 2018 LNG Life Cycle 38
- 39. Liquefaction Capacity by Region in 2008, 2014 and 2020 Note: Liquefaction capacity only refers to existing and under construction projects. Sources: IHS, Company Announcements @Hassan Harraz 2018 LNG Life Cycle 39
- 40. @Hassan Harraz 2018 LNG Life Cycle 40 Global Gas Liquefaction Capacity
- 41. Liquefaction Capacity by Region in 2008, 2014 and 2020 Region 2008 2014 2020 (Anticipated) % Growth 2008- 2014 (Actual) % Growth 2014-2020 (Anticipated) Africa 58.7 69.9 69.9 19% 0% Asia Pacific 81.2 95.3 158.1 17% 66% Europe 3.4 4.2 4.2 24% 0% FSU 0 9.6 26.1 0% 172% Latin America 15.5 20 20.5 29% 3% North America 1.5 1.5 44.1 0% 2840% Middle East 46.8 100.8 100.8 115% 0% Total Capacity 207.1 301.2 423.7 45% 41% Note: Liquefaction capacity only refers to existing and under construction projects. Sources: IHS, Company Announcements @Hassan Harraz 2018 LNG Life Cycle 41
- 42. Liquefaction Capacity and Utilization by Country, 2014 Sources: IHS, IGU @Hassan Harraz 2018 LNG Life Cycle 42
- 44. @Hassan Harraz 2018 LNG Life Cycle 44 Regasification capacity growth
- 45. Regasification Plant in Sabine, TX to receive LNG from Qatar (2009) ExxonMobile Corporation: Form 8-K, current report @Hassan Harraz 2018 LNG Life Cycle 45
- 46. 4.2.1) Offshore Regasification New Technology: Offshore Regasification US to build two Offshore plants, one already under construction Floating Storage and Regasification Unit (FSRU) @Hassan Harraz 2018 LNG Life Cycle 46
- 47. Energy Bridge (Shuttle and LNG Regasification System), Excelerate, Offshore LA. The Energy Bridge is a regasification vessel and a buoy system that delivers natural gas into offshore pipelines. Source: El Paso @Hassan Harraz 2018 LNG Life Cycle
- 48. Offshore Storage & Regasification Terminals Proposed Cabrillo Port FSRU (Floating Storage and Re-gasification Unit), Oxnard, CA. Source: BHP Proposed ChevronTexaco Port Pelican Project, offshore Louisiana - Gravity-based structure Source - ChevronTexaco @Hassan Harraz 2018 LNG Life Cycle
- 49. 4.2.2) Composition Control of Natural Gas
- 50. 4.3) Revolutionary LNG Technologies: FLNG and FSRU A) FLOATING LNG (FLNG) B) FLOATING STORAGE AND REGASIFICATION (FSRU)
- 51. Revolutionary LNG Technologies: FLNG and FSRU @Hassan Harraz 2018 LNG Life Cycle 51
- 52. 4.3) Revolutionary LNG Technologies: FLNG and FSRU
- 53. Floating Storage and Regasification (FSRU) @Hassan Harraz 2018 LNG Life Cycle 53
- 54. 5) STORAGE
- 55. LNG Storage
- 56. @Hassan Harraz 2018 LNG Life Cycle 56
- 57. 5.1) Storage and Regasification Facilities 0 20 40 60 80 100 120 140 mid 1990 2002 2010 2030 $/tonne Regasification and Storage Source: IEA Storage and Regasification Cost is Dropping Larger capacity plants, improved economies of scale • At the receiving terminal the LNG is pumped into a double-walled storage tank. • Vaporized by warming in a controlled environment. • Vaporized gas is regulated for pressure and enters the natural gas pipeline system. • Residential and commercial consumers receive natural gas for daily use from local gas utilities or in the form of electricity. @Hassan Harraz 2018 LNG Life Cycle
- 58. Receiving Terminal Import Capacityand Utilization Rate by Country in 2014 and 2020 Sources: IHS, Company Announcements @Hassan Harraz 2018 LNG Life Cycle
- 59. LNG Storage Tank Capacity by Country (mmcm) and % of Total, as of Q1 2015 Note: “Smaller Markets” includes Argentina, the Dominican Republic, Greece, Israel, Kuwait, Malaysia, Puerto Rico and the UAE. Each of these markets has under 0.3 mmcm of capacity. Sources: IHS, Company Announcements @Hassan Harraz 2018 LNG Life Cycle 59
- 60. Main Pass Energy Hub Cavern-based LNG Receiving Facility McMoran, LA. The Bishop Process • receive LNG directly from an offshore tanker, • pressurize and warm it to 40oF, • Inject the resulting natural gas into underground salt caverns for storage. • effectively eliminate the need to build expensive above-ground cryogenic storage tanks Source: Conversion Gas Import http://www.conversiongas.com/html/bishop_processtm.html @Hassan Harraz 2018 LNG Life Cycle
- 61. 5) LNG LİQUEFACTİON TERMİNALS 5.1) Liquefaction Terminals 5.2) Regasification Terminals @Hassan Harraz 2018 LNG Life Cycle 61
- 62. Ras Laffan IndustrialCity-Libya, LNG Vessels Loading 6) NATURAL GAS TERMİNALS @Hassan Harraz 2018 LNG Life Cycle
- 63. Wartsila Diesel (2008) 5.1) LNG Liquefaction Terminals @Hassan Harraz 2018 LNG Life Cycle 63
- 64. 5.1) LNG Liquefaction Terminals Natural gas market is 60% of the crude oil market of which LNG forms a small but rapidly groving part Japan, South Korea, Spain, France, Italy and Taiwan impoert large volluems of LNG due to their shortege of energy Japan imported 58.6 million tons of LNG representing some %30 of the LNG trade around the World in 2005 @Hassan Harraz 2018 LNG Life Cycle 64
- 65. 5.2) Regasification Terminals Wartsila Diesel (2008) @Hassan Harraz 2018 LNG Life Cycle 65 Regassification terminals reheats the LNG and turns into gas. Regasification terminals are usually connected to storage and pipeline distribution network to LDC (Local Distribution Companies) or IPP (İndependent Power Plants)
- 66. 6) NATURAL GAS MARKETS @Hassan Harraz 2018 LNG Life Cycle 66
- 67. 6.1) LNG as a Market
- 68. 6.2) LNG Value Chain EXPLORATION & PRODUCTION LIQUEFACTION SHIPPING REGASIFICATION & STORAGE $1.0 - $2.5 billion $1.5 – 2.0 billion $0.8 - $2.3 billion $0.5 - $1.0 billion $0.5-$1.0/MMBtu $0.8-$1.20/MMBtu $0.4-$1.0/MMBtu $0.3-$0.5/MMBtu TOTAL = $3.7 - $7.8 billion or $2.00 - $3.70/MMBTU Sources: BG, ALNG, CMS, Industry Greatest variability is in upstream feedstock for liquefaction and shipping distance. How Much Does LNG Cost? Energy companies must invest in the LNG value chain. @Hassan Harraz 2018 LNG Life Cycle
- 69. Capital and Operating Costs of LNG ‘Value Chain Exploration & Treatment & Shipping Storage & Distribution Production Liquifaction Regasification & Marketing 15-20% 30-45% 10-30% 15-25% Sources: BG, ALNG, CMS @Hassan Harraz 2018 LNG Life Cycle 69
- 70. 6.3) Global Natural Gas Trade
- 71. Natural Gas Global Trade: 2016 (in bcm) @Hassan Harraz 2018 LNG Life Cycle 71
- 72. Major LNG Shipping Routes (2016) @Hassan Harraz 2018 LNG Life Cycle 72
- 73. 6.4) Market Players @Hassan Harraz 2018 LNG Life Cycle 73 10 Largest Importers in 2016 (bcm) 10 Largest Exporters in 2016 (bcm) Top LNG Importers Top Pipeline Importers Country Imports in 2016 (bcm) Country Imports (bcm) Japan 108.3 Germany 99.3 S. Korea 43.8 US 82.5 China 34.8 Italy 59.4 India 25.0 Mexico 38.4 Taiwan 19.5 China 38.0 Spain 12.9 Netherlands 38.0 UK 9.6 Turkey 37.4 Egypt 9.5 UK 34.1 France 7.3 France 32.3 Turkey 7.3 Belgium 22.2 Top LNG Exporters Top Pipeline Exporters Country Exports in 2016 (bcm) Country Exports (bcm) Qatar 100.4 Russian 190.8 Australia 57.6 Norway 109.8 Malaysia 32.5 Canada 82.4 Nigeria 24.2 US 60.3 Indonesia 21.6 Netherlands 52.3 Algeria 15.0 Turkmenistan 37.3 Russia 14.0 Algeria 37.1 Trinidad 13.8 Qatar 20.0 Oman 10.5 Kazakhstan 16.6 Papua New Guinea 9.6 Bolivia 16.1
- 74. 6.4) Market Players @Hassan Harraz 2018 LNG Life Cycle 74 The Most Notable Recent LNG Market Changes: Volumetric changes observed over the last five years were the entry of Egypt and growth of China and India on the importing side. On the exporting side, Australia is the game changer, with exported volume more than doubling over these five years. Changes in Top LNG Market Changes, since 2011
- 75. Global gas trade by year @Hassan Harraz 2018 LNG Life Cycle 75
- 76. Why is demand increasing? Increased installation of Combine Cycle power plants for increased efficiencies Environmental concerns: Natural gas is ‘cleaner’ than petroleum and coal Worries over the abundance of conventional fuel supplies: natural gas reserves to last 30yrs longer than oil. @Hassan Harraz 2018 LNG Life Cycle 76
- 77. @Hassan Harraz 2018 LNG Life Cycle 77
- 78. @Hassan Harraz 2018 LNG Life Cycle 78
- 79. 7) LNG COST @Hassan Harraz 2018 LNG Life Cycle 79
- 80. 7.1) Natural Gas Price Formation Oil Price Escalation (OPE). Gas-on-Gas Competition (GOG). Bilateral Monopoly (BIM). Netback from Final Product (NET) . Regulation: Social and Political (RSP). Regulation: Below Cost (RBC). Regulation: Cost of Service (RCS). No Price (NP) @Hassan Harraz 2018 LNG Life Cycle 80
- 81. Natural Gas Price Formation Mechanisms @Hassan Harraz 2018 LNG Life Cycle 81
- 82. Current LNG Cost Competitiveness Source: Marcy Darsey et al, Liquefied Natural Gas, Exploring Energy, Inc.’s Future with a Developing Field, UH Law Center, 2004 @Hassan Harraz 2018 LNG Life Cycle 82
- 83. 7.2) Liberalizing Market Dynamics Liquidity of global markets continues to grow. There is a clear trend in moving towards more competitive pricing, as illustrated by the European imports market chart. Gas on gas competition drove the pricing of over half of all pipeline imports and a quarter of LNG, and 49% of all imports combined. Increasing interconnectedness of the international gas markets is causing regional price gaps to narrow, with a particular benefit to the traditionally more - expensive Asian markets. @Hassan Harraz 2018 LNG Life Cycle 83 Liberalizing Market Dynamics in Pricing
- 84. Natural Gas World Price Formation Shares (2016) @Hassan Harraz 2018 LNG Life Cycle 84
- 85. 7.3) Regional Price Differences
- 86. Global Price Convergence Trend @Hassan Harraz 2018 LNG Life Cycle 86
- 87. @Hassan Harraz 2018 LNG Life Cycle 87 Natural Gas Regional Price Trend
- 88. 7.4) Cost of LNG Plant
- 89. 7.5) Liquefaction Costs Transformed 0 100 200 300 400 500 600 700 1990 1995 1999 Trinidad 00 Future LNG $pertonneofcapacity Source: BP 0 50 100 150 200 250 300 350 400 mid 1990 2002 2010 2030 $/tonne Liquefaction Source: IEA Technology improvement, higher capacity plants, improved economies of scale @Hassan Harraz 2018 LNG Life Cycle 89
- 90. 7.6) LNG Greenfield Liquefaction Costs 0 100 200 300 400 500 Qatargas Nigeria LNG Atlantic LNG Rasgas, Qatar Oman LNG $/tpy 1 11 1 2 Source: OGJ The main cost-cutting measures put into effect include improvements in the design efficiency of LNG plant, improvements in liquefaction technology, and improved economies of scale. The improvements in liquefaction technology have included optimization of air and water- cooling, and a reduction in design redundancy. @Hassan Harraz 2018 LNG Life Cycle 90
- 91. Tanker Cost are Dropping LNG Shipping Costs LNG Spot Cargo - Volume @Hassan Harraz 2018 LNG Life Cycle 91
- 92. LNG costs are declining: Natural gas can be economically produced and delivered to the U.S.A. as LNG in a price range of about $2.50 - $3.50/MMBTU depending largely on shipping cost. LNG COSTS ARE DECLINING Does not include feedstock prices 2.5 1.8 0.5 0.1 0.1 0 0.5 1 1.5 2 2.5 1980's Liquefaction Shipping Regasification and Storage 2000's $/MMBTU Sources: El Paso How Much Does LNG Cost? @Hassan Harraz 2018 LNG Life Cycle
- 93. LNG Project Costs Will Continue Dropping 0 100 200 300 400 500 600 700 800 mid 1990 2002 2010 2030 $/tonneofcapacity Regasification and Storage Shipping Liquefaction Shipping Source : IEA @Hassan Harraz 2018 LNG Life Cycle 93
- 94. Average Cost Breakdown of Liquefaction Project by Construction Component Source: Oxford Institute for Energy Studies @Hassan Harraz 2018 LNG Life Cycle 94
- 95. Average Liquefaction Unit Costs in $/tonne (real 2014) by Project Type, 2000 -2020 Sources: IHS, Company Announcements @Hassan Harraz 2018 LNG Life Cycle 95
- 96. Natural Gas Price (2009) USA 4 $/MMBtu Europe 6 $/MMBtu Japan 9 $/MMBtu 16 $/MMBtu (Aug 2011) (Source) Institute of Energy Economics Japan (IEEJ) @Hassan Harraz 2018 LNG Life Cycle 96
- 97. 8) NATURAL GAS CONTRACTURAL @Hassan Harraz 2018 LNG Life Cycle 97
- 98. 8.1 ) Natural Gas Contractural Terms
- 99. 8.1) Natural Gas Contractural Terms (..cont.)
- 100. 8.2) Natural Gas Contract Types
- 101. 8.3) Natural Gas Contract Trends: Growing Flexibility
- 102. Natural Gas Contract Trends: Growing Flexibility @Hassan Harraz 2018 LNG Life Cycle 102
- 103. Conclusion
- 105. Outline of Lectures: Topic 1: Natural Gas (Overview). Topic 2: Unconventional Gas Reservoir Topic 3: Shale Gas Topic 4:Coalbed Methane (CBM) Topic 5: Tight Reservoir Topic 6: Gas Hydrates Topic 7: Hydraulic Fracturing. Topic 8 : Separating and Treating Well Fluids Topic 9 : Natural Gas Processes Topic 10 : Liquefied Natural Gas (LNG) Life Cycle Overview. Topic 11 : Egyptian Natural Gas Resource (Overview). @Hassan Harraz 2018 Nature Gas 105