Plastic packaging factsheet
•
1 gefällt mir•1,041 views

Factsheet with basic information about plastic packaging industry in Vietnam.
Empfohlen

Empfohlen
Weitere ähnliche Inhalte
Was ist angesagt?
Was ist angesagt? (20)
Andere mochten auch
Andere mochten auch (7)
Ähnlich wie Plastic packaging factsheet
Ähnlich wie Plastic packaging factsheet (20)
Mehr von Hieu Nguyen
Mehr von Hieu Nguyen (12)
Kürzlich hochgeladen
Kürzlich hochgeladen (20)
Plastic packaging factsheet
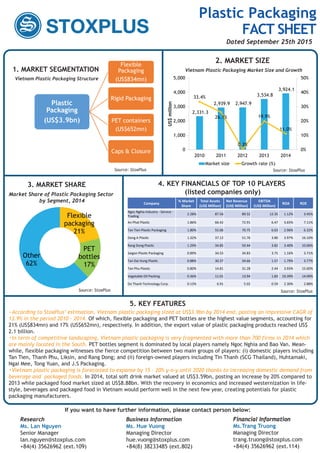
- 1. 5. KEY FEATURES 2. MARKET SIZE 1. MARKET SEGMENTATION Source: StoxPlusSource: StoxPlus Vietnam Plastic Packaging Market Size and Growth Source: StoxPlus Plastic Packaging (US$3.9bn) Flexible Packaging (US$834mn) Rigid Packaging PET containers (US$652mn) Caps & Closure 2,331.3 2,939.9 2,947.9 3,534.8 3,924.1 33.4% 26.1% 0.3% 19.9% 11.0% 0% 10% 20% 30% 40% 50% 0 1,000 2,000 3,000 4,000 5,000 2010 2011 2012 2013 2014 US$million Market size Growth rate (%) According to StoxPlus’ estimation, Vietnam plastic packaging sized at US$3.9bn by 2014 end, posting an impressive CAGR of 13.9% in the period 2010 – 2014. Of which, flexible packaging and PET bottles are the highest value segments, accounting for 21% (US$834mn) and 17% (US$652mn), respectively. In addition, the export value of plastic packaging products reached US$ 2.1 billion. In term of competitive landscaping, Vietnam plastic packaging is very fragmented with more than 700 firms in 2014 which are mainly located in the South. PET bottles segment is dominated by local players namely Ngoc Nghia and Bao Van. Mean- while, flexible packaging witnesses the fierce competition between two main groups of players: (i) domestic players including Tan Tien, Thanh Phu, Liksin, and Rang Dong; and (ii) foreign-owned players including Tin Thanh (SCG Thailand), Huhtamaki, Ngai Mee, Tong Yuan, and J.S Packaging. Vietnam plastic packaging is forecasted to expanse by 15 – 20% y-o-y until 2020 thanks to increasing domestic demand from beverage and packaged foods. In 2014, total soft drink market valued at US$3.59bn, posting an increase by 20% compared to 2013 while packaged food market sized at US$8.88bn. With the recovery in economics and increased westernization in life- style, beverages and packaged food in Vietnam would perform well in the next few year, creating potentials for plastic packaging manufacturers. Vietnam Plastic Packaging Structure Flexible packaging 21% PET bottles 17% Other 62% Market Share of Plastic Packaging Sector by Segment, 2014 3. MARKET SHARE 4. KEY FINANCIALS OF TOP 10 PLAYERS (listed companies only) Source: StoxPlus Company % Market Share Total Assets (US$ Million) Net Revenue (US$ Million) EBITDA (US$ Million) ROA ROE Ngoc Nghia Industry - Service - Trading 2.28% 87.56 89.32 12.35 1.12% 3.45% An Phat Plas c 1.86% 66.42 72.91 6.47 3.65% 7.11% Tan Tien Plas c Packaging 1.80% 55.06 70.75 6.63 2.96% 6.32% Dong A Plas c 1.32% 37.12 51.76 3.80 3.97% 16.10% Rang Dong Plas c 1.29% 34.85 50.44 3.82 3.40% 10.06% Saigon Plas c Packaging 0.89% 34.55 34.83 3.75 1.16% 3.71% Tan Dai Hung Plas c 0.88% 30.37 34.66 1.57 1.79% 3.77% Tan Phu Plas c 0.80% 14.81 31.28 2.44 3.93% 15.60% Vegetable Oil Packing 0.36% 11.01 13.94 1.83 10.39% 14.09% Do Thanh Technology Corp. 0.13% 6.91 5.02 0.59 2.30% 2.88% If you want to have further information, please contact person below: Research Ms. Lan Nguyen Senior Manager lan.nguyen@stoxplus.com +84(4) 35626962 (ext.109) Business Information Ms. Hue Vuong Managing Director hue.vuong@stoxplus.com +84(8) 38233485 (ext.802) Financial Information Ms.Trang Truong Managing Director trang.truong@stoxplus.com +84(4) 35626962 (ext.114) Research Business Information Financial InformationResearch Business Information Financial Information Plastic Packaging FACT SHEET Dated September 25th 2015